

Solana on-chain metrics suggest rising activity and declining fees, supporting bullish outlook

Source Fxstreet
  • Solana on-chain activity shows signs of growth in the last thirty days. 
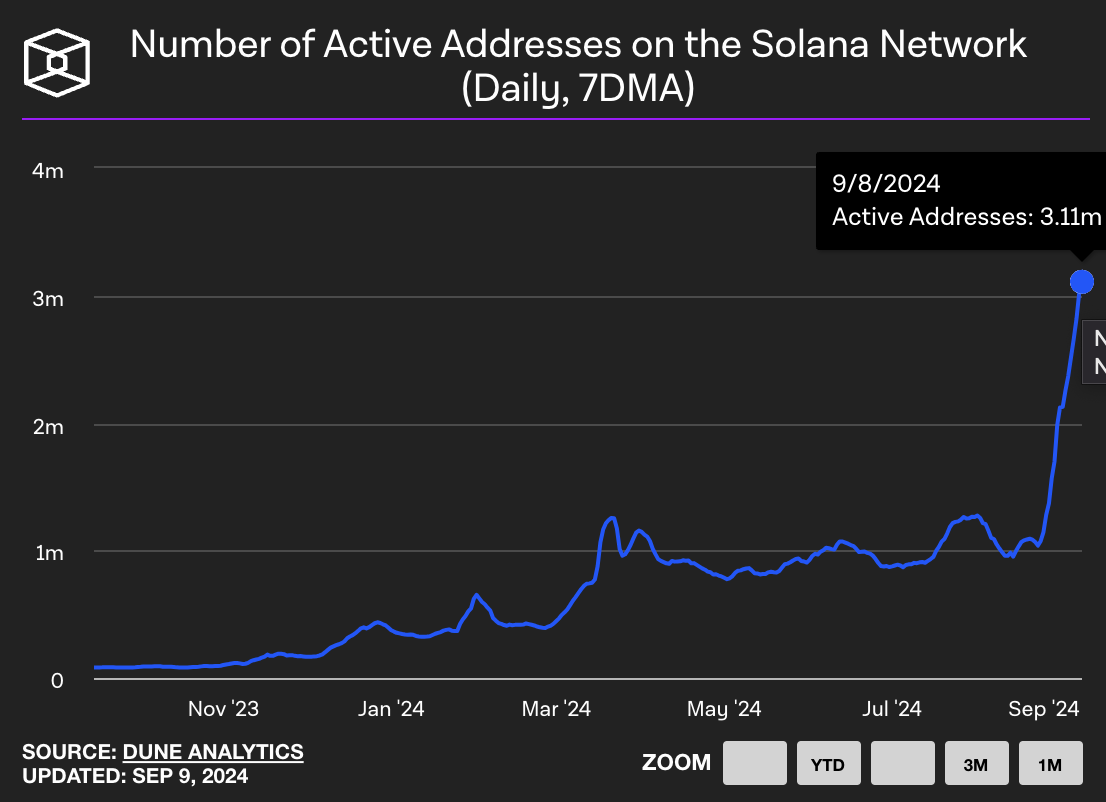
  • Daily active addresses grow threefold, rising to 3.11 million on Monday. 
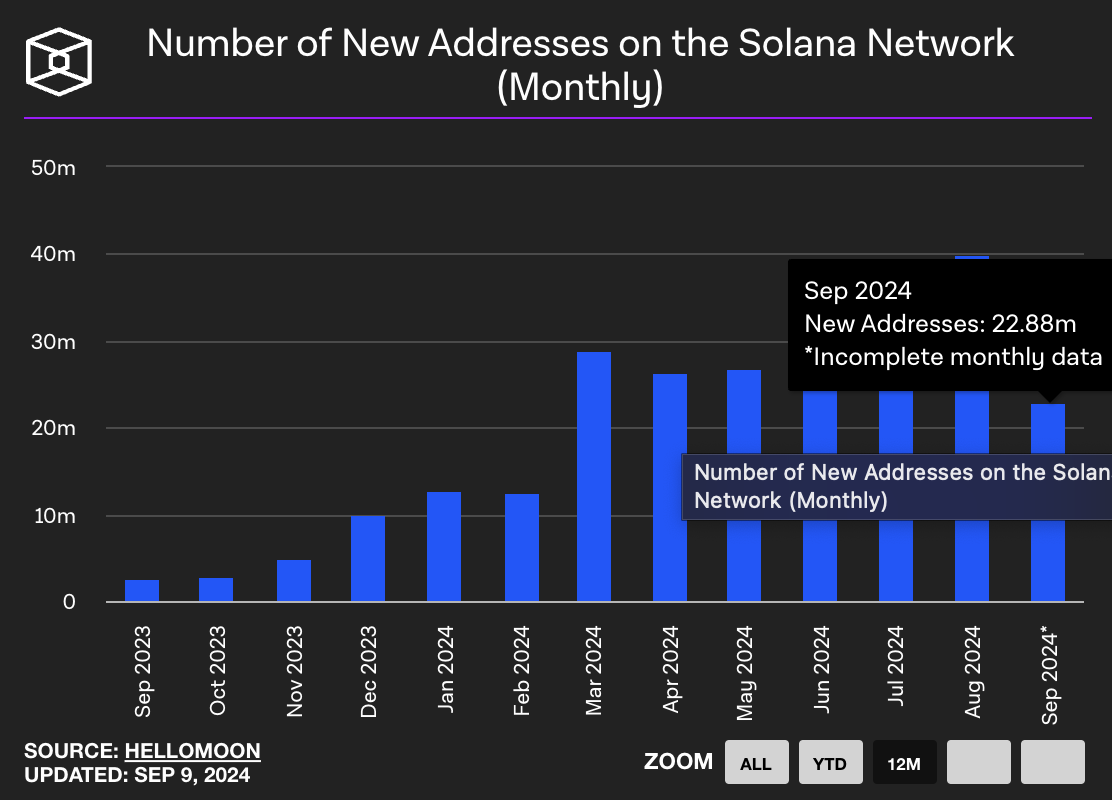
  • The number of new addresses on Solana in the first ten days of September is more than half of that registered in  August for the entire month. 
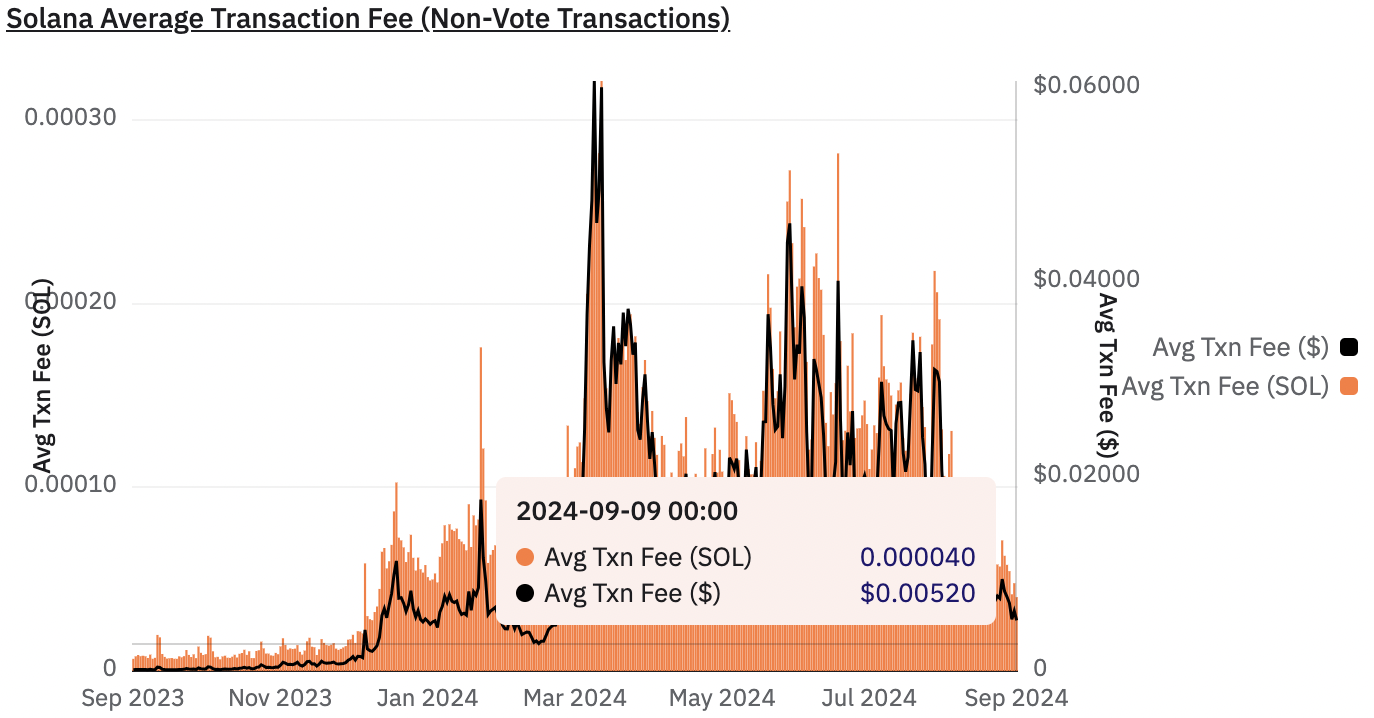
  • Solana network’s average transaction fee is down 68% in the last thirty days. 

Solana (SOL) price could be set for a rally as the altcoin’s on-chain activity has increased significantly in the last thirty days. The Ethereum-competitor chain has observed a steep decline in transaction fees and a rise in daily active addresses, likely driving higher demand for SOL and Solana-based assets among crypto market participants. 

Solana metrics signal growth potential 

Data from Dune Analytics, a crypto intelligence platform, shows that Solana has noted an increase in the daily active addresses. The metric tracks the activity of wallet addresses active on the SOL chain. A rise in active addresses is typically associated with an increase in demand for the altcoin or higher utility among traders. 

SOL daily active addresses have climbed threefold in the last 30 days to 3.11 million, highest level in nearly one year. 
Solana

Daily active addresses in Solana 

Meanwhile, the number of new addresses has also increased significantly. The indicator tracks new wallet addresses created, in this case on the SOL chain, a factor that is associated with rising demand for the altcoin. An increase is often considered a sign of higher adoption. 

Within the first ten days of September, the number of new addresses created stood at 22.88 million, according to Hellomoon data, representing 57% of August’s overall number of new addresses. This shows a fast-paced adoption of SOL among new traders.
Solana

Number of new addresses on Solana 

Traders adopt a chain based on the fees charged when making transfers across the network. Solana’s average transaction fee stands at $0.00520, according to Dune Analytics data, a 68% decline since August 9.
Solana

Solana Average Transaction Fee

At the time of writing, Solana trades at $133.83, down less than 1% on the day. 

Disclaimer: For information purposes only. Past performance is not indicative of future results.
placeholder
Big Tech's $800 billion AI bill faces its first real test — free cash flow is the judgeAlphabet and Microsoft report after the close on October 28, Amazon on October 29, with hyperscaler AI capex running near $800 billion a year. Meta's negative free cash flow and 9.40% drop on October 22 was the warning; this week's prints decide whether cloud growth and backlog can pay for the buildout. Here are the consensus numbers, the free-cash-flow table and the two-sided test.
Author  Irene Q.
Oct 26, Mon
Alphabet and Microsoft report after the close on October 28, Amazon on October 29, with hyperscaler AI capex running near $800 billion a year. Meta's negative free cash flow and 9.40% drop on October 22 was the warning; this week's prints decide whether cloud growth and backlog can pay for the buildout. Here are the consensus numbers, the free-cash-flow table and the two-sided test.
placeholder
Anthropic files for a $2 trillion IPO — the $80.7 billion loss is the decoy, the $450 billion compute bill is the riskAnthropic publicly filed its S-1 on October 26, revealing $16.29 billion of first-half revenue (+1,304% year over year) and a $80.7 billion net loss — of which $72.4 billion is a non-cash convertible-note charge. The real number is the $450 billion of signed, mostly non-cancelable compute commitments. Here is what the filing says, why NVDA, ARM and MU are the tradeable read-through, and the conditions that decide whether the AI trade passes its first public valuation test.
Author  Irene Q.
Oct 27, Tue
Anthropic publicly filed its S-1 on October 26, revealing $16.29 billion of first-half revenue (+1,304% year over year) and a $80.7 billion net loss — of which $72.4 billion is a non-cash convertible-note charge. The real number is the $450 billion of signed, mostly non-cancelable compute commitments. Here is what the filing says, why NVDA, ARM and MU are the tradeable read-through, and the conditions that decide whether the AI trade passes its first public valuation test.
placeholder
Fed October Rate Decision Preview: Rate Hike Pause Has Become Consensus, How Will US Stocks, Dollar, and Gold React?The Federal Reserve will announce its October interest rate decision at 14:00 Eastern Time on October 28, and Fed Chair Warsh will hold a press conference at 14:30. Markets currently wide
Author  TradingKey
Oct 27, Tue
The Federal Reserve will announce its October interest rate decision at 14:00 Eastern Time on October 28, and Fed Chair Warsh will hold a press conference at 14:30. Markets currently wide
placeholder
Brent's $115 front month sits $4.6 above January — the $14 spread to WTI is the supply-risk premiumDecember Brent trades at $115.29 while January is $110.71, a $4.58 backwardation. The December Brent-WTI spread is $14.2, versus a $3-5 normal. That gap, not the headline, is where the Middle East supply risk is priced. Here is what the curve says, why the December contract's expiry on October 30 will mechanically cut the headline by $4.6, and the 108.81 neckline that decides the next move.
Author  Irene Q.
Yesterday 06: 21
December Brent trades at $115.29 while January is $110.71, a $4.58 backwardation. The December Brent-WTI spread is $14.2, versus a $3-5 normal. That gap, not the headline, is where the Middle East supply risk is priced. Here is what the curve says, why the December contract's expiry on October 30 will mechanically cut the headline by $4.6, and the 108.81 neckline that decides the next move.
placeholder
Gold Price Analysis Today | Forex Gold Analysis | XAU/USD Analysis - October 29, 2026Get the latest gold price analysis, forex gold insights, and XAU/USD analysis for October 29, 2026. Read on for the details.
Author  Mitrade
6 hours ago
Get the latest gold price analysis, forex gold insights, and XAU/USD analysis for October 29, 2026. Read on for the details.
Related Instrument
goTop
quote