


Injective Price Prediction: Volan Mainnet Upgrade fails to catalyze recovery after 20% slump
- Injective price is down 20% since January 12 when the Volan Mainnet Upgrade was completed.
- INJ could lose the $31.00 critical support amid falling momentum and multiple bearish on-chain metrics.
- The bearish thesis will be invalidated if the altcoin overcomes the $45.30 range high.
Injective (INJ) price has been on a steep load-shedding exercise for the past week, joining the broader market dump. Bitcoin (BTC) is leading the pack with a break below the $40,000 psychological level as markets bleed in the wake of increasing volatility. For INJ, however, the situation is different, considering a strikingly bullish development completing in the network barely a week ago.
Also Read: Injective price braces for volatility ahead of nearly $150 million worth of INJ token unlocks
Injective price falls despite Volan Mainnet Upgrade completion
On January 12, the Volan Mainnet Upgrade was completed, marking a new era for the Injective ecosystem, according to an official post on X.
The upgrade, advertised as the world’s first Real World Assets (RWA) Module, is an innovation that allows developers to create and manage permissioned assets. In so doing, it establishes a new standard in the blockchain realm while paving the way for enhanced institutional adoption.
Among the perks that come with the Volan Mainnet Upgrade include interoperability expansion. Specifically, the Injective network becomes more interoperable with a superior version of the IBC Protocol. This enables direct, efficient cross-chain transactions and interactions with Web3 financial modules.
Other benefits include:
- Enhanced enterprise-grade scalability, which reduces latency by up to 90% for institutional users, reinforcing Injective as the fastest L1 for finance.
- Empowers dApps with direct integration of off-chain price feeds.
- Significant tweaks in token economics, with Injective making INJ token increasingly deflationary.
- Capability to burn any bank token generated on Injective.
With these, the Injective network says the future of finance is unfolding within its ecosystem.
Nevertheless, despite the magnitude of the milestone, the Injective price continues down a cliff, with the $31.00 critical support now under threat.
Injective price outlook as INJ tests a critical support
Recording a steep nosedive, the Injective price is testing the critical support at $31.00, with prospects for extended losses. The Relative Strength Index (RSI) mirrors the price action to show momentum is falling fast.
The Moving Average Convergence Divergence (MACD) indicator has remained subdued, stuck below its signal line (orange band) following a bearish crossover in late December. The bearish crossover happened when the MACD crossed below the signal line on December 27.
Increased selling pressure could see the Injective price break below the $31.00 support to collect the buy-side liquidity residing underneath. An extended fall could send the AI crypto coin to $25.00 before a possible test of the 100-day Simple Moving Average (SMA) at $24.54.
In a dire case, the dump could see the Injective price extend a leg down to tag the $19.15 support in a move that would denote a nearly 40% crash below current levels.
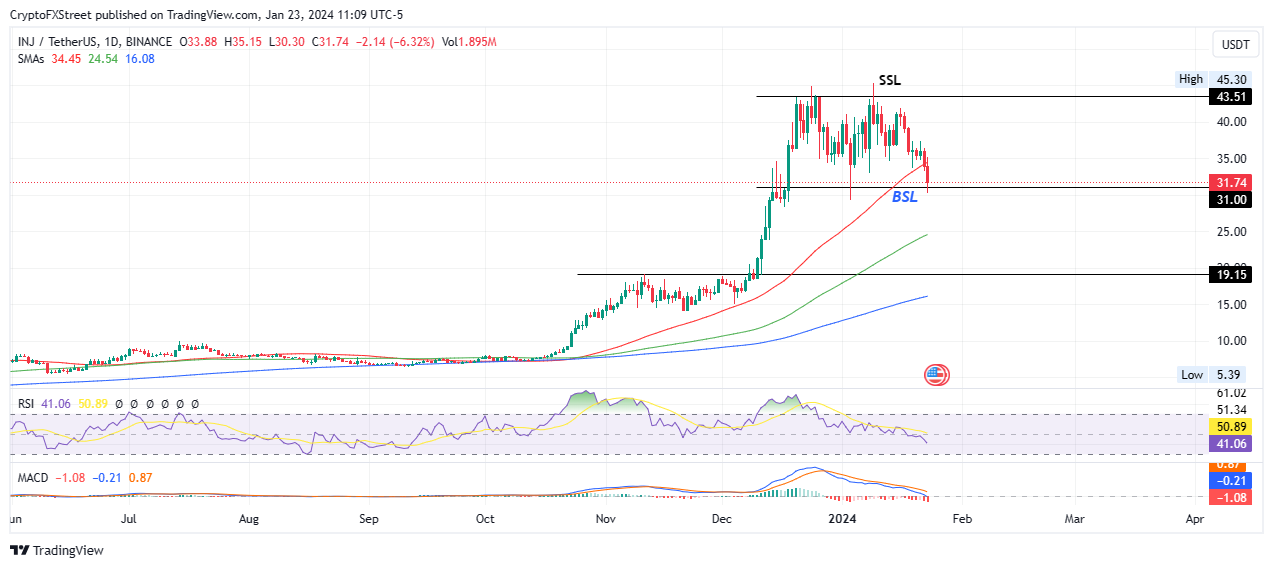
INJ/USDT 1-day chart
On-chain metrics supporting bearish outlook for INJ
Besides the technical indicators, multiple on-chain metrics also corroborate the bearish outlook for Injective price. The daily active addresses metric, showing the number of unique addresses involved in INJ transactions daily, plummeted from 790 to 557 between January 22 and 23, representing a 29% drop in under 24 hours.
Social dominance has also dropped, moving from a peak of 1.30% to 0.18% within the day. Social volume descended from 12 to 3 between Monday and Tuesday, constituting a 75% reduction in the overall mentions of the INJ token across crypto-related social media.
%20[18.55.12,%2023%20Jan,%202024]-638416302723109989.png)
INJ Santiment: Daily active addresses, social dominance, social volume
IntoTheBlock’s In/Out of the Money Around Price (IOMAP) model shows Injective price can expect formidable resistance between the $33.78 and $34.74 range, where 708 addresses hold 457,240 INJ tokens purchased at an average price of $34.33.
Furthermore, with 67% of INJ token holders sitting on unrealized profit (out of the money), this cohort of traders is likely to book profits once they break even. The ensuing selling pressure could enhance the downtrend for the Injective price.
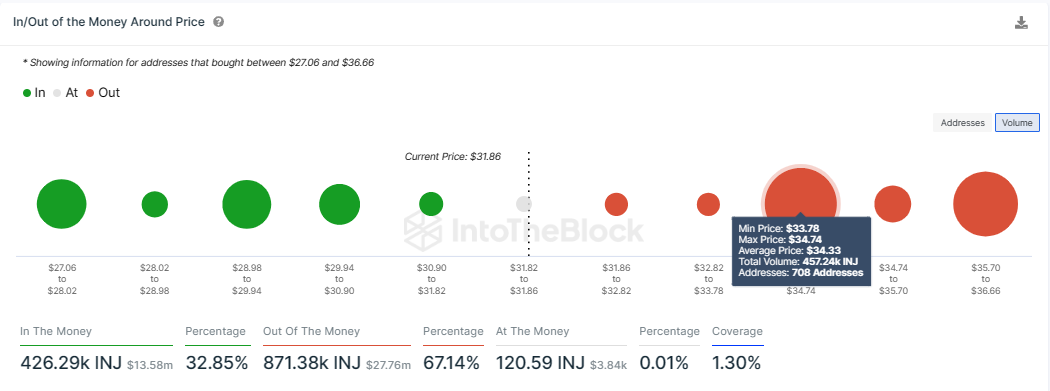
INJ IOMAP Model
Conversely, if investors seize the opportunity to buy the dip, the Injective price could flip the 50-day SMA into support before springboarding above it toward the $41.51 resistance level. The highly bullish case could see INJ collect the sell-side liquidity above the aforementioned blockade, before clearing the $45.30 range high.
For the meantime, however, the $31.00 support could hold with Injective price likely to pivot here.
Recommended Articles


