


Bitcoin bleeds below $40,000 in crypto market bloodbath, sign of recovery or concerning dip?
- Bitcoin price plummeted below the $40,000 level on Monday, alongside altcoins with large market capitalization.
- Bitcoin is poised for a recovery according to on-chain metrics from Santiment.
- BTC price recovery depends on the market sentiment, continued pessimism could trigger a bounce in Bitcoin.
Bitcoin price hit a low of $39,400 on Monday after a market-wide bloodbath ushered in a correction in cryptocurrencies with a large market capitalization. BTC made a comeback above the psychological level of $40,000 on Tuesday, and on-chain metrics are showing signs of a further recovery in the asset.
Also read: Bitcoin price is above $41,000 as BTC whales make strategic moves
Daily Digest Market Movers: Bitcoin recovery likely amidst bullish signs in on-chain metrics
- Bitcoin price dropped to a $39,400 low on January 22 as Grayscale’s GBTC noted a $640 million outflow. BTC ETF outflows picked up pace on Monday, acting as one of the key drivers for Bitcoin price decline.
- Bloomberg ETF analyst, James Seyffart shared details of capital inflow/outflows to BTC ETFs in a recent tweet:
- The Bitcoin derivatives market shuddered in response to BTC’s price drop below the $40,000 psychological level.
- Coinglass data indicates $50.47 million in long positions and $12.23 million in short positions were liquidated in the past 24 hours. Bitcoin derivatives traders suffered $62.7 million in liquidations in a 24 hour timeframe. Bitcoin options volume declined nearly 40% and open interest dipped by 3%, following the concerning drop in the asset’s price.
- While the price statistics paint a grim picture of Bitcoin recovery, on-chain metrics signal that there is bullish potential in BTC.
- Analysts from on-chain metric platform Santiment assessed Monday’s crypto market crash and identified signs of recovery in Bitcoin.
- The Market Value to Realized Value (MVRV) metric reads negative 7.187% on Tuesday. MVRV peaked at 8.59% on January 8, days ahead of the SEC’s decision on spot Bitcoin ETFs. Since the approval, there has been a gradual dip in MVRV, meaning traders who acquired BTC in the past 30 days are sitting on unrealized losses. 7.187% traders are sitting on unrealized losses on their BTC holdings, as of January 23.
- Typically, when MVRV dips in the negative territory below negative 5%, it is followed by a bounce in the asset’s price, if other factors like market sentiment support a recovery.
%20[12.45.55,%2023%20Jan,%202024]-638415931091362565.png)
Bitcoin MVRV Ratio (30-day). Source: Santiment
- The sentiment among traders has gradually improved between January 14 and 23. At its lowest, the weighted sentiment among market participants was negative 0.81, it has climbed to negative 0.35. It's important to note that if sentiment remains in the negative territory, representing market wide pessimism on BTC price recovery, then combined with MVRV below negative 5%, it can be considered a promising sign for a recovery in Bitcoin price.
%20[12.48.46,%2023%20Jan,%202024]-638415931342232537.png)
Bitcoin weighted sentiment. Source: Santiment
Technical analysis: Bitcoin price recovery likely, BTC eyes comeback above $41,400
Bitcoin price is in an uptrend that started on September 11, 2023. Bitcoin price is currently below its two long-term Exponential Moving Averages, 10-day EMA at $41,522 and 50-day EMA at $41,886. BTC price briefly dipped into the support zone between $38,169 and $39,600 where 1 million addresses have acquired 423,590 Bitcoins.
Bitcoin recovered from its decline below $40,000, on Tuesday, likely supported by bullish on-chain metrics. BTC could face resistances at the psychological level of $40,000, the lower boundary of the next resistance zone, at $41,466 and the 50% Fibonacci Retracement of its decline between October 2021 and 2022, at $43,074.
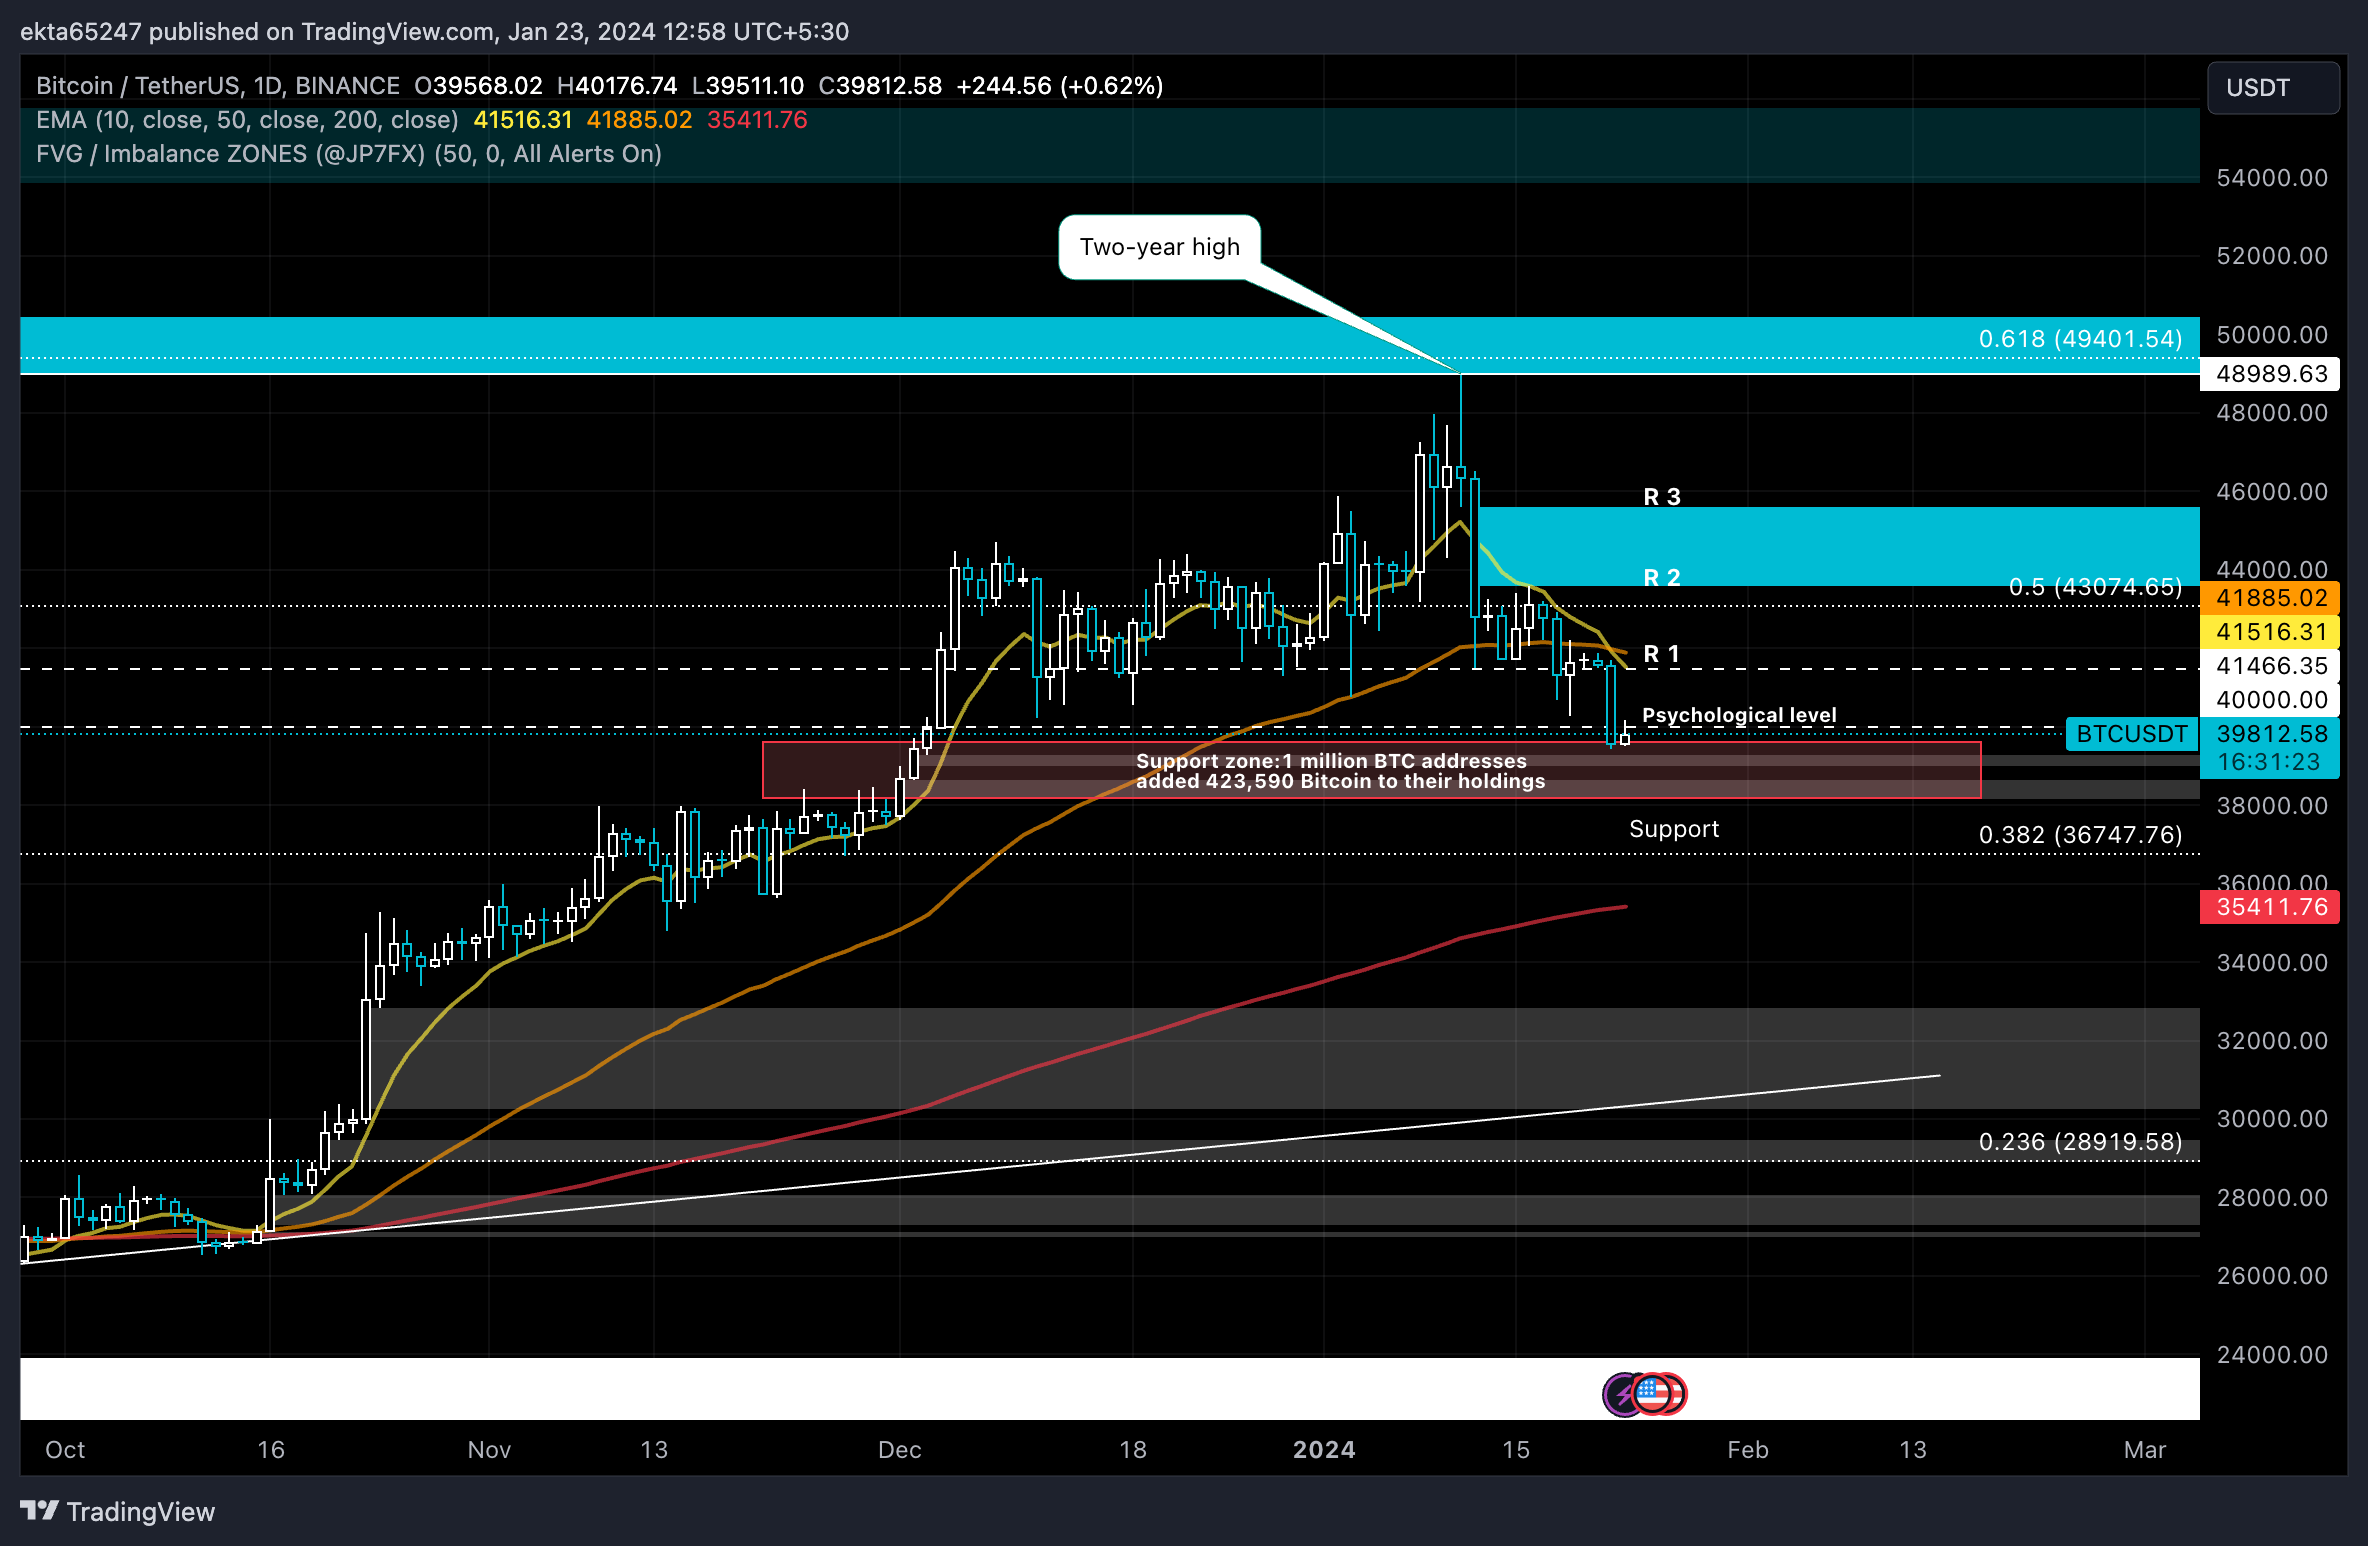
BTC/USDT 1-day chart
A daily candlestick close in the support zone could invalidate the thesis of Bitcoin price recovery. In the event of further decline, Bitcoin could end up in the support zone or nosedive to the 38.2% Fibonacci Retracement level of $36,747.
Bitcoin, altcoins, stablecoins FAQs
What is Bitcoin?
Bitcoin is the largest cryptocurrency by market capitalization, a virtual currency designed to serve as money. This form of payment cannot be controlled by any one person, group, or entity, which eliminates the need for third-party participation during financial transactions.
What are altcoins?
Altcoins are any cryptocurrency apart from Bitcoin, but some also regard Ethereum as a non-altcoin because it is from these two cryptocurrencies that forking happens. If this is true, then Litecoin is the first altcoin, forked from the Bitcoin protocol and, therefore, an “improved” version of it.
What are stablecoins?
Stablecoins are cryptocurrencies designed to have a stable price, with their value backed by a reserve of the asset it represents. To achieve this, the value of any one stablecoin is pegged to a commodity or financial instrument, such as the US Dollar (USD), with its supply regulated by an algorithm or demand. The main goal of stablecoins is to provide an on/off-ramp for investors willing to trade and invest in cryptocurrencies. Stablecoins also allow investors to store value since cryptocurrencies, in general, are subject to volatility.
What is Bitcoin Dominance?
Bitcoin dominance is the ratio of Bitcoin's market capitalization to the total market capitalization of all cryptocurrencies combined. It provides a clear picture of Bitcoin’s interest among investors. A high BTC dominance typically happens before and during a bull run, in which investors resort to investing in relatively stable and high market capitalization cryptocurrency like Bitcoin. A drop in BTC dominance usually means that investors are moving their capital and/or profits to altcoins in a quest for higher returns, which usually triggers an explosion of altcoin rallies.
Recommended Articles


