

Bitcoin price recovery likely as miners add over $250 million worth of BTC to their reserve
- Bitcoin price has been hovering around the $40,000 mark for the past four days, slipping under the 50-day EMA.
- Miners have added more than 6,500 BTC worth over $264 million to their reserves in two weeks as BTC price tanked.
- Miner accumulation has been a positive signal in the past as prices reversed upon their buying spree.
Coincidentally, the NVT Golden Cross is indicating a bullish outlook for the first time in five months.
Bitcoin price is potentially set to take a detour, much to the surprise of the bears, who were expecting further drawdown as signals indicate a recovery at hand. Much of this comes from the miners, who have historically acted as a strong signal of a probable rally.
Bitcoin price hits $40,000
Bitcoin price over the past 24 hours dipped below the $40,000 mark after hovering around it for nearly four days now. Recovering from this low, the cryptocurrency is trading at $40,040 at the time of writing.
Now, considering price indicators such as the Relative Strength Index (RSI), it may seem like the downtrend might continue since the indicator is in the bearish zone below the neutral mark of 50.0.
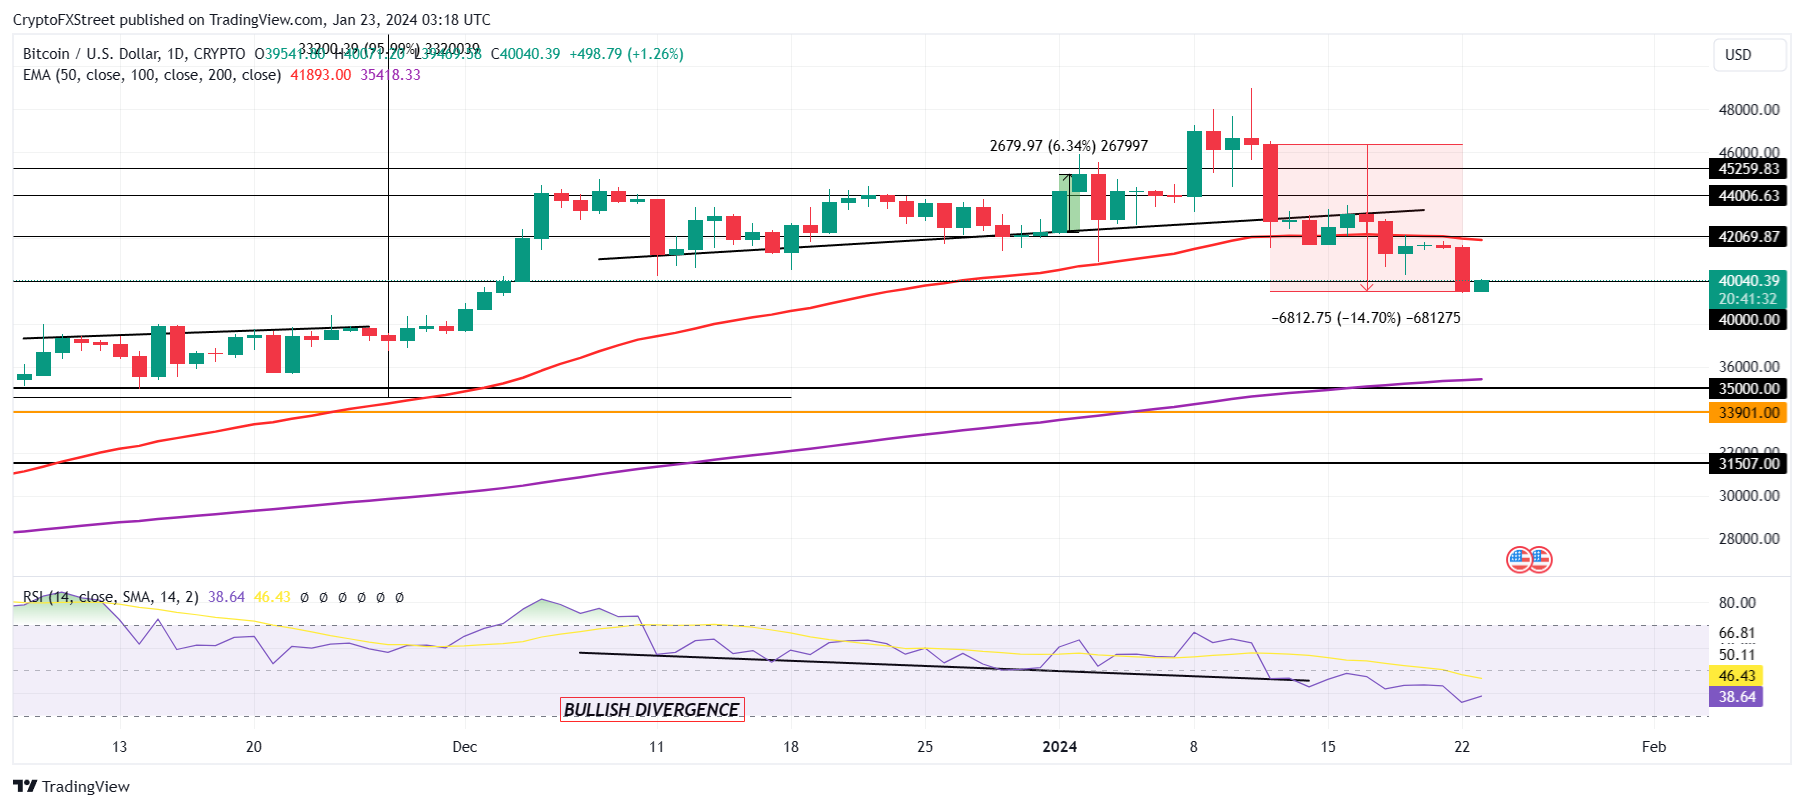
BTC/USD 1-day chart
However, considering broader market cues and a solid bullish reversal signal visible on the chain, a reversal may not be out of the question. Reclaiming the $40,000 mark as a support floor would translate to enough bullish strength for Bitcoin price to climb back towards $42,000. This price point coincides with the 50-day Exponential Moving Average (EMA), and flipping it into support would invalidate the bearish thesis.
Mining reserves suggest a rally is likely
Bitcoin miners are just as strong an indicator as the whales since their actions directly affect the market. Generally, these miners tend to accumulate when the price is low and sell when they see potential profits. In the former event, a rally occurs, while in the latter, a decline takes place. This phenomenon can be observed from past instances when the miner reserves increased and decreased.
In the past couple of days, despite the net flows noting a mix of inflows and outflows, the miner reserves have risen by 6,562 BTC altogether. This $264 million worth of addition of BTC brought the total miner reserves to 1.834 million BTC. This is a positive sign for Bitcoin price since the chances of recovery are high now.
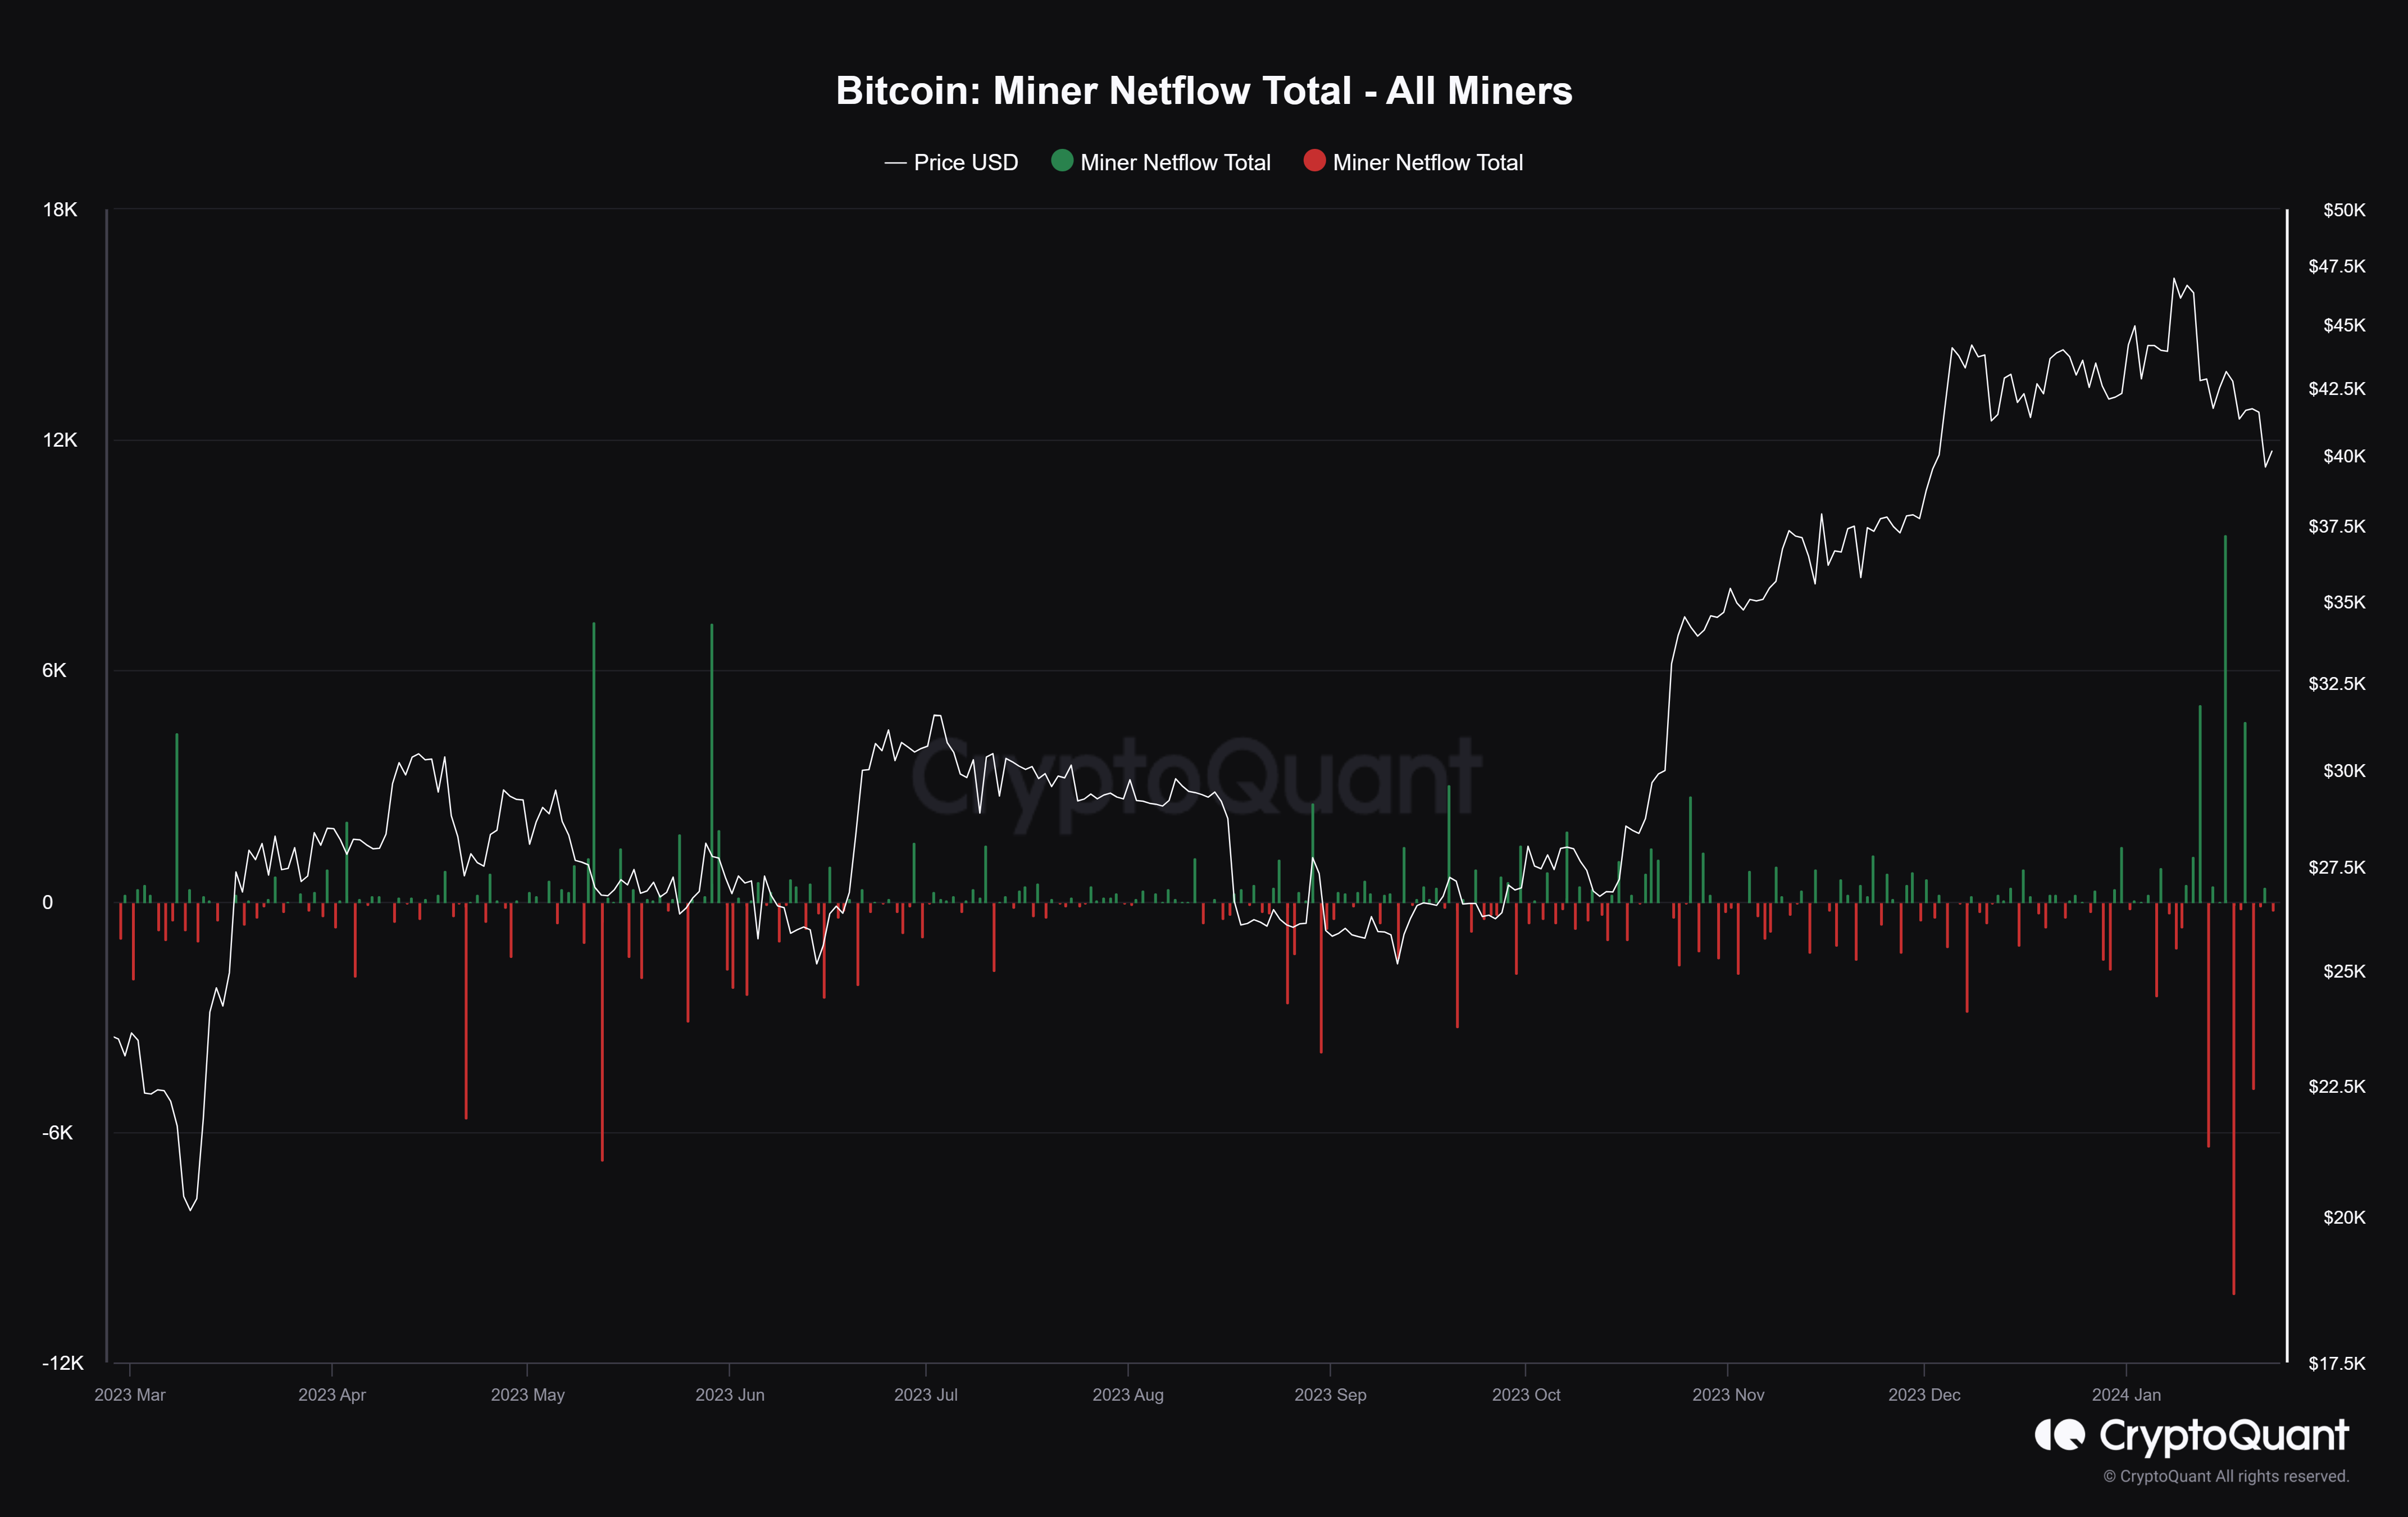
Bitcoin miner net flows
Secondly, the Network Value Transaction (NVT) Golden Cross metric is also making a comeback from the bullish zone under the -1.6 value. The reason behind this bullish assumption is that if the long-term trend is way greater than the short-term trend, the network can be interpreted as underpriced and will soon revert to mean value, translating to a long signal.
Bitcoin fell to -1.7 and only came out of it about 48 hours ago; this was the first time NVT Golden Cross fell to this low in more than five months. Traders consider this to be a long signal since the price tends to make a recovery after hitting the green zone.
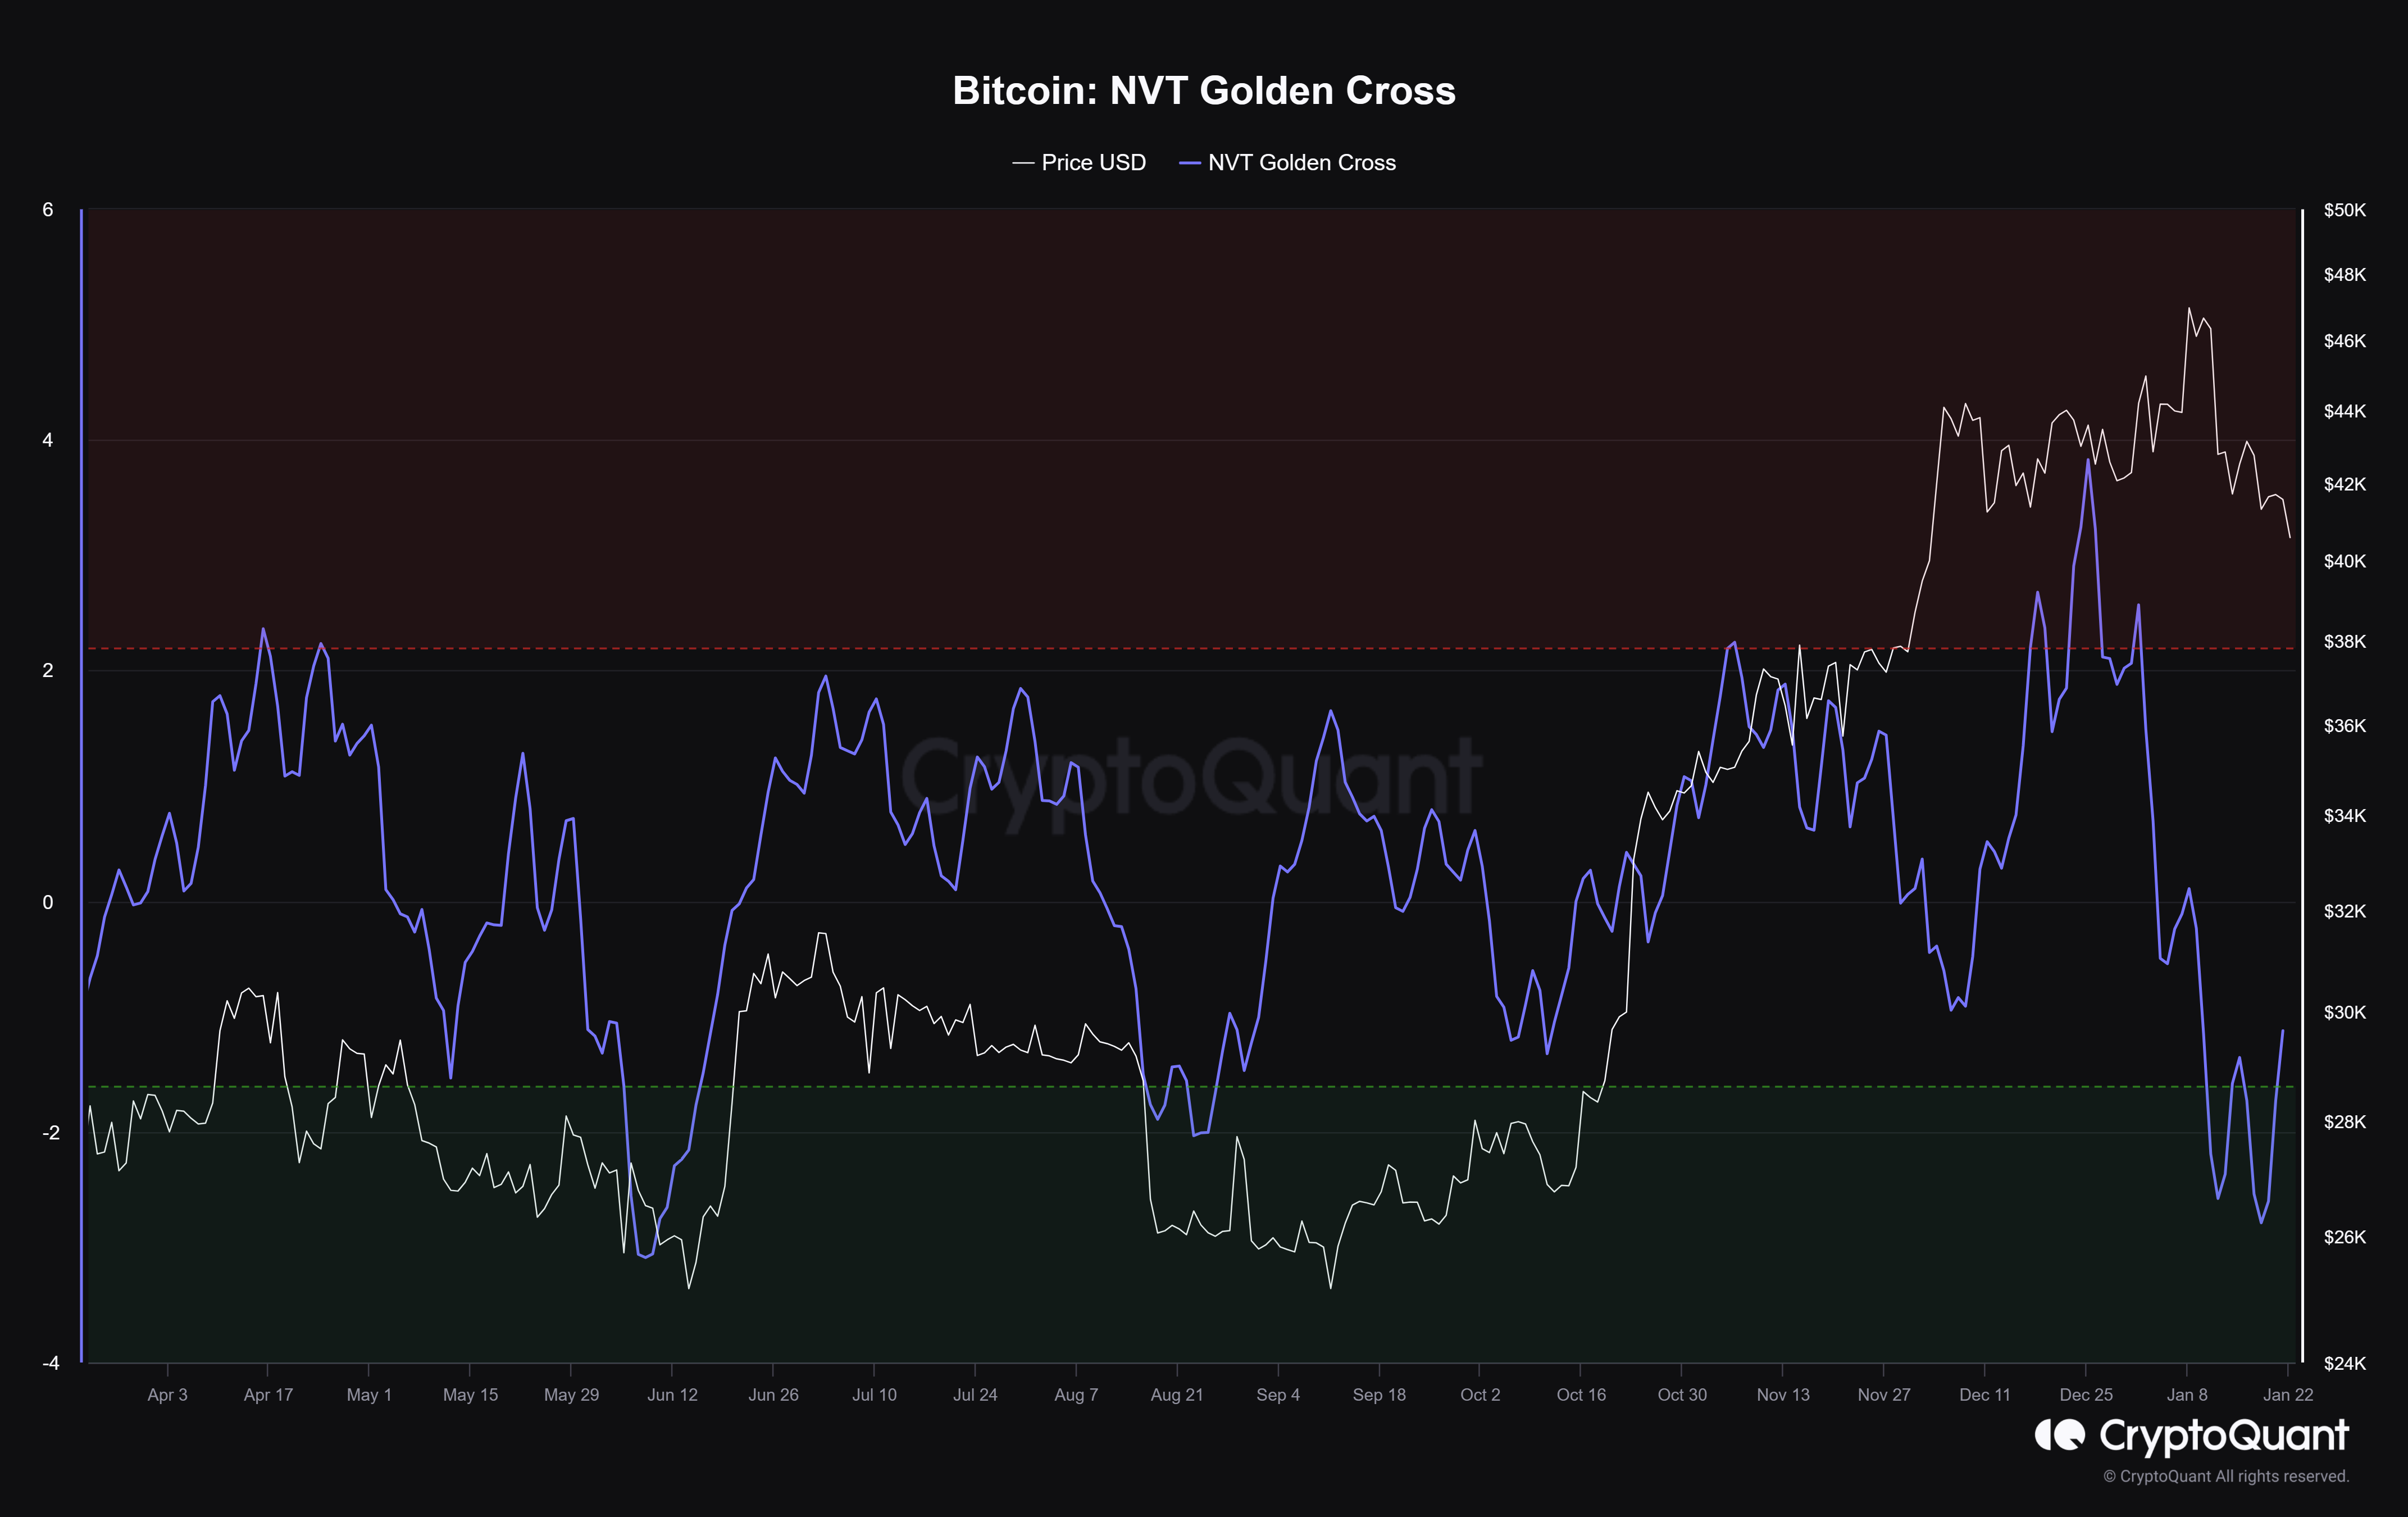
Bitcoin NVT Golden Cross
If history repeats itself, the potential for a recovery is strong, and Bitcoin price could climb back.
Recommended Articles


