

Week Ahead: This week’s altcoin narrative and Bitcoin's fourth halving targets
- Bitcoin price is key to sustaining altcoin rallies This week.
- Investors can expect altcoin categories like AI and newly launched coins to take the spotlight.
- Bitcoin’s fourth halving could extend the 2023 rally and potentially trigger new all-time highs for BTC.
With Bitcoin spot ETF approved, investors are eyeing two major events – BTC’s fourth halving and Ethereum’s spot ETF approval. While the latter will take time, considering the US Securities and Exchange Commission’s (SEC) on-the-fence stance regarding the classification of ETH. So, in this newsletter, let’s take a look at Bitcoin halving and how it affects price.
Read more: Grayscale’s Bitcoin sale unlikely to have driven BTC price lower, profit taking is likely driver
What to expect next week?
The macroeconomic market is going to be silent, but with the launch of new crypto tokens, the volatility is extremely high, and altcoins seem to be highly wound.
So the focus for day traders should be on
- Newly launched coins – ONDO, MANTA, MYRO, SARSO
- AI coins – RNDR, FET, GPT, and ROSE due to NVIDIA's approaching all-time high and Apple’s Vision Pro launch.
- Chinese coins and related meme coins due to the Spring Festival – NEO, ACH and FIL.
While the short-term narrative-based plays are interesting, investors need to focus on the most anticipated event of the year – Bitcoin halving.
Read more: Bitcoin whales rise in numbers signaling strong confidence in BTC rally or positioning for profit taking
What is Bitcoin halving?
Bitcoin blockchain’s rewards are halved once every four years or after 210,000 blocks are mined. So far, BTC has undergone three halvings, reducing its block reward from 50 to 6.25 BTC. The fourth halving is estimated to occur on April 24, 2024, which would further slash the miner reward per block to 3.125 BTC.
Why does BTC halving matter?
Due to the anticipation of this negative supply shock event, investors generally invest ahead of the halving, causing a massive price rally. Considering that BTC ended its bear market in 2023 and has kickstarted a bull run, the halving event is likely going to catapult the pioneer crypto to extend its rally.
A negative supply shock, simply put, is when the demand remains the same or increases, but the supply is reduced. This causes the underlying asset’s demand, aka market value, to surge.
What to expect from fourth Bitcoin halving?
Comparing the last three halvings gives investors a good idea of what to expect, although the past performance does not guarantee future returns. For this experiment, I will be comparing the BTC price action of the halving year.
As seen in the below chart, the first halving for BTC took place on November 28, 2012, and the start of 2012 saw Bitcoin price crash in the first half but continued to rally even after halving.
The second halving was on July 9, 2016, and the start of this year also saw a steep correction but was eventually followed by a swift uptrend that formed a top three weeks before the halving. The correction continued roughly for another three weeks, after which Bitcoin price continued its uptrend.
The third halving was similar to the first halving, where Bitcoin price crashed in the first half, albeit this was caused by the pandemic. Regardless, BTC saw a positive close to the year with remarkable performance.
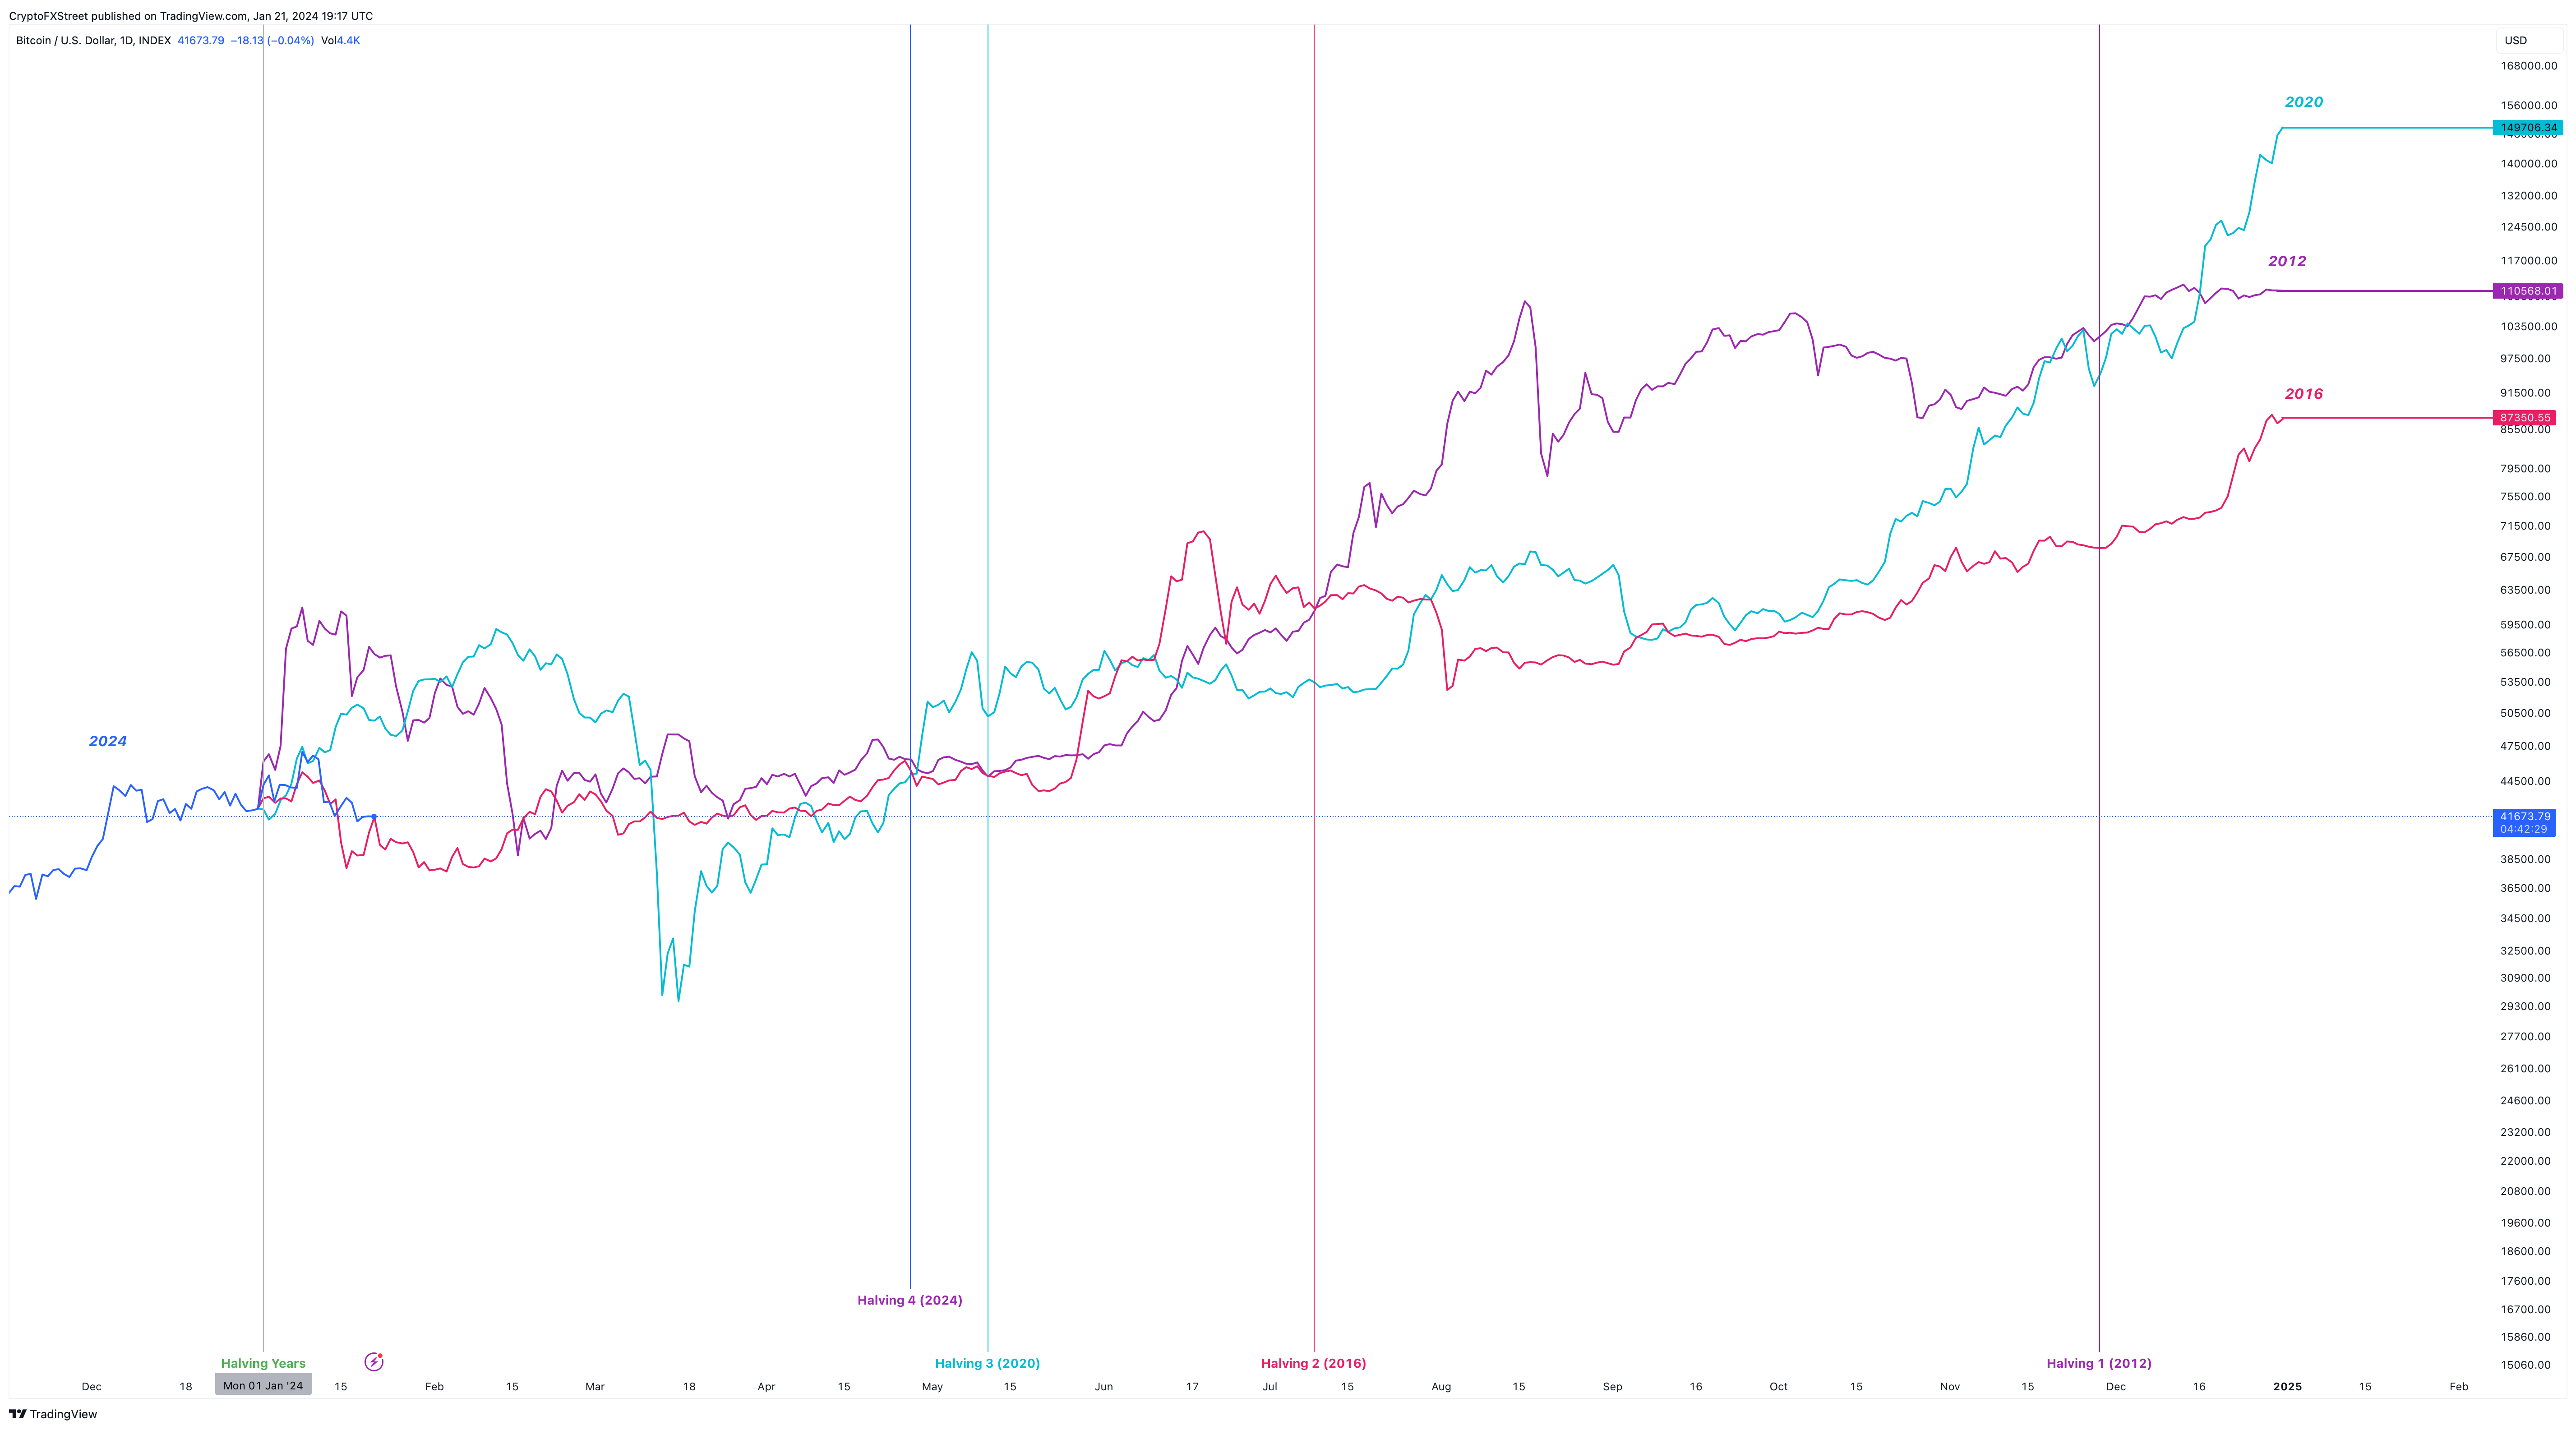
BTC/USD 1-day chart
With this information, one can expect a crude crash in the first two quarters of 2024, following which the pioneer crypto is likely to continue its 2023 bull rally. If not a steep correction, at least a sideways movement in Bitcoin price two-to-four weeks before and after the halving.
How high will Bitcoin price go after the fourth halving?
If history were to repeat itself, although it doesn’t, and we get a similar performance to
- The first halving in 2012: Bitcoin price could hit $110,568 at the end of 2024. This move would forecast a roughly 167% gain from the current position, which is not unheard of in the crypto realm.
- The second halving of 2016: Bitcoin price could set up a new all-time high at $87,350, suggesting another 108% rally from the current position.
- The third halving of 2020: Bitcoin price could hit an all-time high at $149,706, indicating that it could inflate by 259%.
As always, this forecast has to be taken with a grain of salt.
Recommended Articles


