

Bitcoin Weekly Forecast: Will BTC manage to recover from recent market turmoil?
- Mt. Gox continues moving Bitcoin to exchanges for repayments to creditors.
- US spot Bitcoin ETFs registered inflows this week, suggesting confidence among investors.
- Donald Trump will speak at the Bitcoin Conference on Saturday, while Kamala Harris will not attend.
- On-chain data shows a positive exchange inflow, suggesting selling pressure.
Bitcoin (BTC) recovers to $67,000 on Friday after finding support around $63,500 a day before. Still, BTC losses over 1.50% on the week as Mt. Gox persists in transferring Bitcoin to exchanges. US spot Bitcoin ETFs saw inflows this week, with Donald Trump set to speak at the Bitcoin Conference on Saturday and Kamala Harris not attending. On-chain data shows positive exchange inflows, which suggests growing selling pressure that could lead to further price declines if the trend continues.
Mt. Gox continues repayment to creditors
According to data from Akram Intelligence, the Mt. Gox token balance has decreased from 90,000 to 80,000 BTC this week. The Token Balance history shows that since the start of this week, Mt. Gox holdings have been reduced from $6.2 billion to $5.2 billion.
This constant BTC transfer activity from Mt. Gox to exchanges for reimbursement to the creditors may have triggered FUD (Fear, Uncertainty, Doubt) among traders, potentially contributing to a decline in Bitcoin's price this week.
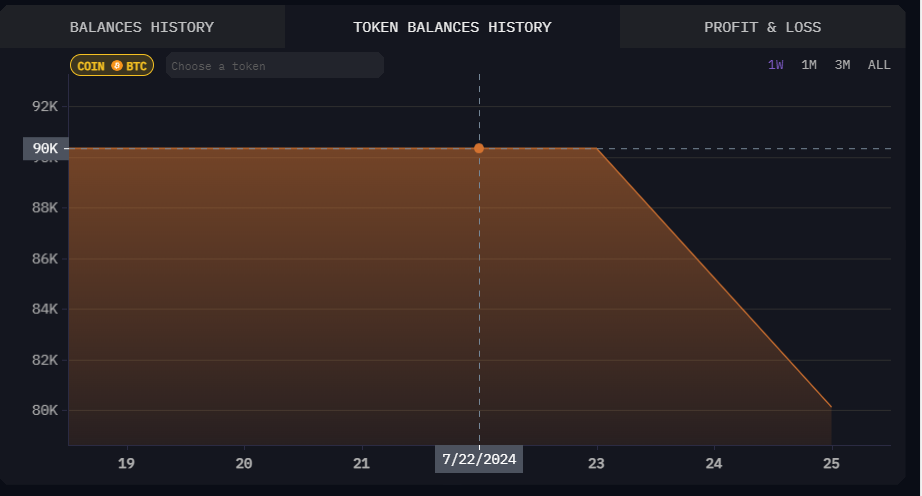
Mt. Gox Token Balances chart
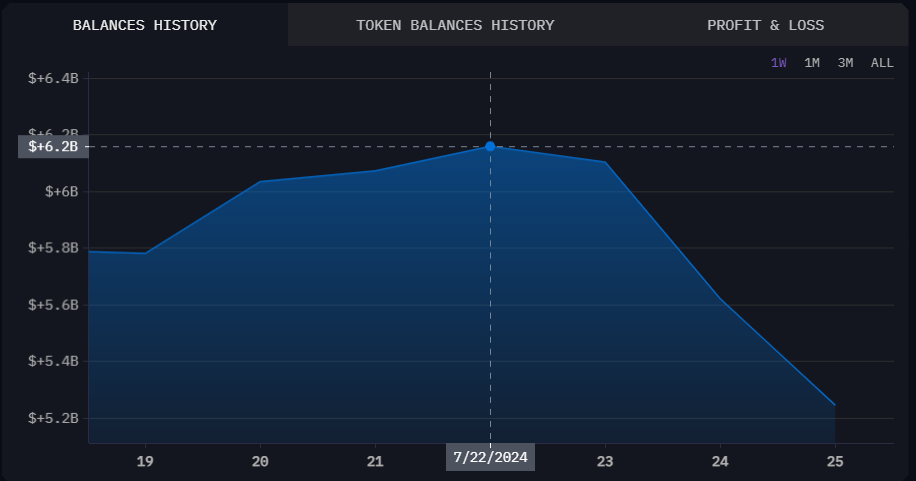
Mt. Gox Balances History chart
US spot Bitcoin ETFs register inflows this week
According to Coinglass data, US spot Bitcoin ETFs experienced three days of inflows and one day of outflows this week until Thursday, totaling $480.30 million in net inflows. These positive net inflows signal growing investor confidence and potentially foreshadow a short-term uptick in Bitcoin's price. Monitoring these ETFs' net inflows is crucial for understanding market dynamics and investor sentiment. As of Thursday, the combined Bitcoin reserves held by these 11 US spot Bitcoin ETFs amounted to $52.14 billion.
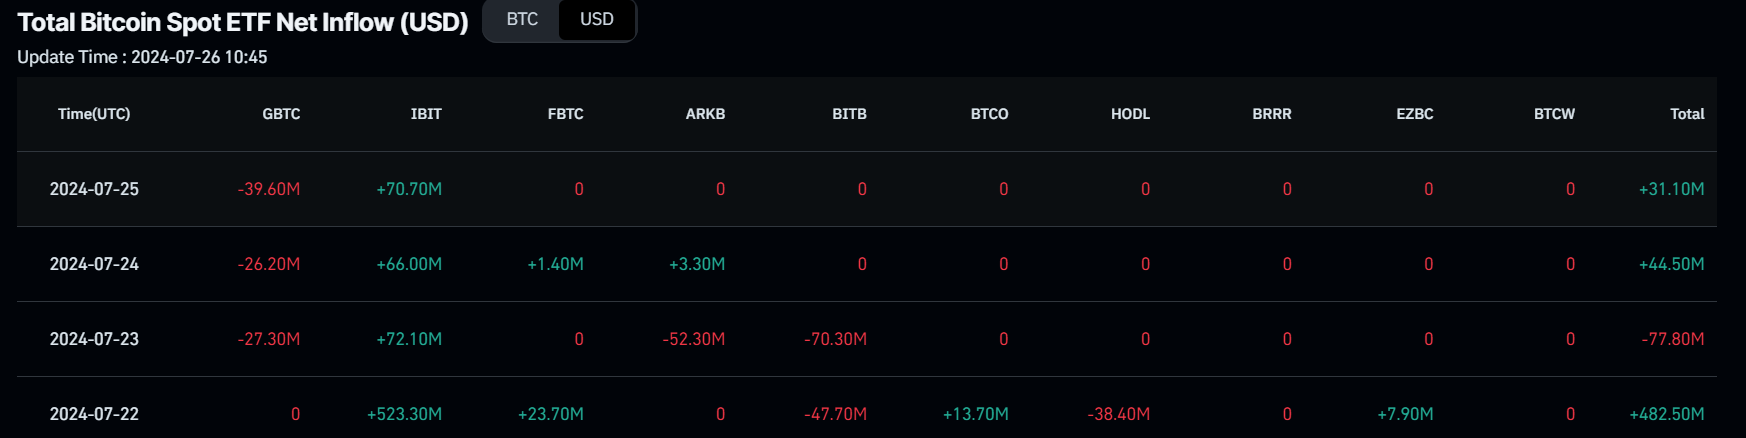
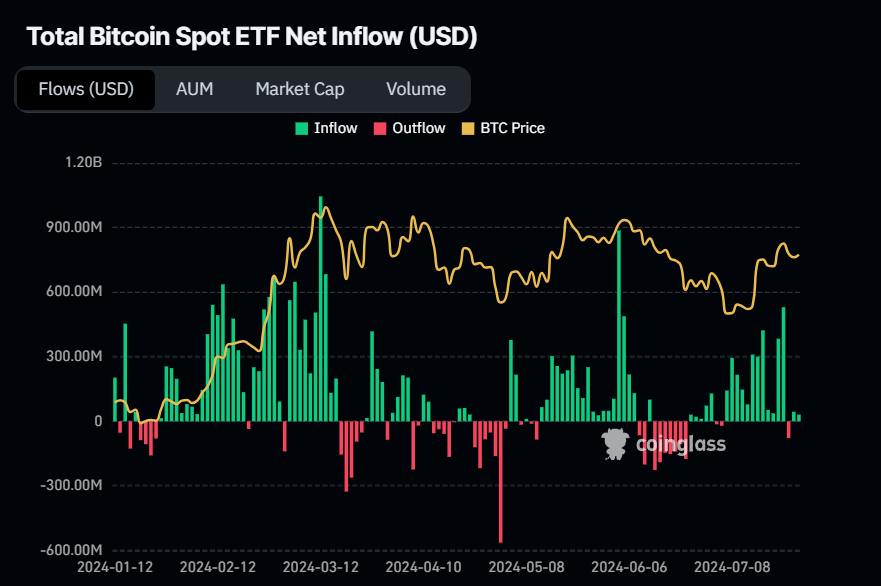
Bitcoin Spot ETF Net Inflow (USD) chart
Donal Trump to speak at the Bitcoin Conference on Saturday; Kamala Harris to skip event
David Bailey, CEO of Bitcoin Magazine, confirmed on Twitter that Kamala Harris will not speak at the upcoming Bitcoin Conference, scheduled this week from Thursday to Saturday.
Bailey said, "No surprise. What can she [Kamala Harris] say to us when she's actively imprisoning developers, forcing our industry overseas, attacking PoW… it would have been a disaster for her. All eyes on Trump now."
And also tweeted, "Choice is simple really, Trump Pump or Biden Dump?"
Donald Trump's endorsement of crypto and his upcoming speech at the Bitcoin Conference could further bolster his appeal among voters who are actively involved in cryptocurrency investments.
Additionally, the conference will feature notable speakers, including Cathie Wood, Founder and CEO of ARK Invest; Michael Saylor, Executive Chairman of MicroStrategy; and Robert F. Kennedy Jr., an independent candidate for President of the United States.
Kamala Harris will not be speaking @TheBitcoinConf. No surprise. What can she say to us when she’s actively imprisoning developers, forcing our industry overseas, attacking PoW… it would have been a disaster for her.
— David Bailey $0.65mm/btc is the floor (@DavidFBailey) July 24, 2024
All eyes on Trump now.
Mt.Gox creditors opted to sell their Bitcoin
According to CryptoQuant, Bitcoin Exchange Netflow on Kraken — now handling Mt. Gox creditor reimbursements — indicates the difference between BTC entering and exiting the exchange. A positive netflow suggests increased Bitcoin inflows for potential selling or trading, while a negative netflow signals more Bitcoin withdrawals, possibly for holding or transferring to personal wallets.
On Thursday, Bitcoin's netflow was positive at 47,569 BTC, suggesting that Mt. Gox creditors are selling their reimbursements, contributing to the decline in Bitcoin's price; if this trend continues, it could intensify selling pressure and potentially lead to further price drops.
 - Kraken (1)-638575748799346745.png)
Bitcoin Exchange Netflow on Kraken chart
Bitcoin's recovery: Is the cryptocurrency finally out of the woods?
Bitcoin price encountered resistance at the weekly level of $67,209 earlier this week and extended its correction for three consecutive days before finding support around the 50% Fibonacci retracement level of $62,736 (calculated from the June 7 high of $71,997 to the July 5 low of $53,475). As of Friday, BTC trades 1.7% higher at $66,929, attempting to break through the weekly resistance.
If BTC continues to recover and break above the weekly resistance at $67,209, it could rise by 7% to retest its June 7 high of $71,997.
On the daily chart, the Relative Strength Index (RSI) and the Awesome Oscillator (AO) indicators are trading above their neutral levels of 50 and zero, respectively. This robust momentum signals a strong bullish sentiment in the market.
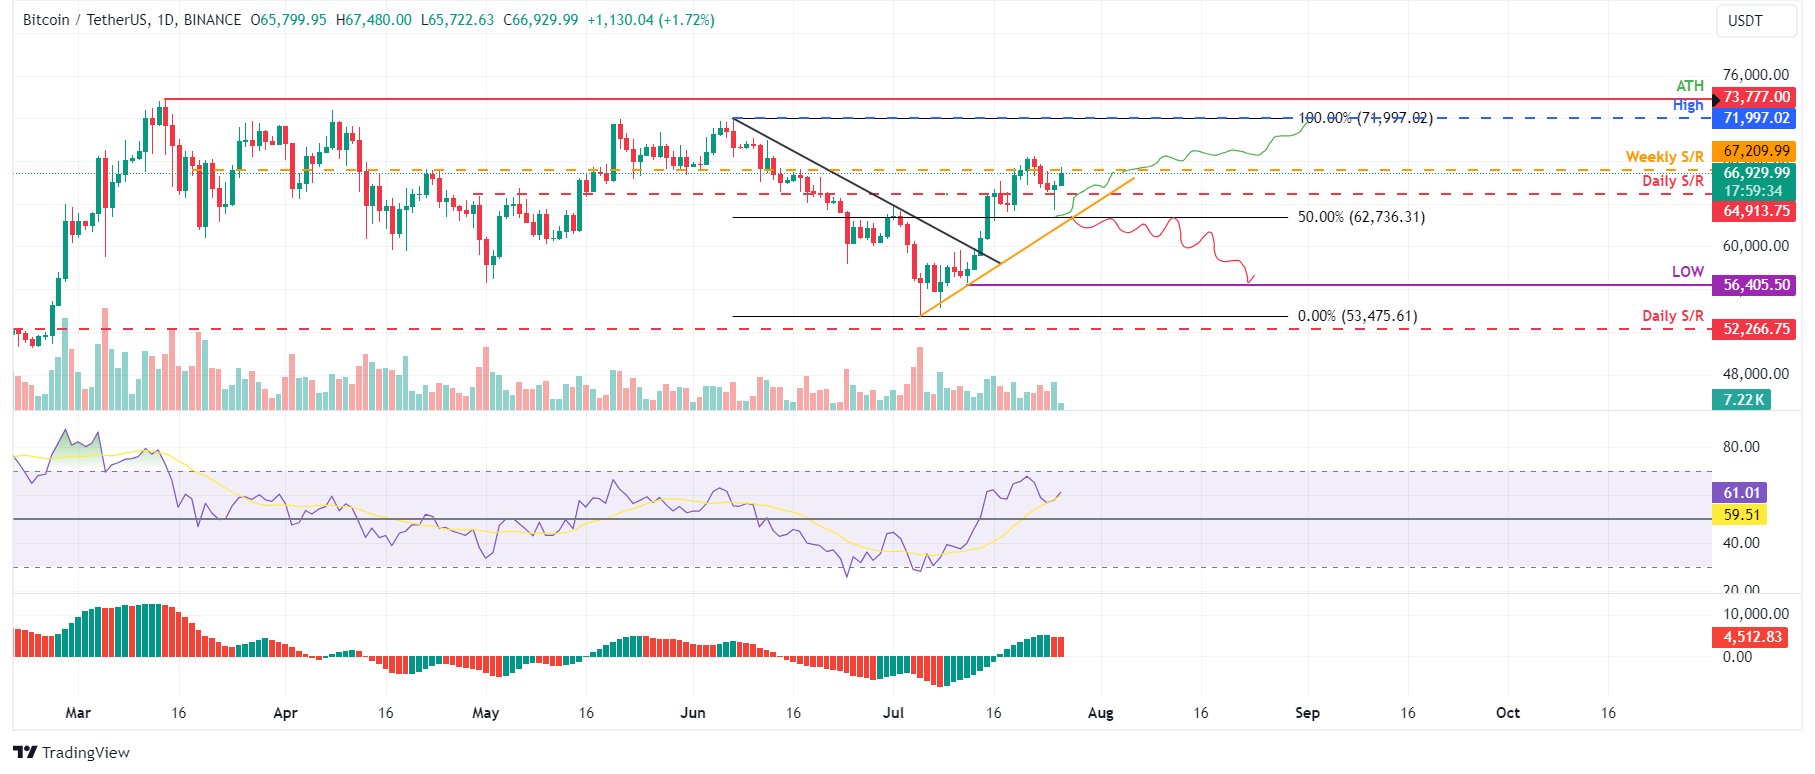
BTC/USDT daily chart
However, a close below $62,736 and a break below the ascending trendline would change the market structure from bullish to bearish by forming a lower low on the daily timeframe. Such a scenario might precipitate a 10% crash in Bitcoin's price to retest its July 12 low of $56,405.
Recommended Articles


