

Bitcoin Cash (BCH) Currently Undervalued, On-Chain Metric Flashes Buy Signal
The value of BCH, the native coin of the peer-to-peer electronic cash system, Bitcoin Cash, has declined steadily in the past few weeks. Exchanging hands at $370.21 as of this writing, the altcoin’s value has plummeted by 5% in the last seven days.
According to readings from a key on-chain metric, BCH may be undervalued at its current value. It, therefore, offers a buying opportunity for those looking to trade against the market.
Bitcoin Cash Presents a Buying Opportunity, but Futures Traders Remain Skeptical
According to BCH’s market value to realized value (MVRV) ratio, it currently sells at a price lower than its historical cost basis, making it undervalued.
The coin’s MVRV ratio is negative when assessed over various moving averages. Specifically, BCH’s MVRV ratios for the 30-day and 365-day moving averages are -3.07% and -11.15%, respectively.
An asset’s MVRV measures the ratio between its current price and the average price at which all its coins or tokens were acquired.
Read More: 7 Best Bitcoin Cash (BCH) Wallets in 2024
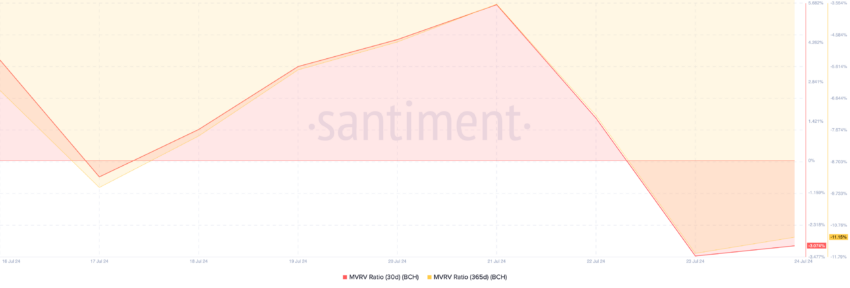 Bitcoin Cash Market Value to Realized Value Ratio. Source: Santiment
Analysts deem an asset overvalued when its value is above one. This is because its current market value is significantly higher than the price at which most investors acquire their holdings.
On the other hand, an MVRV ratio below zero suggests that the market value of the asset in question is below the average purchase price of all its tokens in circulation. When this occurs, the asset is said to be undervalued.
Negative MVRV ratios offer a buying opportunity because the asset is deemed to trade below its cost basis. Therefore, traders can buy at a lower price and hope to sell higher.
However, BCH’s futures traders continue to demand short positions, indicating their lack of confidence in the coin’s price recovering soon.
According to Coinglass’ data, BCH’s funding rate has been significantly negative since the beginning of July. As of this writing, it is -0.02%.
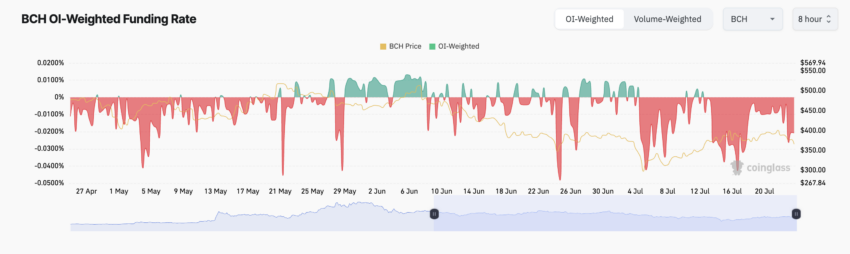 Bitcoin Cash Funding Rate. Source: Coinglass
When an asset’s funding rate is negative, it signals a spike in the demand for short positions. This reflects bearish sentiments, as it means that there are more traders expecting the asset’s price to fall than traders buying the asset with the expectation of selling at a higher price.
BCH Price Prediction: Pain Lies Ahead
BCH fell closed below its 20-day exponential moving average (EMA) on Tuesday, confirming the possibility of a continued decline.
An asset’s 20-day EMA measures its average price over the past 20 trading days. When an asset’s price falls below this key moving average, it suggests a decline in buying pressure and an uptick in coin sell-offs.
If this trend persists, more downward pressure will be put on BCH’s price, which may drop to a six-month low of $286.
Read More: Bitcoin Cash (BCH) Price Prediction 2024/2025/2030
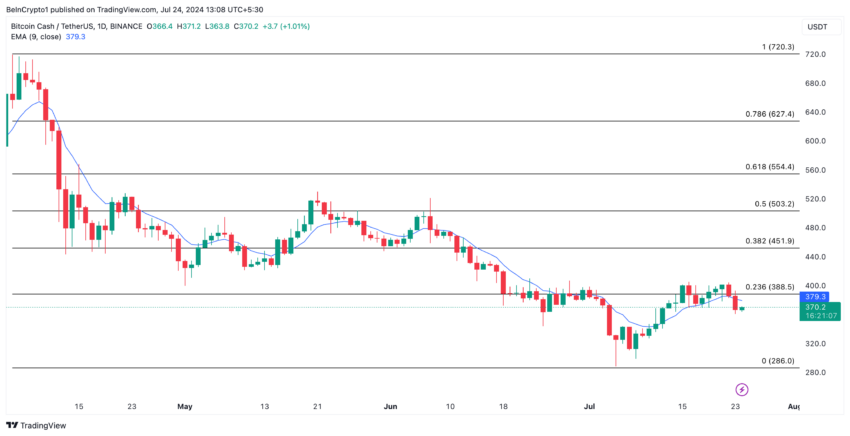 Bitcoin Cash Daily Analysis. Source: TradingView
However, if the current trend reverses and the demand for BCH spikes, its price may rally toward $388.
Recommended Articles


