

Top 5 crypto market trends from Coingecko's Q2 report
- The total crypto market cap was outperformed by the S&P 500, falling 14.4% in Q2.
- Meme coins accounted for 14.3% of the total crypto market share in Q2 2024.
- Spot trading volume on centralized exchanges hit $3.40 trillion in the same quarter.
Coingecko's Q2 report on Tuesday revealed key market performances in the crypto industry and how they may affect Q3 and Q4 performances.
Crypto market performance in Q2 2024
Cryptocurrency data aggregator Coingecko published important findings in Q2 2024 that influenced the crypto market. Some notable trends from the second quarter of the year include:
The total crypto market cap fell below the S&P 500, dropping 14.4% in Q2 2024, ending H1 with $2.43 trillion. The drop was characterized by increased volatility among crypto assets, including Bitcoin (BTC).
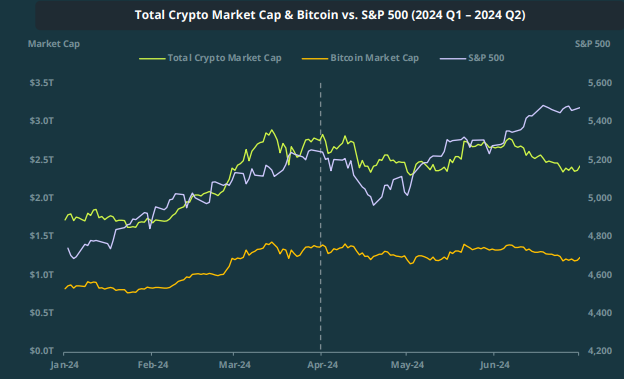
Bitcoin experienced an impressive rally in Q1 and eventually surpassed its previous all-time high, climbing to $73,098. In contrast to its first-quarter performance, Bitcoin dropped 11.9% at the end of Q2.
ETH also saw declines at the rear of H1 amid the approval of the US spot ETH ETFs. The top altcoin closed the second quarter at $3,371, a 5.71% quarter-on-quarter decrease. A drop in activities on the Ethereum Mainnet may have caused the decline. Most network activities were rerouted onto Layer 2s and the Solana network. Hence, ETH's trading volume dipped from $19.1 billion to $14.7 billion.
Meme coins dominated the entire crypto market mindshare in H1, holding 14.3% at the end of Q2. Many meme coins shot up more than 1000%, higher than major assets on the market. These meme tokens include MOG, OM, WIF, and ABT.
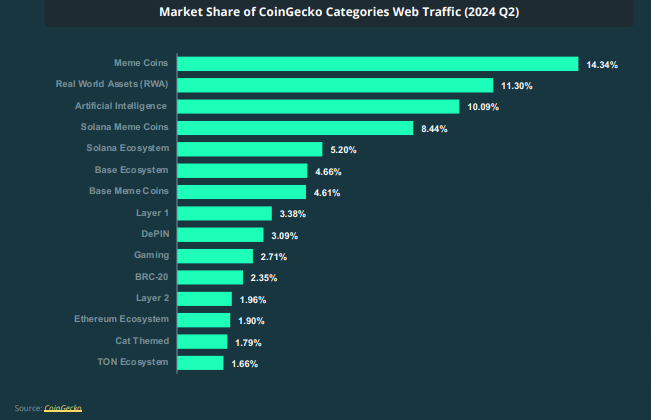
A possible cause for the increased market dominance may be the meme coins frenzy, which began in March — characterized by rallies in various Solana-based meme and celebrity tokens — and the return of GameStop trader Roaring Kitty. Real-world assets and AI tokens mindshare were not far behind, rising by 11.30% and 10.09%, respectively.
Centralized exchanges experienced rough declines in spot trading volumes at the end of Q2, recording only $3.40 trillion. Comparing this to the performance of Q1, it shows a quarter-on-quarter (QoQ) decline of 12.2%. CEXs hit $4.29 trillion in spot trading volume at the end of Q1, with Binance as the dominating exchange.
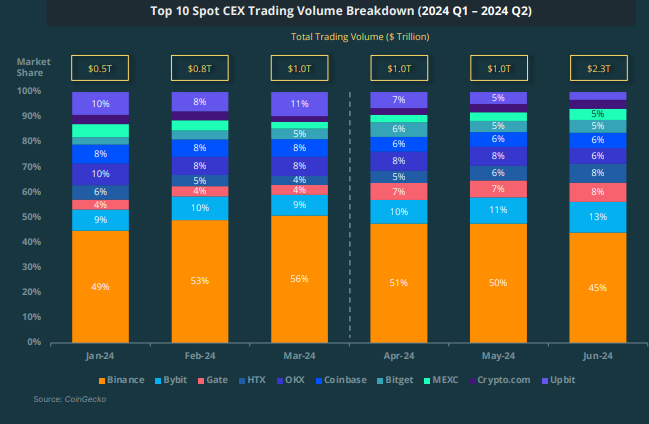
At the tail end of Q2, trading volumes among the top ten exchanges fell, with only four experiencing increased volumes. This indicates investors may have been more cautious following the crypto market downturn in Q2.
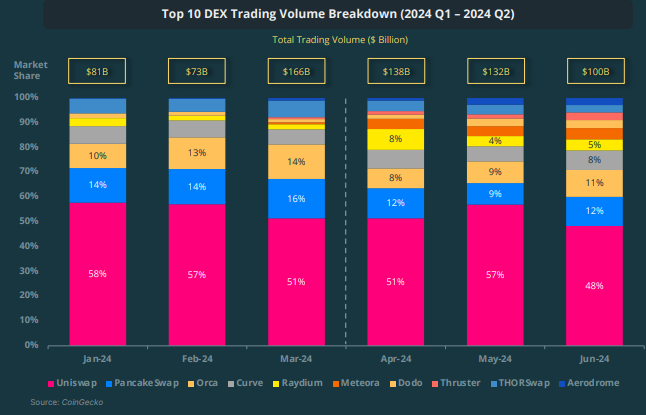
In contrast with centralized exchanges, the top ten decentralized exchanges saw increased spot trading volume in Q2, surging over 15%. The total DEX spot market recorded $370.07 billion in trading volume, with Thruster as the largest gainer. Meanwhile, Uniswap slumped in its market share at the end of Q2, dropping to 48% from its Q1 market share of 51%.
“Looking forward to the second half of 2024, the outlook is decidedly murkier compared to the first half of the year. The specter of Mt. Gox’s BTC distributions, coupled with several large token supply unlocks, loom large over the market. However there are also signs of optimism - impending trading of the US spot ETH ETFs, an improving macroeconomic environment, and teams continuing to build and ship, gives us hope that the industry still pushes forward,” noted CoinGecko.
Recommended Articles


