

Dogwifhat (WIF) Price Stays Range-Bound Despite Recent Rally
The Dogwifhat (WIF), a dog-themed meme coin based in Solana, has continued to trade within a narrow range despite its price uptick in the past week.
Exchanging hands at $2.13, the meme coin’s value has risen by 25% in the past seven days.
Dogwifhat Attempts to Break Above Resistance
Dogwifhat has trended within a horizontal channel since June 19.
A horizontal channel is formed when the price of an asset consolidates within a range for an extended period. The upper line of this channel forms resistance, while the lower line forms support.
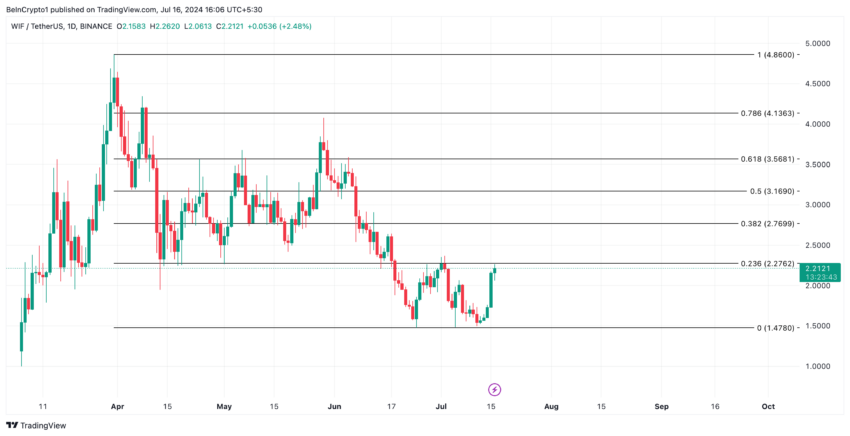
In WIF’s case, resistance has been formed at the $2.36 price level and support at $1.51. The price uptrend in the last week has pushed the meme coin toward the upper line.
Read More: How To Buy Dogwifhat (WIF) and Everything Else To Know
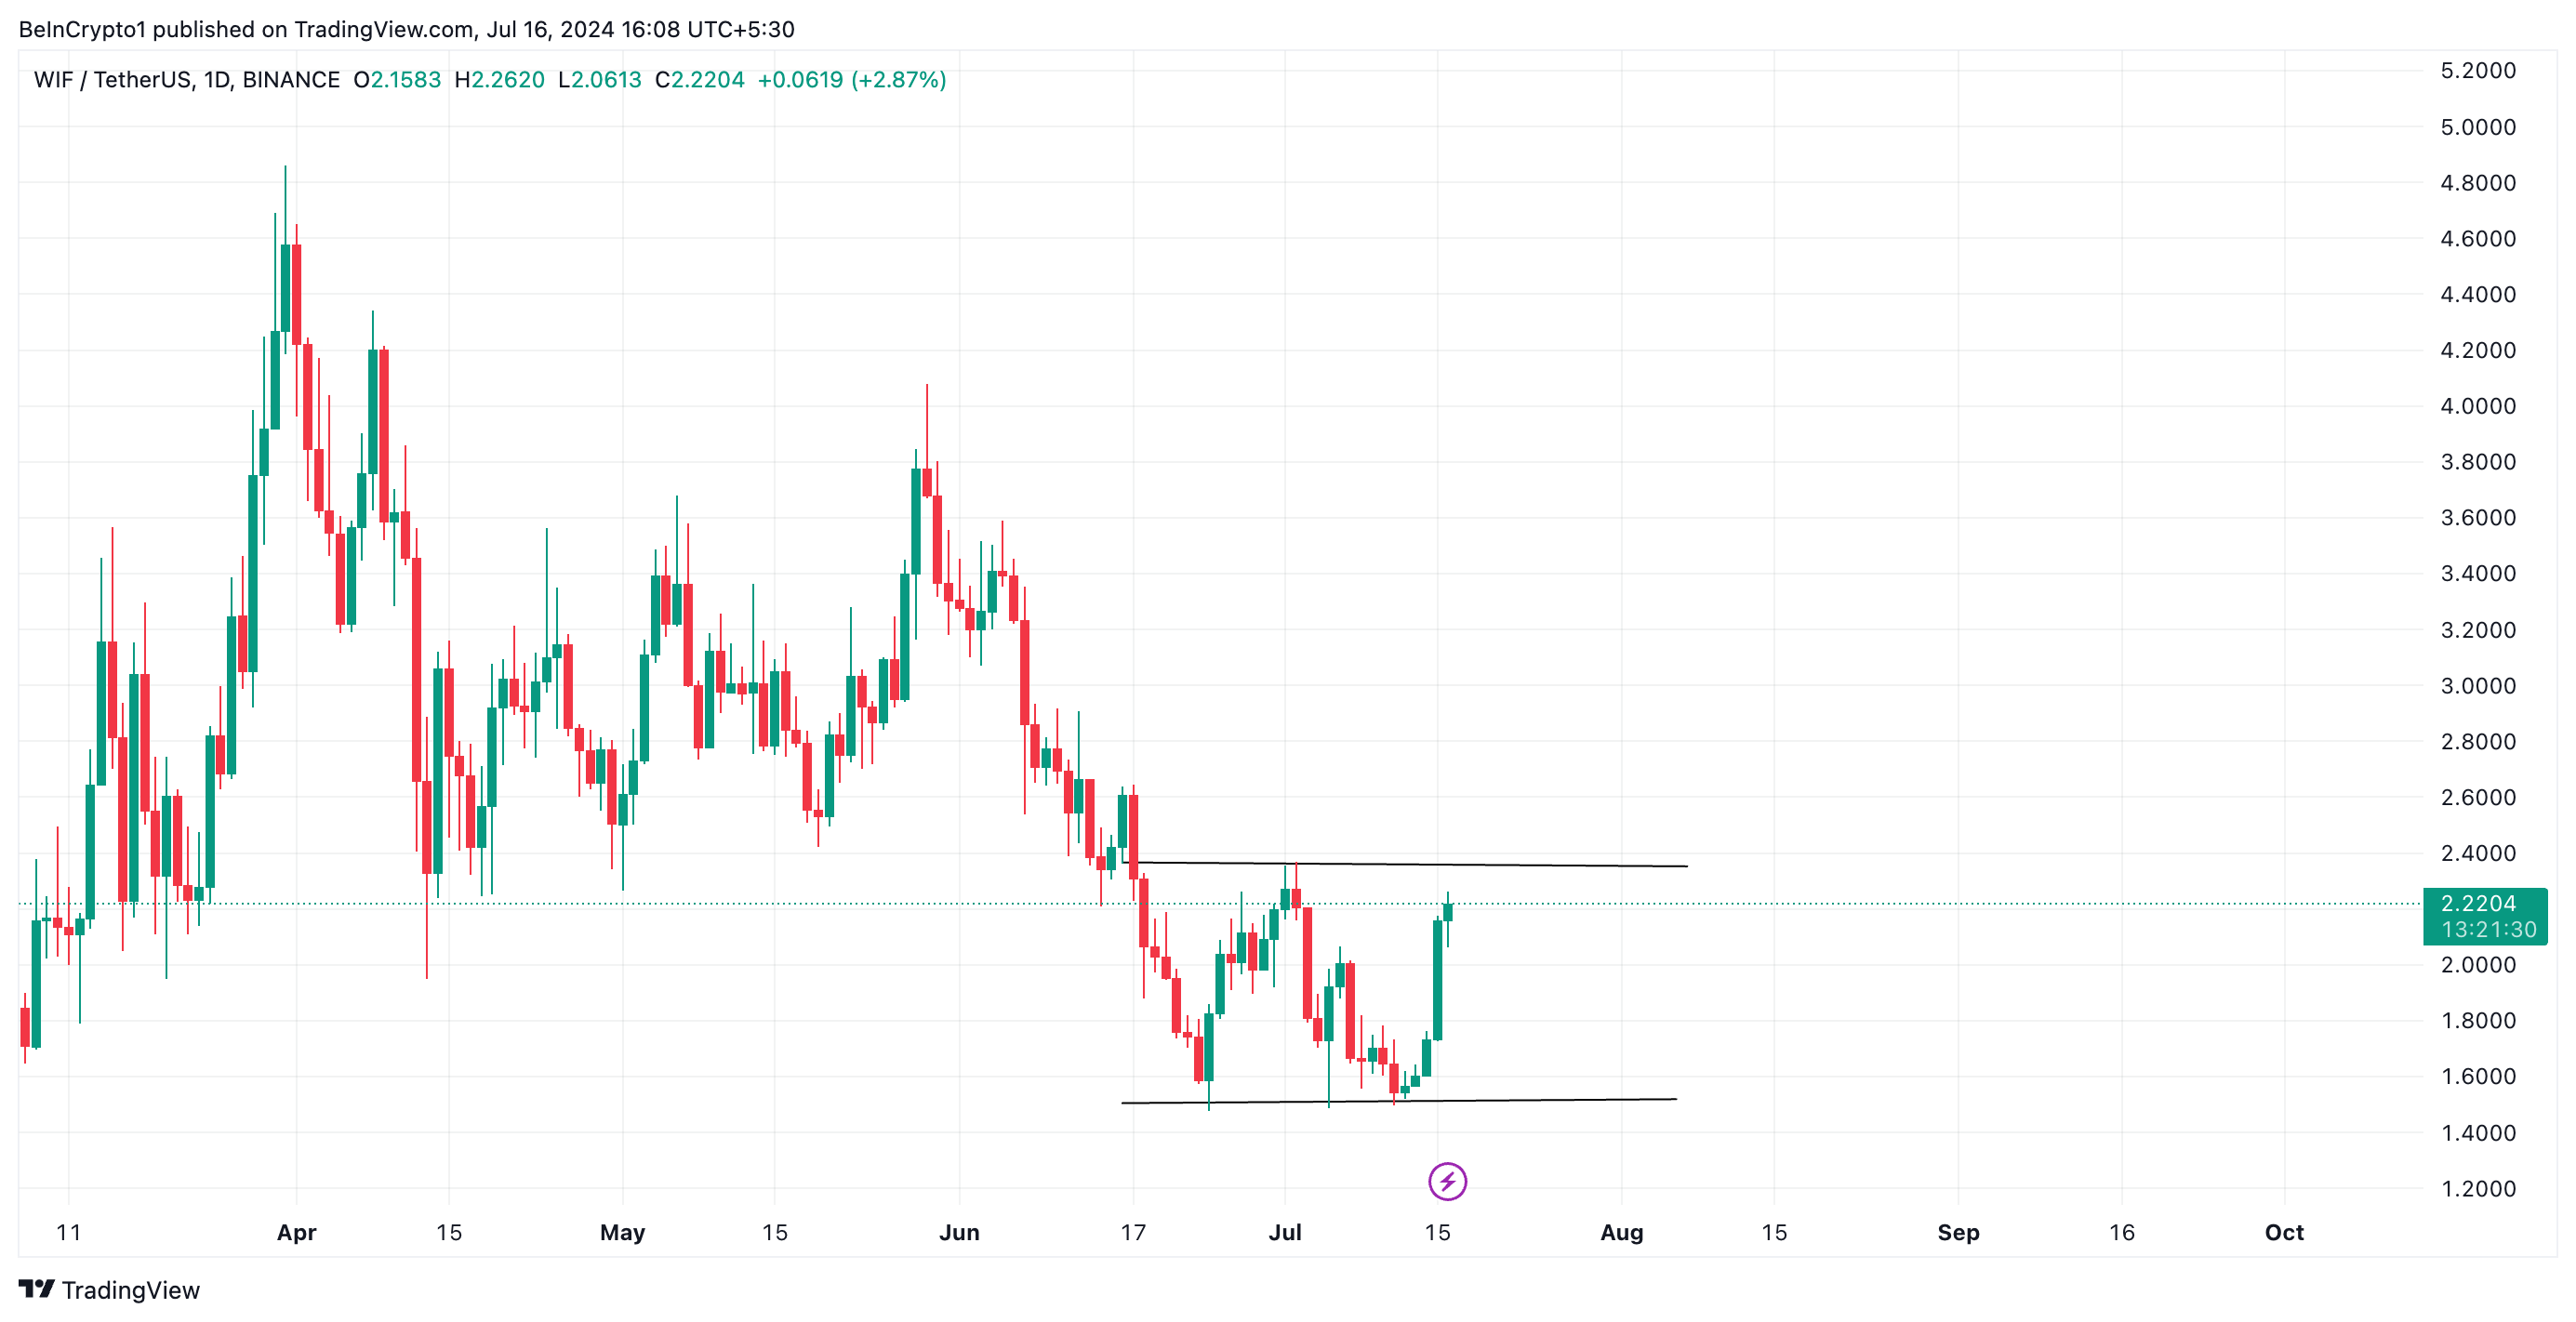 Dogwifat Price Analysis. Source: TradingView
However, the possibility of breaching this level is low. According to readings from its Relative Strength Index (RSI), the actual demand backing WIF’s current rally is almost insignificant.
At press time, WIF’s RSI is in a downtrend at 37.80. This indicator measures an asset’s oversold and overbought market conditions. At its current value, WIF’s RSI shows that selling pressure outweighs accumulation. This puts it at risk of shedding its recent gains once buyers’ exhaustion sets.
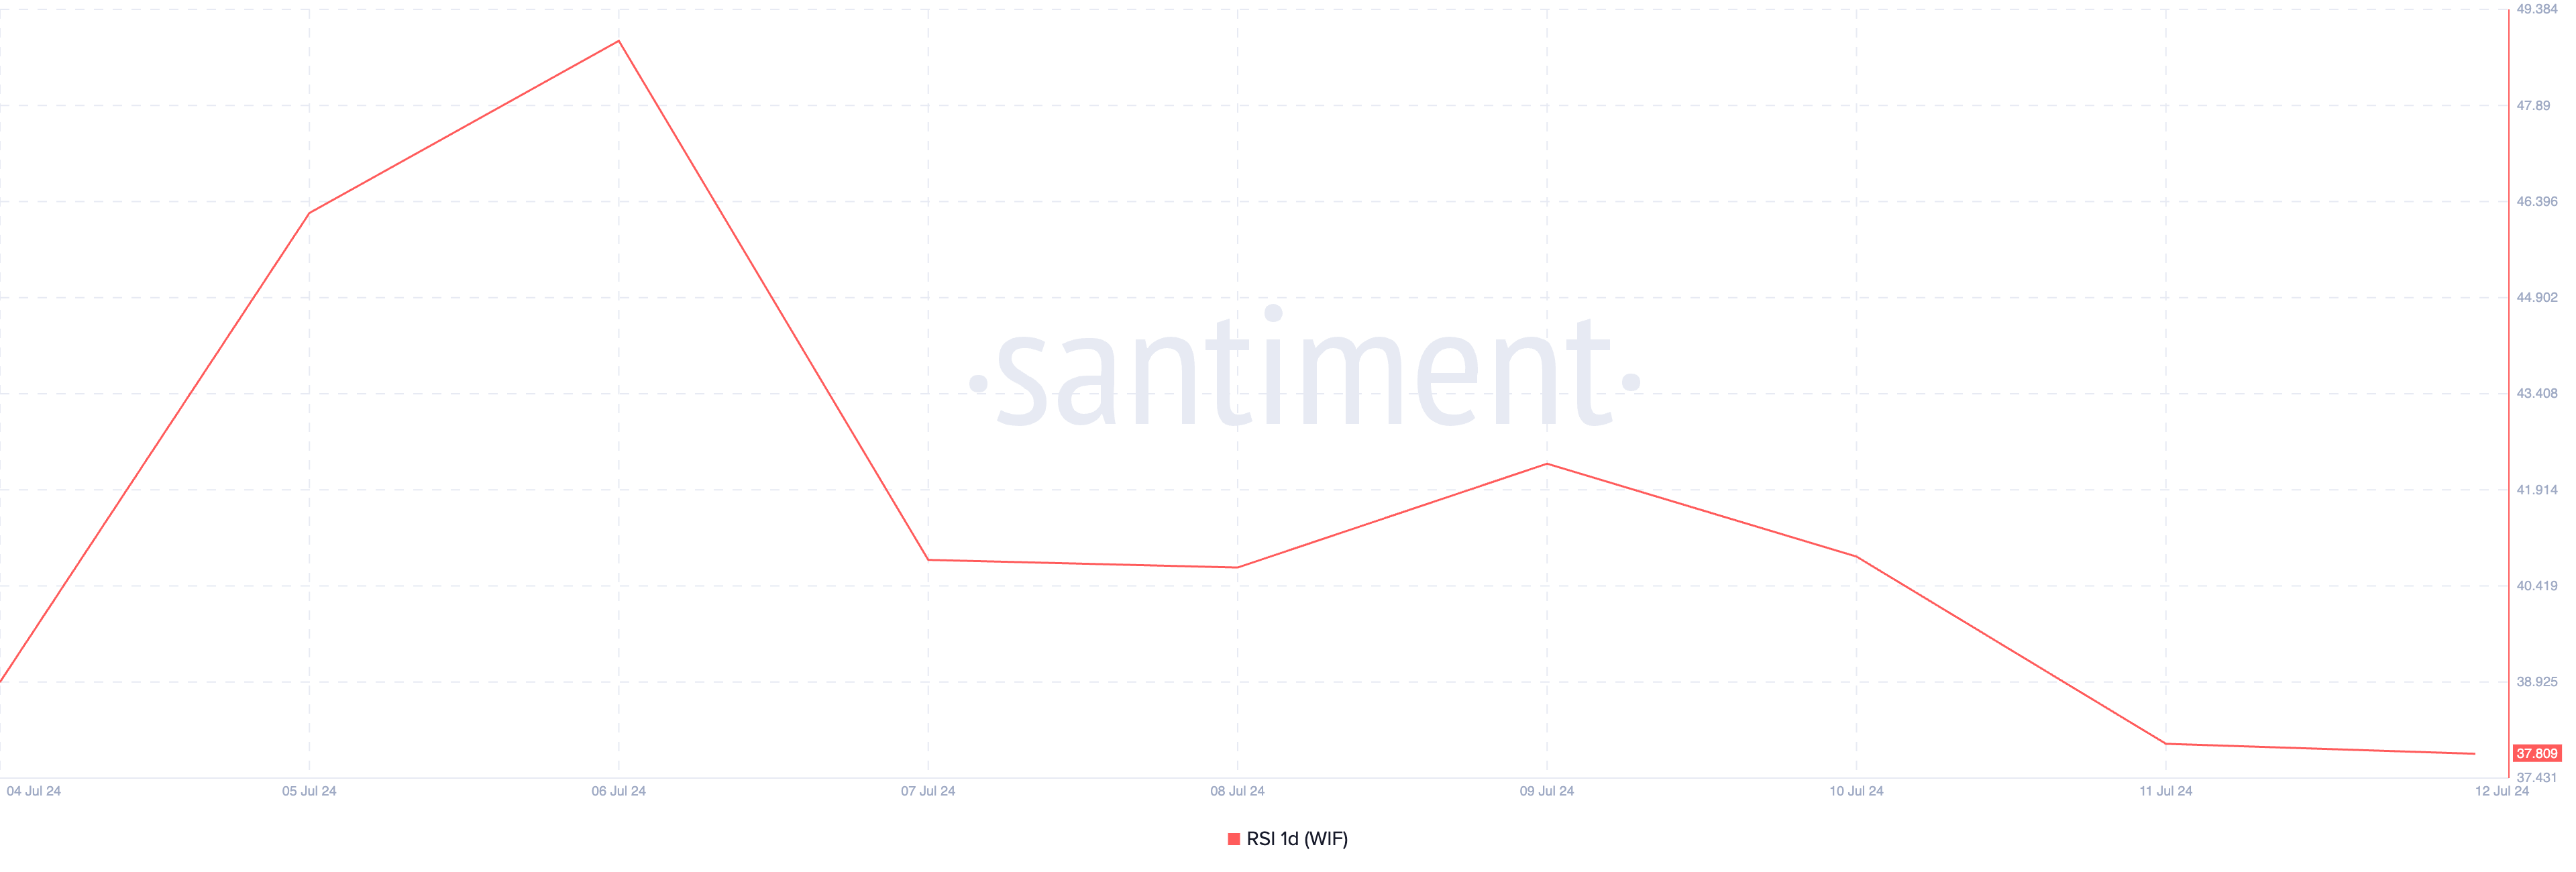 Dogwifhat Relative Strength Index. Source: Santiment
Furthermore, the meme coin remained plagued by bearish sentiments. As of this writing, its weighted sentiment is negative at -0.74.
This metric tracks the overall mood of the market regarding an asset. It considers the sentiment trailing the asset and the volume of social media discussions.
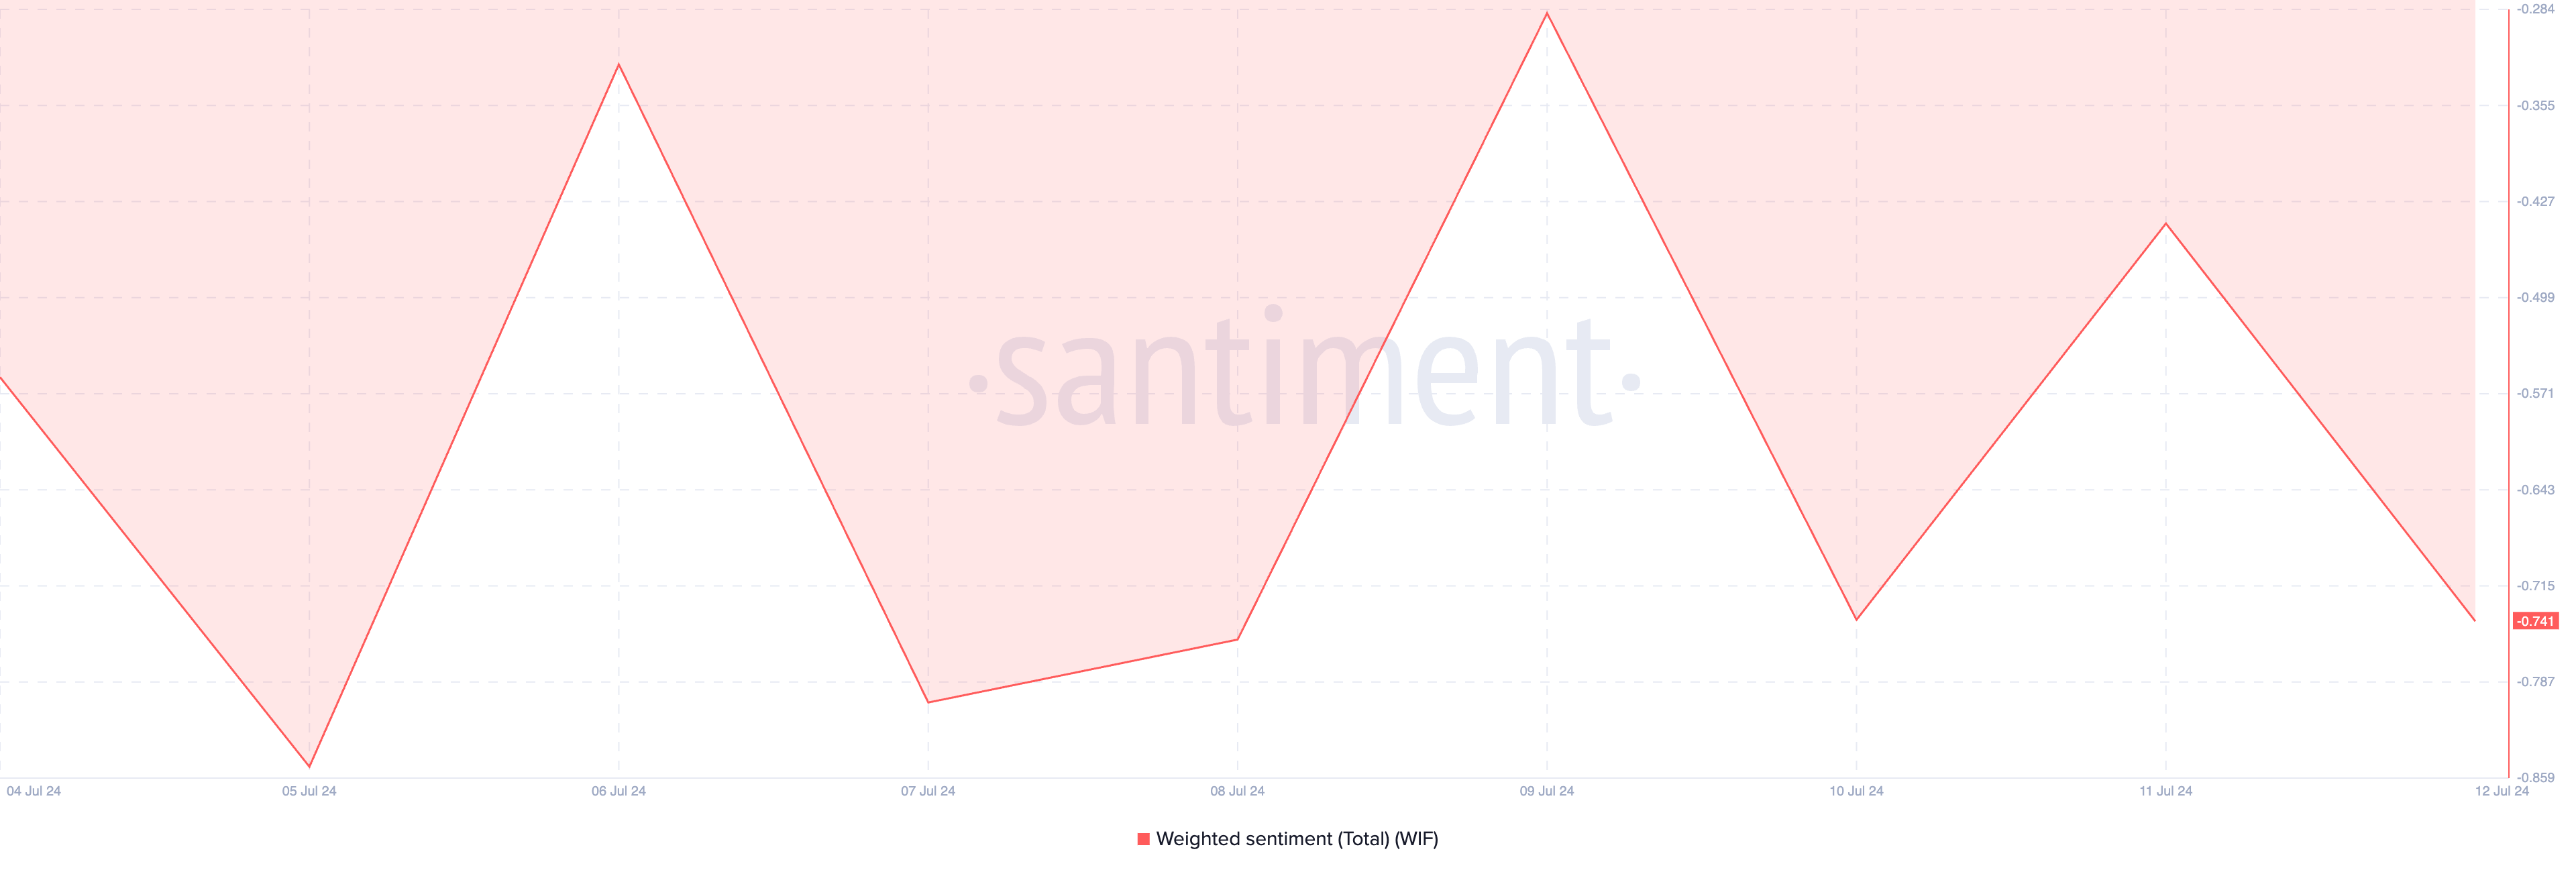 Dogwifhat Weighted Sentiment. Source: Santiment
When the value of an asset’s weighted sentiment is below zero, most social media discussions are fueled by negative emotions like fear, uncertainty, and doubt.
WIF Price Prediction: Market Volatility is Spiking
WIF’s double-digit price hike in the past seven days has heightened market volatility. This can be gleaned from the widening gap between its upper and lower Bollinger Bands indicator bands.
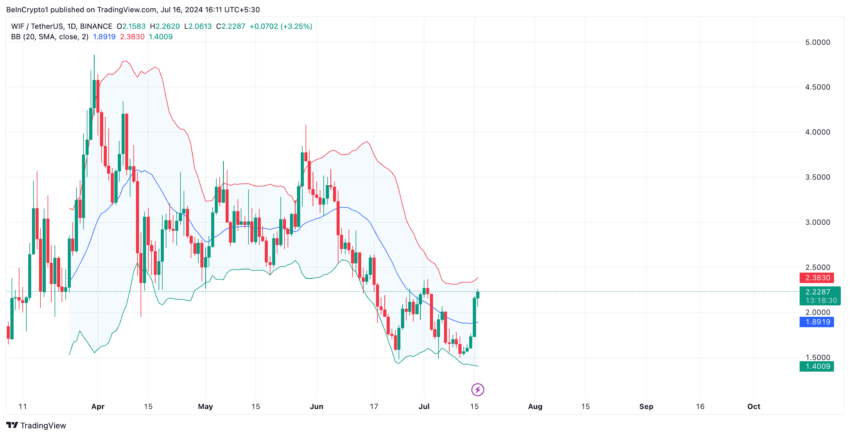 Dogwifhat Price Analysis. Source: TradingView
This indicator assesses an asset’s price volatility and identifies overbought or oversold conditions in its price. When the gap between these bands widens in this manner, the asset’s price becomes more volatile and may experience swings in either direction.
If WIF maintains its uptrend, it will trade at $2.27. This is at the 23.6% Fibonacci retracement level. This level is considered the weakest retracement level, and WIF might pull back slightly after a move up.
Read More: Dogwifhat (WIF) Price Prediction 2024/2025/2030
 Dogwifhat Price Analysis. Source: TradingView
If this happens, the price of WIF could fall to a multi-month low of $1.47.
Recommended Articles


