

Bullish Bitcoin Indicator Which Led To A Reversal Has Returned, Is $70,000 Possible?

Source Newsbtc

Jamie Coutts, the chief crypto analyst at Real Vision, has highlighted an indicator that paints a bullish picture for Bitcoin (BTC). Based on this indicator, the crypto analyst suggested that a reversal might already be on the horizon for the flagship crypto. 

Bitcoin Hashrate Decline Is Slowing

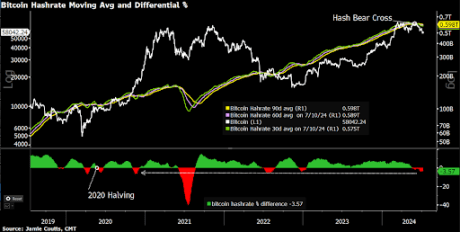
Coutts mentioned in an X (formerly Twitter) post that Bitcoin’s hash rate decline is slowing, which he noted usually precedes a bottom ad reversal of the bearish cross, which happened after the halving event. He, however, warned that a bullish reversal still depends on a “stabilization in the downtrend.”
Bitcoin 1

The crypto analyst further noted that the percentage difference between the 30- and 90-day moving averages aligns with previous hash rate contractions and isn’t as severe as the post-2020 halving. A slowdown in Bitcoin’s hash rate decline is significant because it suggests that miners’ capitulation may be ending soon. 

Crypto expert Willy Woo previously mentioned that the market will recover when “weak miners die, and hash rate recovers.” He further explained that inefficient miners will have to go into bankruptcy while other miners are forced to purchase more efficient hardware.

Cryptoquant’s CEO Ki Young Ju has provided insights into when this miners’ capitulation might end. He stated that it usually ends when the daily average mined value is 40% of the yearly average. The crypto founder further revealed that it is currently at 72%, suggesting that it could still take a while before miners eventually cool off on offloading their reserves. 

Ki Young Ju told market participants to expect the crypto markets to be dull for the next two to three months. He urged them to stay long-term bullish but avoid excessive risk. Crypto analysts like Mikybull Crypto have also assured that Bitcoin’s long-term outlook is bullish as the flagship crypto is still far from its bull market peak. 

Market Still Recovering From Supply Overhang

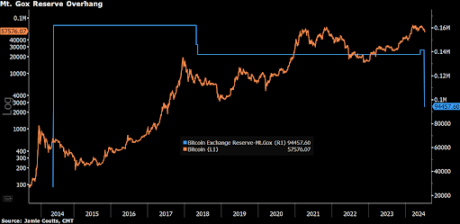
Coutts also mentioned that the market is still recovering from the supply overhang. This is in relation to the selling pressure that Bitcoin experienced thanks to the German government, which offloaded nearly 50,000 BTC on the market. As such, it could take a while for the market to suck up this Bitcoin supply. 
Bitcoin 2

While this selling pressure has negatively impacted the market, Coutts stated that the distributions of the German government sales and Mt. Gox reserves can help remove the “annoying supply overhang.” The analyst noted that this would happen through distributing these coins to a wider array of holders, which would, in turn, grow the Bitcoin network and leave the flagship crypto even better off than before. 

At the time of writing, Bitcoin is trading at around $58,300, up over 2% in the last 24 hours, according to data from CoinMarketCap. 

Bitcoin price chart from Tradingview.com
Disclaimer: For information purposes only. Past performance is not indicative of future results.
placeholder
WTI (USOIL) Is down 2.03% on Sep 25: Here Is WhyWTI (USOIL) is down 2.03% at Sep 24 22:20(UTC+0), now at $92.517, with a 7-day down of 3.63%.What is driving WTI (USOIL)’s stock price down today?The drop in WTI crude oil prices was primarily driven by
Author  TradingKey
Yesterday 04: 57
WTI (USOIL) is down 2.03% at Sep 24 22:20(UTC+0), now at $92.517, with a 7-day down of 3.63%.What is driving WTI (USOIL)’s stock price down today?The drop in WTI crude oil prices was primarily driven by
placeholder
Silver Price Forecast: XAG/USD remains steady near $64.00 as oil prices easeSilver price (XAG/USD) inches higher after two days of losses, trading around $63.90 per troy ounce during Asian hours on Friday. Non-yielding Silver is finding underlying support as inflation concerns ease following a pullback in crude oil prices.
Author  FXStreet
Yesterday 03: 30
Silver price (XAG/USD) inches higher after two days of losses, trading around $63.90 per troy ounce during Asian hours on Friday. Non-yielding Silver is finding underlying support as inflation concerns ease following a pullback in crude oil prices.
placeholder
Gold Price Forecast: Gold Drops Below $4,300, Will It Continue to Fall? As of the European session on September 24, gold prices (XAUUSD) extended their correction, dipping below $4,300 intraday to hit a low of $4,262.45. After previously rebounding close to $
Author  TradingKey
Sep 24, Thu
As of the European session on September 24, gold prices (XAUUSD) extended their correction, dipping below $4,300 intraday to hit a low of $4,262.45. After previously rebounding close to $
placeholder
Yen touches 158.37 as Tokyo reopens, then slips back — ¥15.4 trillion of intervention and the 200-day line stand between here and 160USD/JPY reached 158.37 overnight, its highest since early September, then eased to 157.88 as Japanese markets reopened after a three-day holiday. The Ministry of Finance has spent ¥15.4 trillion defending the yen since late July and the BOJ ran a rate check on September 18. The 200-day average sits at 158.43.
Author  Irene Q.
Sep 24, Thu
USD/JPY reached 158.37 overnight, its highest since early September, then eased to 157.88 as Japanese markets reopened after a three-day holiday. The Ministry of Finance has spent ¥15.4 trillion defending the yen since late July and the BOJ ran a rate check on September 18. The 200-day average sits at 158.43.
placeholder
US input costs rose at the fastest pace in four years — the September flash PMI beat is an inflation story, not a growth storyUS September flash PMIs came in far above expectations, with the composite at 58.4, a five-year high. But the detail that moved markets was input cost inflation at its fastest since October 2022, driven by fuel, transport and supply shortages. Brent is back above $100 and the 10-year Treasury yield has hit its highest since 2007.
Author  Suzie
Sep 24, Thu
US September flash PMIs came in far above expectations, with the composite at 58.4, a five-year high. But the detail that moved markets was input cost inflation at its fastest since October 2022, driven by fuel, transport and supply shortages. Brent is back above $100 and the 10-year Treasury yield has hit its highest since 2007.
goTop
quote