
Arbitrum whales buy the dips
- Arbitrum price moves inside a descending channel pattern, breakout could signal a bullish move.
- On-chain data shows that a whale has accumulated 2.38 million ARB tokens worth $1.69 million on Wednesday.
- Santiment data shows the development activity is rising, signaling a bullish move.
- A daily candlestick close below $0.564 would invalidate the bullish thesis.
Arbitrum (ARB) trades inside a descending channel pattern, with a potential breakout poised to trigger a bullish trend. Recent on-chain data indicates accumulation by a whale on Wednesday; coupled with an uptick in development activity, this suggests favorable conditions for upcoming bullish movements.
Whales buy the dips
According to Arkham Intelligence, a wallet (which may belong to Bitcoin Suisse, a Swiss crypto pioneer and trusted gateway company) bought 2.38 million ARB tokens worth $1.69 million from Binance.
Additionally, this wallet bought 3.47 million ARB the day before, worth $2.44 million.
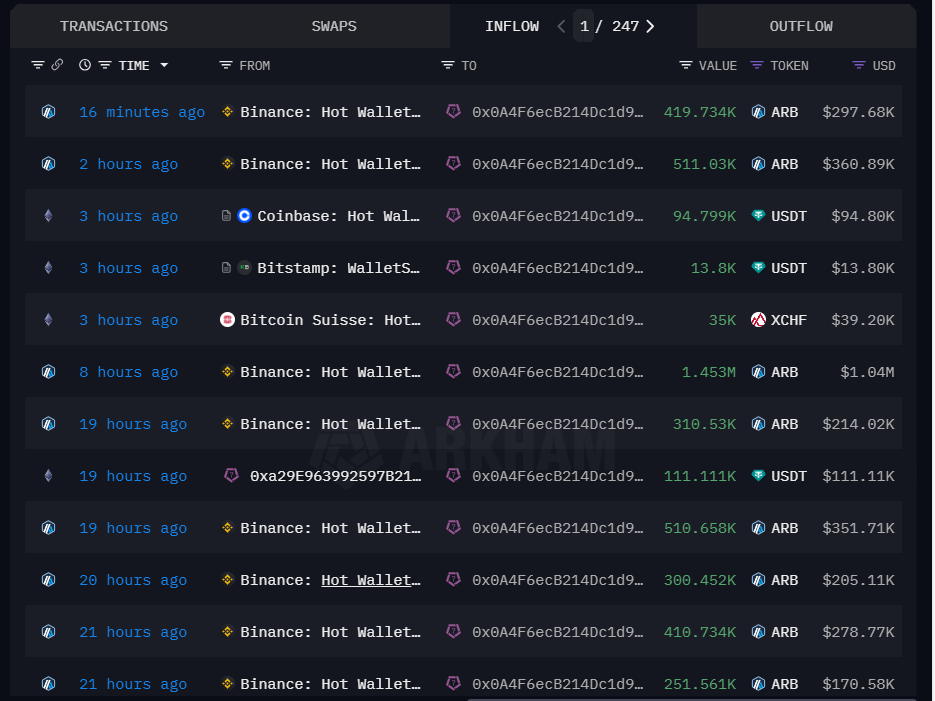
Wallet Transactions
4 hours ago, a wallet (may belong to @BitcoinSuisseAG) just withdrew 1.453M $ARB (~$1.04M) from #Binance.
— The Data Nerd (@OnchainDataNerd) July 10, 2024
Within 24 hours, they withdrew 3.47M $ARB (~$2.44M)
Address:https://t.co/G0pBk2RDKv pic.twitter.com/hK2MztT6TL
Arbitrum price shows potential
Arbitrum price is retesting its upper band on the descending channel pattern. This pattern is formed by joining multiple swing high and low levels with a trendline.
If ARB breaks above the descending channel pattern, it could rally 20% to retest its daily resistance level of $0.855. This level roughly coincides with the 50-day Exponential Moving Average at $0.882, making it a key resistance zone.
The Relative Strength Index (RSI) and the Awesome Oscillator (AO) on the daily chart are below their respective neutral levels of 50 and zero. For bulls to sustain momentum, both indicators must rise above these critical levels, potentially supporting the ongoing recovery rally.
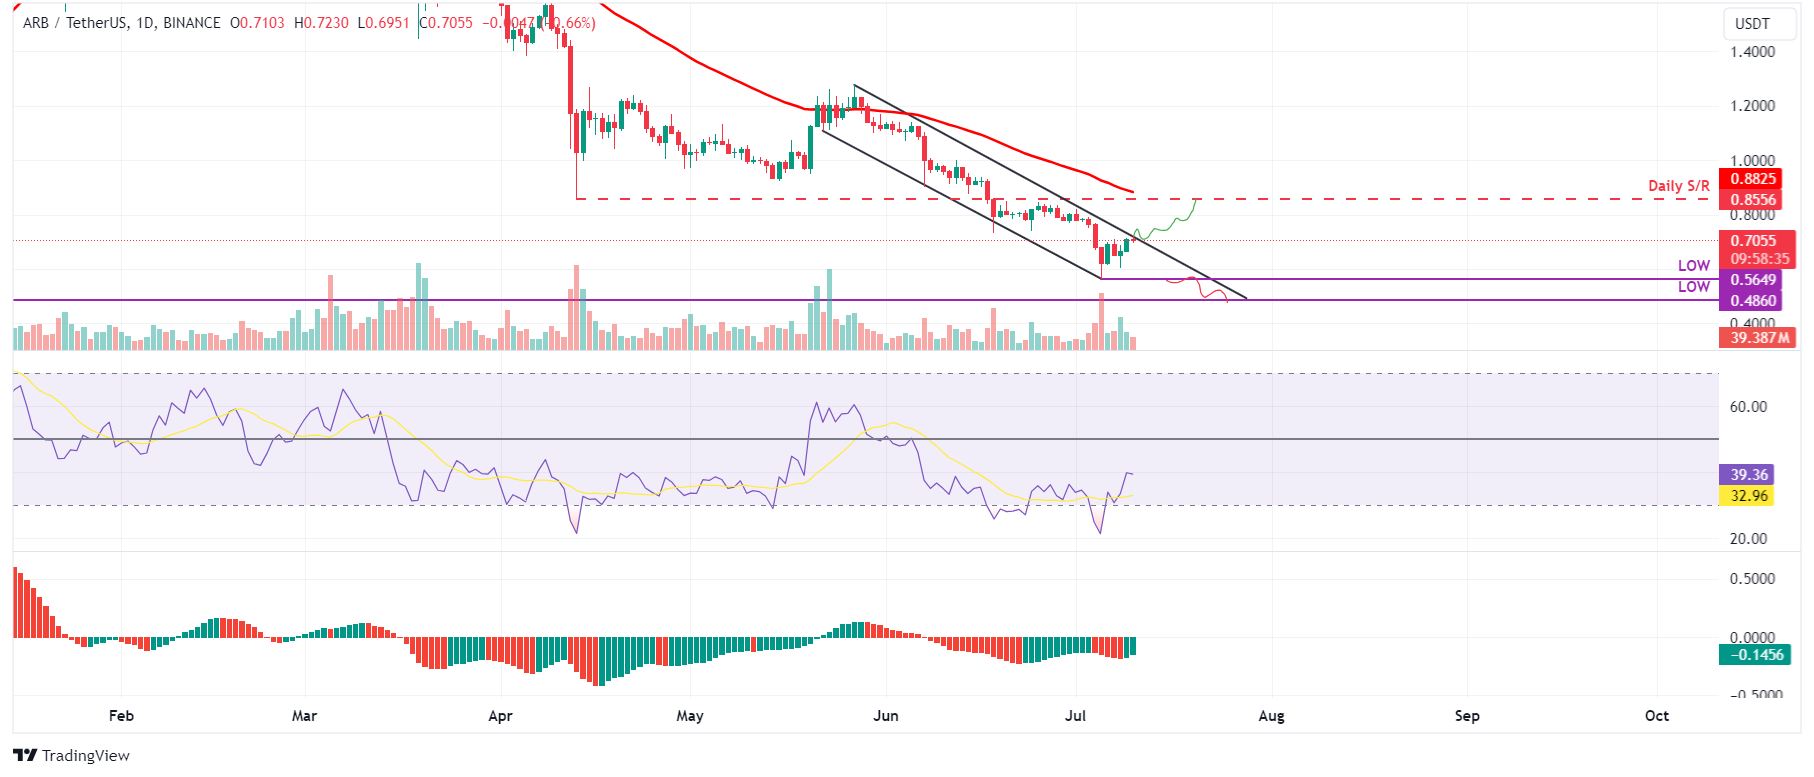
ARB/USDT daily chart
Santiment’s Development Activity metric tracks the frequency of project development events recorded in the public GitHub repository over time.
A rise in this metric suggests continuous endeavors to uphold, innovate, and improve the protocol, which is generally seen as favorable by investors and stakeholders. Conversely, a decline in the metric might raise apprehensions about the project's endurance, capacity for innovation, and engagement with the community in the foreseeable future.
As in ARB’s case, the index is rising from 119 on July 7 to 129 on July 10. The 8.5% rise in ARB's Developing Activity could be a bullish development for the ARB protocol.
 [18.54.30, 10 Jul, 2024]-638562205725899455.png)
ARB Development Activity chart
Despite strong technical analysis and on-chain data, if ARB’s daily candlestick closes below $0.564 and establishes a lower low on the daily timeframe, it may signal a shift in market dynamics that favors bearish sentiment. Such a change could invalidate the bullish outlook, leading to a 14% crash in the Arbitrum price to the previous low of $0.486 on March 23, 2023.
Recommended Articles


