

Is this the end of the Solana meme coin experiment?
- WIF has plunged 13% in the past 24 hours, extending monthly losses to 40%.
- Solana meme coins have been the most affected sector by the market downturn with losses ranging from 30% to 40%.
- Political meme coins may see a brief rally as presidential debate of June 27 draws closer.
Solana meme coins are losing steam following another day of losses on Friday. The dogwifhat (WIF) coin, the number one Solana meme coin, saw a significant price decrease after a large whale deposit on Binance.
WIF and Solana meme coins take a bow
A notable dogwifhat whale moved about $12.1 million worth of WIF to Binance within the past few hours, according to data from Solscan. Some crypto community members speculated that the large WIF transfer may have been from meme coin trader Ansem.
Also read: Could DOGE see a rally amid quietness in the meme coin sector?
WIF has been suffering from a heavy downtrend in the past few weeks. It's down more than 13% in the past 24 hours, extending its monthly losses to 43%. The downward move has also erased gains recorded during the March meme coin frenzy.
WIF surged more than 100% in March, leading meme coins on a rally. However, it has been heavily hit by the recent drop in excitement meme coins are experiencing.
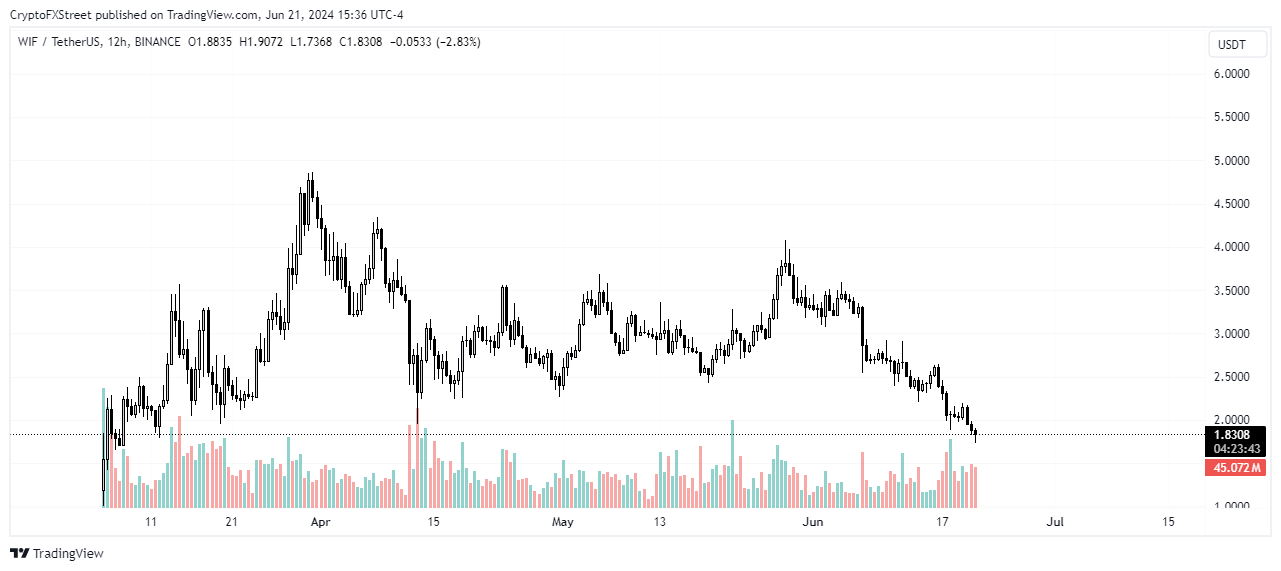
WIF/USDT 12-hour chart
In addition to WIF, Solana meme coins, which triggered the meme rally in March, seem to be the most affected sector in the meme category as most are trading at high monthly losses. BONK, BOME, POPCAT, PONKE and MYRO, among several others, have sustained around 30 to 40% losses.
Some crypto community members suggest that the meme experiment has been exhausted.
Read more: Meme coin dominance in altcoin market shrinks, DOGE, SHIB, PEPE, WIF, FLOKI on the verge of correction?
Notably, crypto trader @CryptoWazz blasted Ansem in an X post, saying most of his meme coin calls have seen heavy losses.
Down 92%
— Wazz (@WazzCrypto) June 21, 2024
Down 95%
Down 80%
Down 98.5%
Down 62%
Down 99.9% (exploited)
Down 96%
Down 51% (ironically the best pick is on Ethereum) pic.twitter.com/p4V4b2fOHE
The recent plunge isn't peculiar to just Solana meme coins. Several other meme coins have been plunging, with top dogs like SHIB and DOGE also erasing gains from their month-long March rally.
Also read: As meme coins go extinct, this Ethereum sector is likely to grow massively
Meanwhile, political meme coins have also seen a downturn, but many expect a short-term rally as the US Presidential debate on June 27 approaches.
Recommended Articles


