

Near Protocol finds support around key level amid market volatility
- Near Protocol demonstrates a 2% increase on Friday, supported by an ascending trendline
- Sideline buyers can accumulate NEAR as it holds horizontal support area extending from $4.23 to $4.48.
- A daily candlestick close below $4.05 would invalidate the bullish thesis.
Near Protocol’s (NEAR) price rises 2% on Friday, extending its rebound from an ascending trendline support on Tuesday. Sideline buyers are eyeing opportunities to accumulate NEAR at current levels before potential further upside.
Near Protocol price looks promising
Near Protocol price extends the recent rebound after a retest of the ascending trendline support, drawn from the swing low points from mid-October 2023 to mid-June 2024, on Tuesday. This trendline roughly coincides with the horizontal support area extending between $4.23 and $4.48. NEAR has bounced around 12% the following three days and trades at around $5.33 on Friday.
If this support holds, NEAR could rally roughly 7.5% from the current level of $5.33 to $5.74, the previous weekly resistance.
The daily chart below shows that the Relative Strength Index (RSI) bounces off the oversold area, and the Awesome Oscillator (AO) is still below its mean zero level. If bulls are indeed making a comeback, then both momentum indicators must regain their positions above their respective mean levels of 50 and zero.
If the bulls are aggressive, the overall crypto outlook is positive, and NEAR closes above $5.74, it could extend an additional 10% rally to its daily resistance level at $6.36.
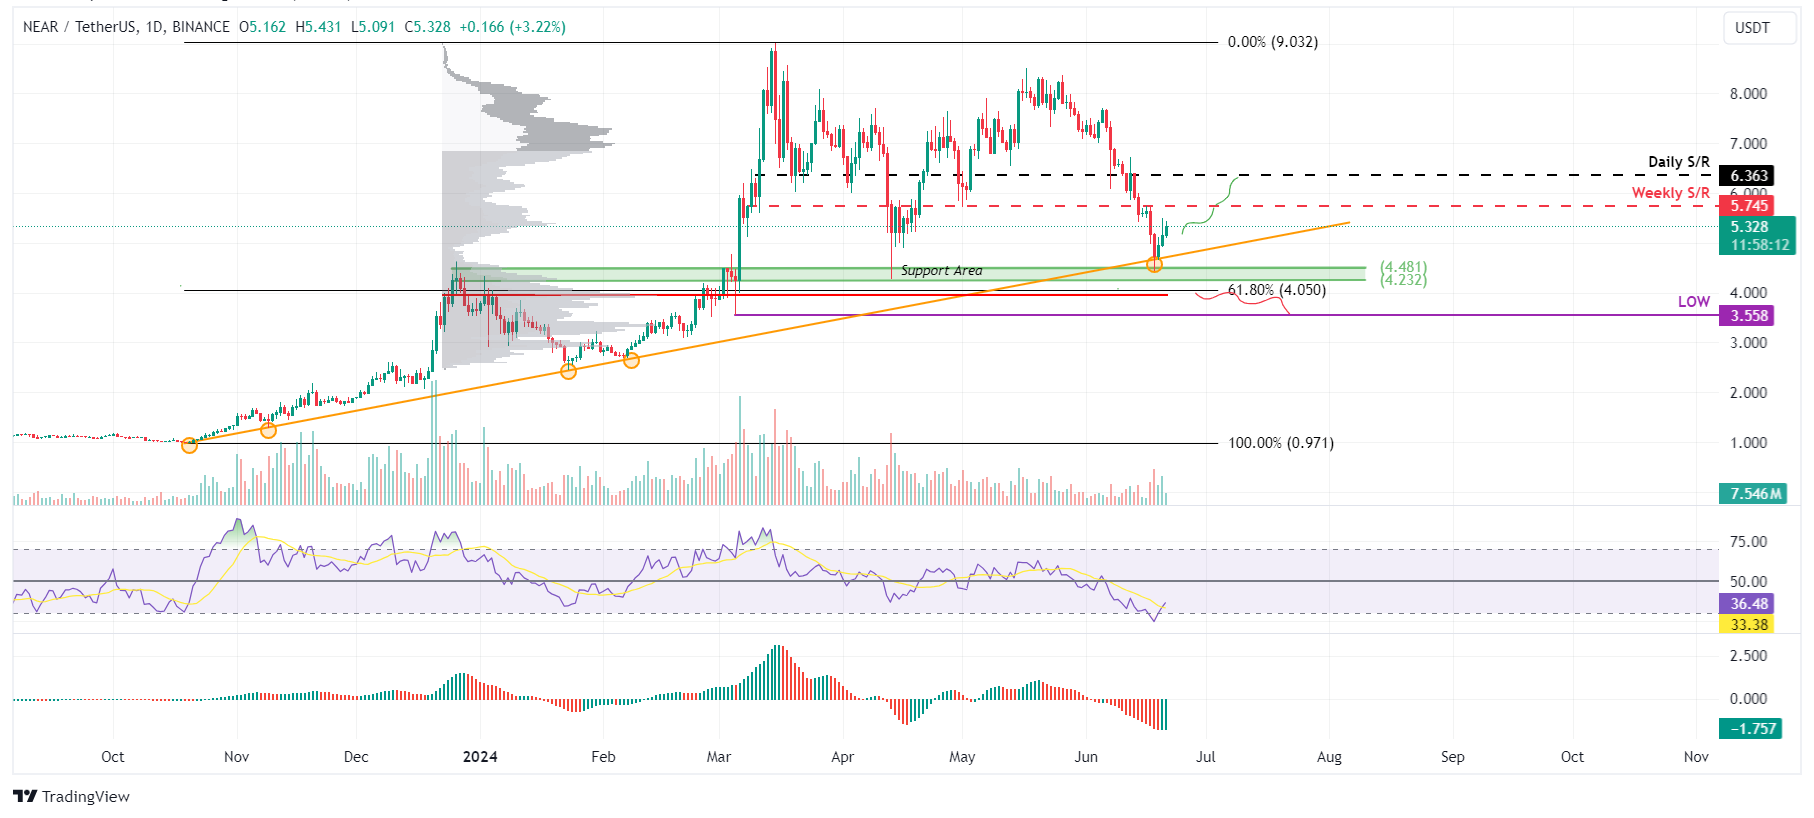
NEAR/USDT 1-day chart
However, if NEAR's daily candlestick closes below $4.05 and establishes a lower low on the daily timeframe, it may signal a shift in market dynamics that favors bearish sentiment. Such a change could nullify the bullish outlook, leading to a 10% crash in the NEAR’s price to retest the low of March 5 at $3.55.
Recommended Articles


