Chainlink faces one hurdle on path to $20, on-chain metrics signal price rally

Source Fxstreet
  • Chainlink on-chain metrics show dwindling exchange reserves and a likely reduction in selling pressure on LINK. 
  • LINK price likely faces resistance at $17.64 and $18.82, on its uptrend towards the $20 target.  
  • Chainlink price climbed over 6% on January 15, after rallying nearly 20% in the past week.

Chainlink price hit a local peak of $17.64 on December 28, for the first time since April 2022. LINK price is $15.65, at the time of writing. The altcoin noted a mini breakout over the weekend and the price rallied to a high of $15.86, for the first time in two weeks. 

LINK supply on exchanges has declined, supporting a price recovery thesis for the altcoin. 

Also read: Axie Infinity and Bitcoin Cash hold up despite high ratio of shorts

Chainlink on-chain metrics support LINK price rally

Chainlink’s supply on exchanges declined below 15% for the first time in four years, according to Santiment data. The number of wallet addresses with non-zero LINK balance is within 6% of its all-time high. 

LINK

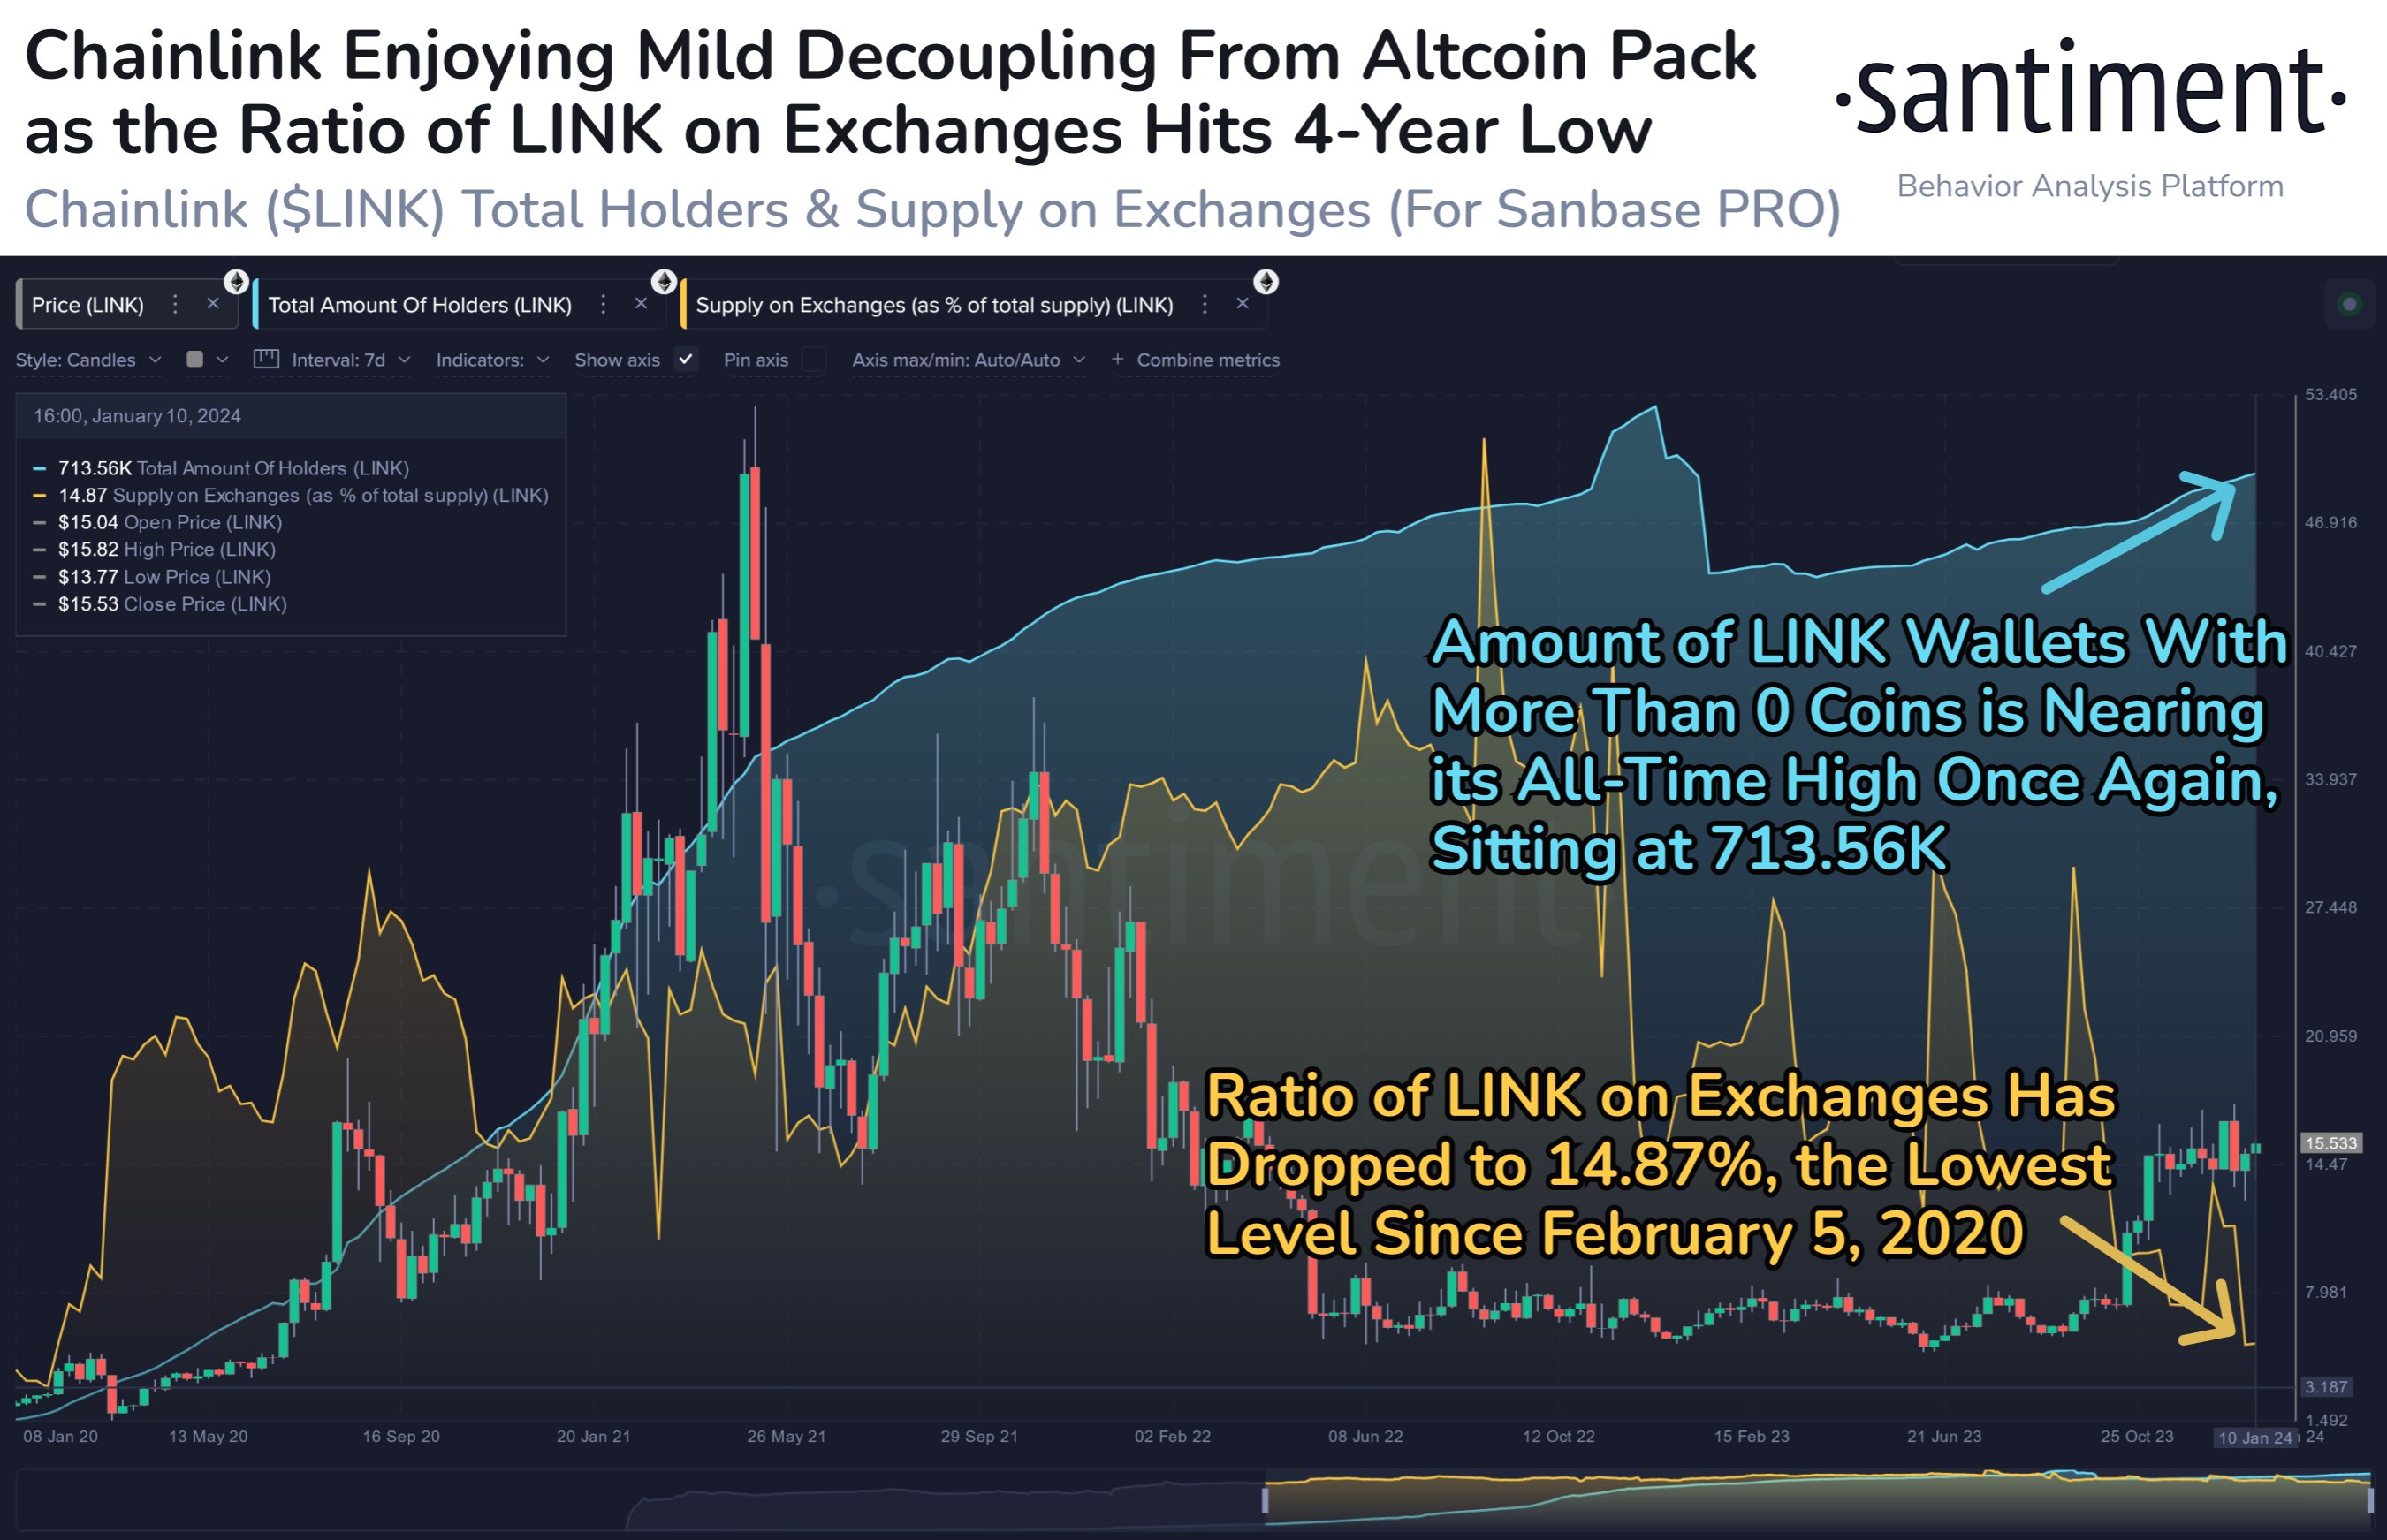
Chainlink on exchanges hits lowest level since 2020. Souce: Santiment

Chainlink’s supply on exchanges declined to 14.89% of LINK’s total supply, as seen in the Santiment chart below. A decline in exchange supply typically signals a decline in selling pressure, followed by an increase in LINK price. 

Chainlink

Chainlink supply on exchanges. Source: Santiment 

Chainlink faces one resistance on path to $20

According to IntoTheBlock data, on its path to $20, Chainlink faces resistance at $18.82. LINK price is currently in a support zone, between $15.35 and $18.82, where 53,510 wallet addresses accumulated 18.97 million LINK tokens. 

LINK’s key resistance zone is between $18.82 and $26.88. The $20 target lies within this zone where 92,530 addresses bought 50.35 million LINK. This makes it a key zone to watch for LINK price. Once LINK breaks into this zone, a rally to $20 is more likely. 

LINK

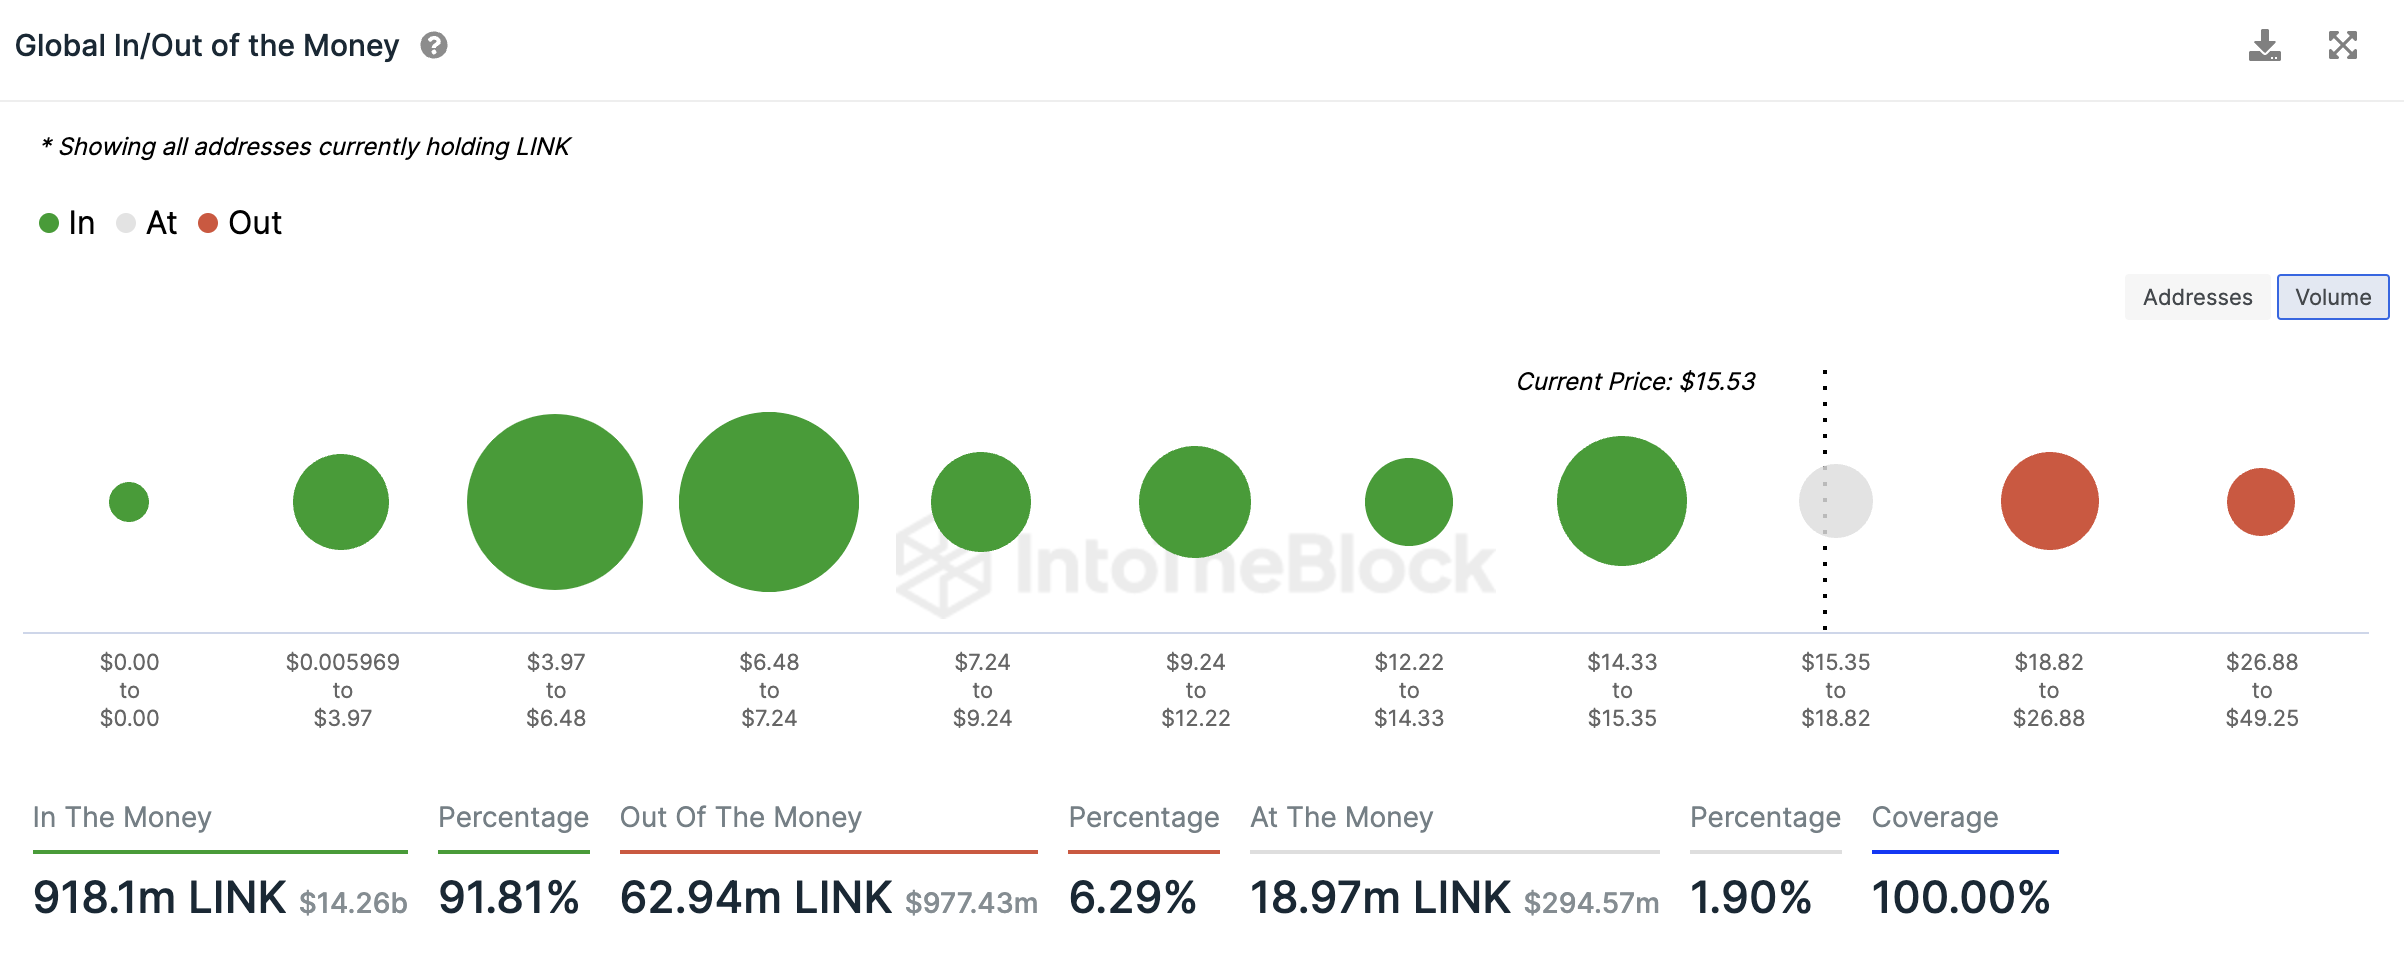
Global In/out of the Money. Source: IntoTheBlock 

As seen in the LINK price chart below, LINK price could rally to the bearish imbalance zone between $19.54 and $20.01, once Chainlink breaks past resistance at $17.64, the 2023 peak for the altcoin. 

LINK

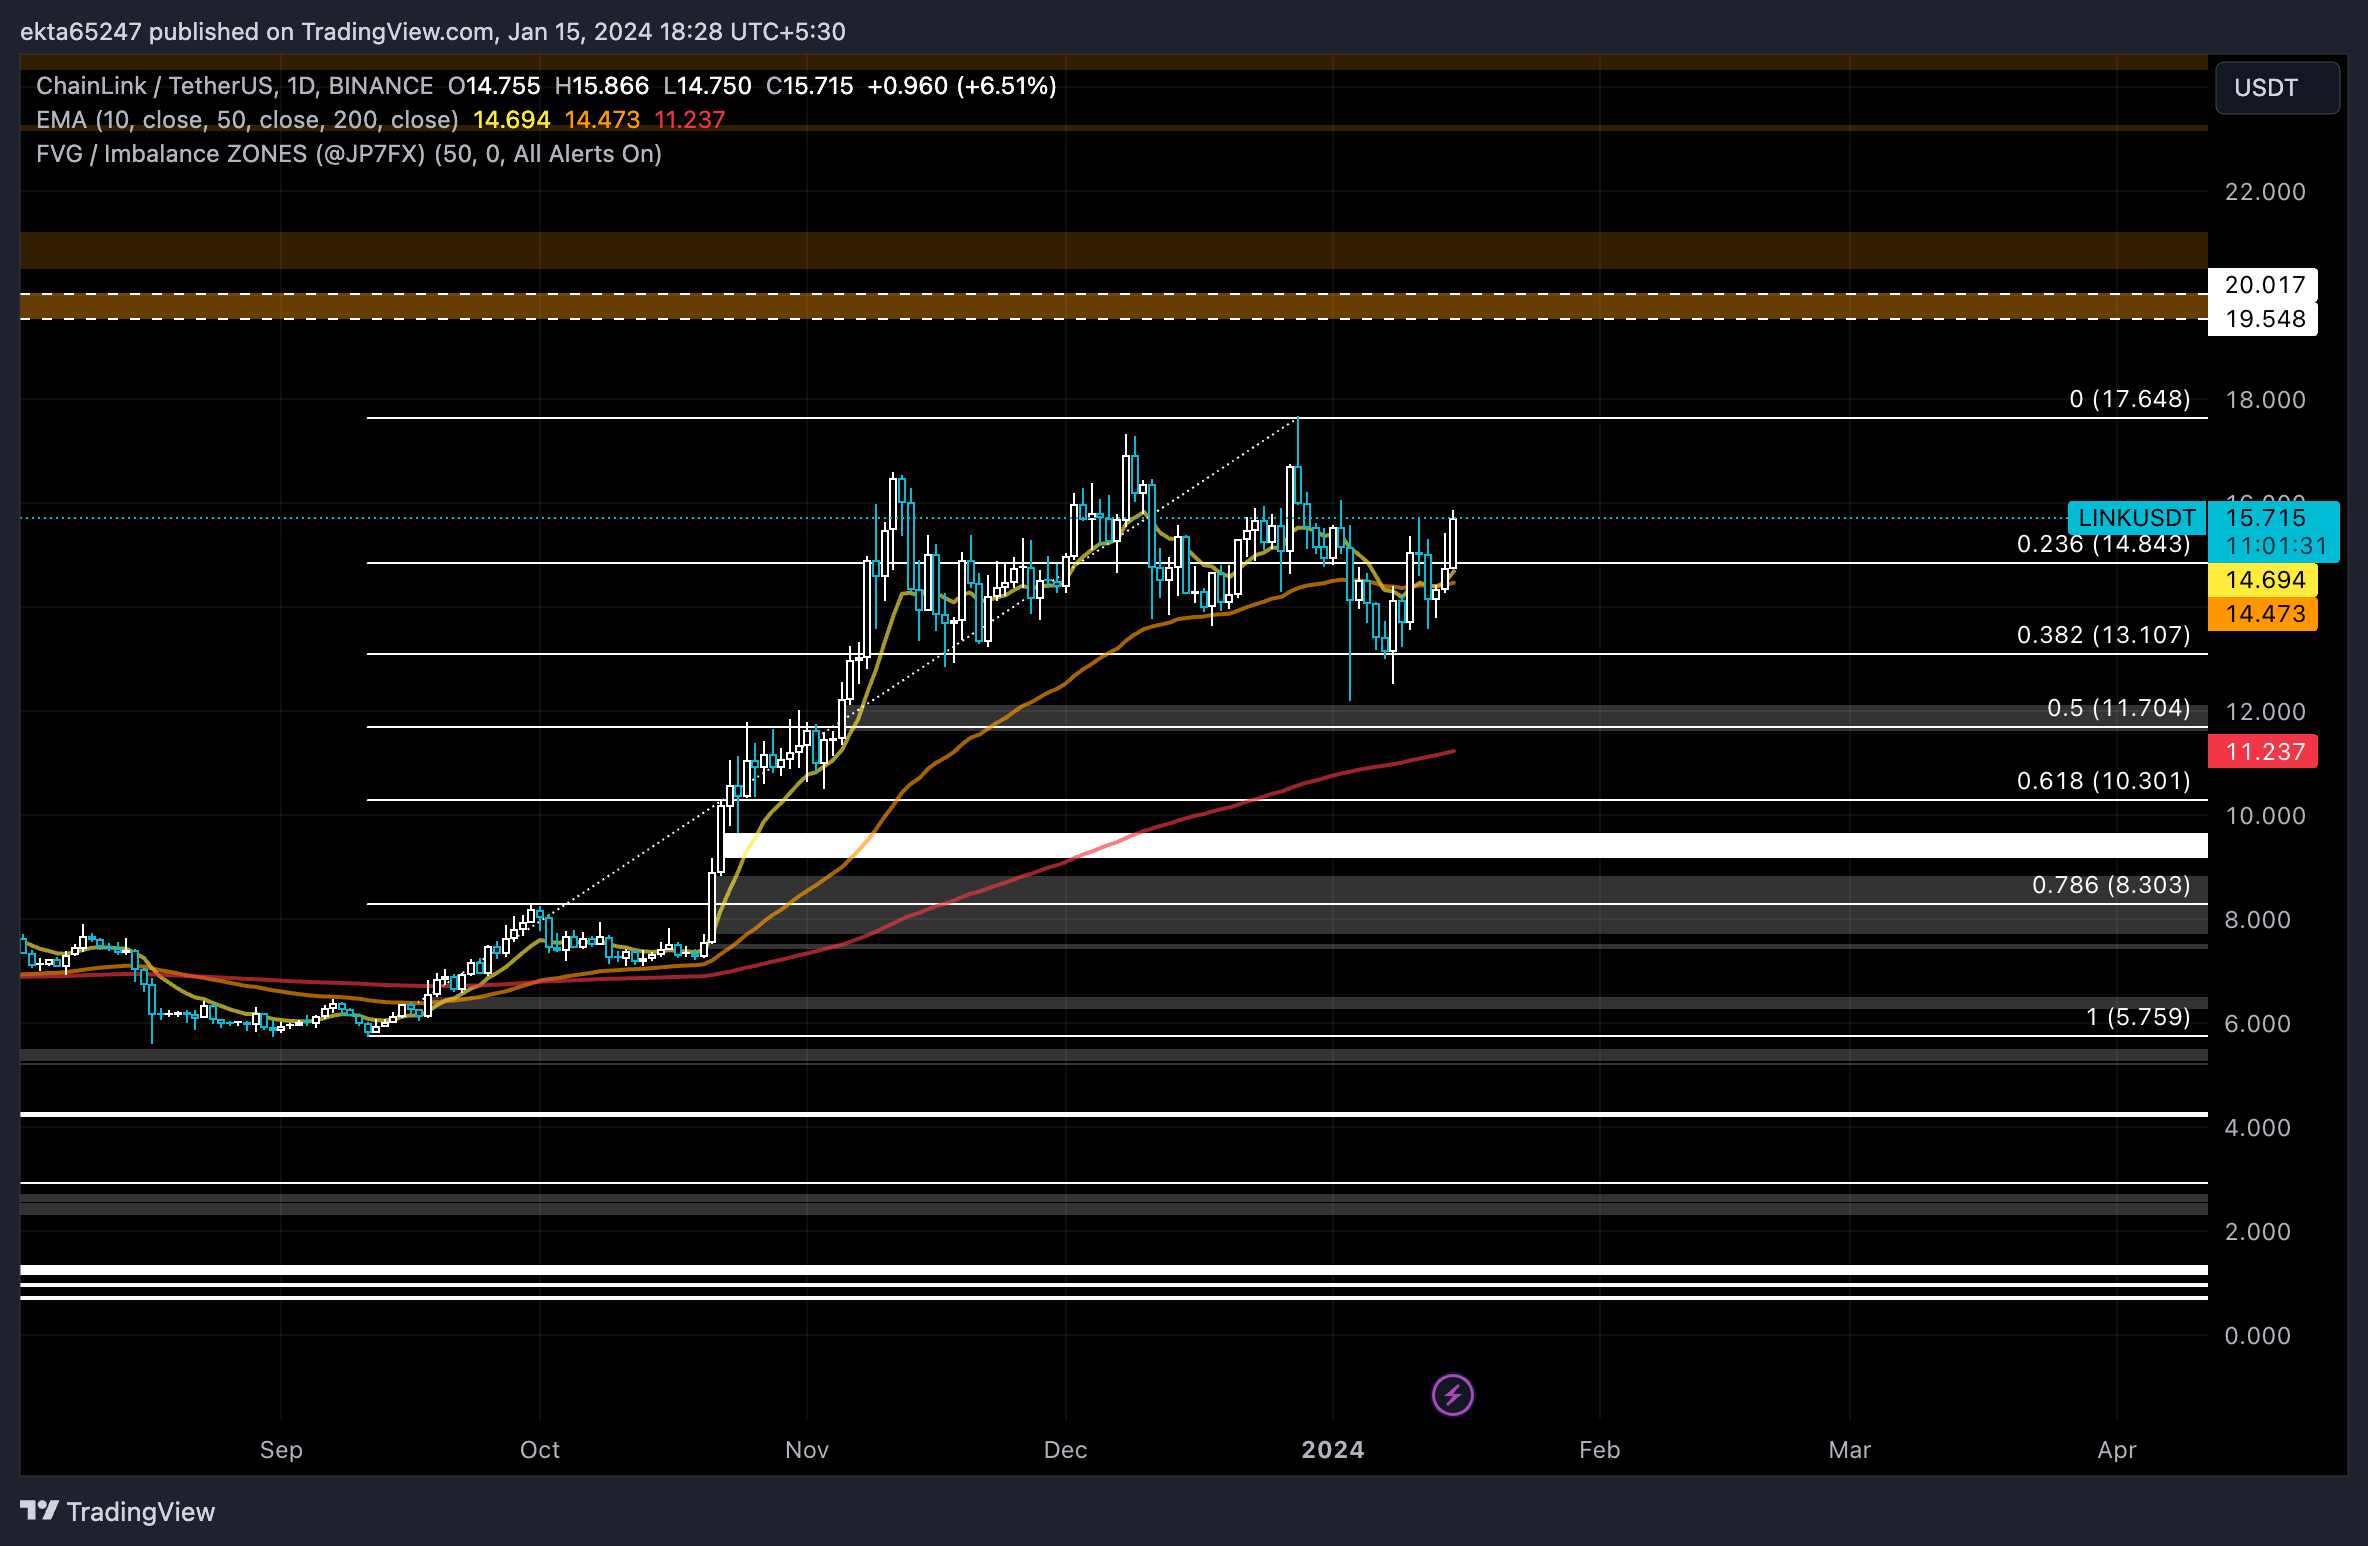
LINK/USDT 1-day chart 

A daily candlestick close below the 50-day Exponential Moving Average (EMA) at $14.47 could invalidate the bullish thesis for LINK.

Disclaimer: For information purposes only. Past performance is not indicative of future results.
placeholder
EURUSD Long-term Forecast: Can ECB Hawks Overcome the Dollar Bullishness? As one of the most traded currency pair in the forex markets, the price of EURUSD affects many traders. Check out our EURUSD long-term forecast for more information.
Author  Mitrade
Dec 04, 2023
As one of the most traded currency pair in the forex markets, the price of EURUSD affects many traders. Check out our EURUSD long-term forecast for more information.
placeholder
Bitcoin ETF Inflows For 2025 Now Outpace 2024, Data ShowsUS Bitcoin spot exchange-traded funds (ETFs) have seen more inflows this year so far compared to the same point in 2024, according to data.
Author  Bitcoinist
Jul 16, 2025
US Bitcoin spot exchange-traded funds (ETFs) have seen more inflows this year so far compared to the same point in 2024, according to data.
placeholder
ECB Policy Outlook for 2026: What It Could Mean for the Euro’s Next MoveWith the ECB likely holding rates steady at 2.15% and the Fed potentially extending cuts into 2026, EUR/USD may test 1.20 if Eurozone growth proves resilient, but weaker growth and an ECB pivot could pull the pair back toward 1.13 and potentially 1.10.
Author  Mitrade
Dec 26, 2025
With the ECB likely holding rates steady at 2.15% and the Fed potentially extending cuts into 2026, EUR/USD may test 1.20 if Eurozone growth proves resilient, but weaker growth and an ECB pivot could pull the pair back toward 1.13 and potentially 1.10.
placeholder
My Top 5 Stock Market Predictions for 2026Five 2026 market predictions written in a native, news-style voice: AI’s winners and losers, broader sector leadership, dividend demand, valuation cooling as the Shiller CAPE sits at 39 (Dec. 31, 2025), and quantum-computing bursts—while keeping all original facts and numbers unchanged.
Author  Mitrade
Jan 06, Tue
Five 2026 market predictions written in a native, news-style voice: AI’s winners and losers, broader sector leadership, dividend demand, valuation cooling as the Shiller CAPE sits at 39 (Dec. 31, 2025), and quantum-computing bursts—while keeping all original facts and numbers unchanged.
placeholder
Financial Markets 2026: Volatility Catalysts in Gold, Silver, Oil, and Blue-Chip Stocks—A CFD Trader's OutlookGet a comprehensive financial market 2026 outlook exploring key economic drivers, volatility catalysts in gold, oil and stocks, and what the evolving economic outlook means for cfd trading strategies and risk management on global markets.
Author  Rachel Weiss
3 hours ago
Get a comprehensive financial market 2026 outlook exploring key economic drivers, volatility catalysts in gold, oil and stocks, and what the evolving economic outlook means for cfd trading strategies and risk management on global markets.
Related Instrument
goTop
quote