

Ethereum derivatives data indicate mixed sentiments following SEC Chair comments on ETH ETF approvals
- Ethereum ETF S-1s will likely be approved by the end of the summer, says SEC Chair Gary Gensler.
- Ethereum exchange reserves have declined by about $4 billion in past two weeks.
- Ethereum derivatives data reveal divergent sentiment among short-term and long-term traders.
Ethereum's (ETH) price was down nearly 5% on Thursday as Securities & Exchange Commission (SEC) Chair Gary Gensler suggested spot ETH ETFs will likely receive approval over the course of the summer. The update was accompanied by mixed sentiment from derivatives traders.
Daily digest market movers: ETH ETF summer launch, declining exchange reserves
Ethereum price could see a reversal after the latest development for spot ETH ETFs. Here is the latest news surrounding the top altcoin:
According to Fox Business’s Eleanor Terrett, SEC Chair Gary Gensler told Senator Bill Hagerty that spot ETH ETF S-1s will likely be approved "over the course of the summer."
Also read: Ethereum poised for recovery following increased exchange outflows
The SEC approved issuers' 19b-4 filings on May 23 but also needs to greenlight their S-1s before spot ETH ETFs go live.
Meanwhile, Framework Ventures co-founder Vance Spencer believes Ethereum is a "tech-style growth play" that will become the app store of finance.
"ETH is at the forefront of the tokenization movement that's really going to define the next few decades of traditional finance," he said.
"People are going to be really surprised at the uniqueness of the scale of business Ethereum is going to generate from the tokenization wave," Spencer added.
Read more: Ethereum breaches key support, receives ‘digital oil’ tag from world's largest bank
According to data from CryptoQuant, ETH has seen over $1.5 billion in net exchange outflow since June 9. ETH's exchange reserve has also declined by nearly 1.2 million ETH, worth over $4 billion, since May 27. This indicates a bullish outlook for ETH despite declining prices.
ETH technical analysis: Ethereum bearish sentiment likely temporary
Ethereum is trading around $3,434 on Thursday following a wider market decline after the Fed held interest rates steady on Wednesday.
ETH Open Interest (OI) declined by nearly 4% in the past 24 hours following the decline. Moreover, ETH options volume decreased by 51%, which shows options traders exercising caution.
Additionally, the ETH futures long/short ratio is at 0.88. A ratio below 1 shows the market is tending toward bears. However, this is likely a short-term bearish view, as traders may be looking to profit from the Federal Reserve's conservative outlook on interest rates.
Also read: Ethereum ecosystem sees impressive Q1 earnings, issuers plan to market ETH as the ‘ultimate app store’
Deribit's options data shows that ETH's put/call ratio (PCR) is at 0.32, indicating strong bullish sentiment from traders. A PCR above 0.7 or exceeding 1 indicates traders are buying more puts than calls, suggesting prevailing bearish sentiment. A PCR below 0.7 and approaching 0.5 is considered a bullish indicator.
As a result, ETH is likely to see a reversal in the next few days and may steady around $3,730 to $3,900.
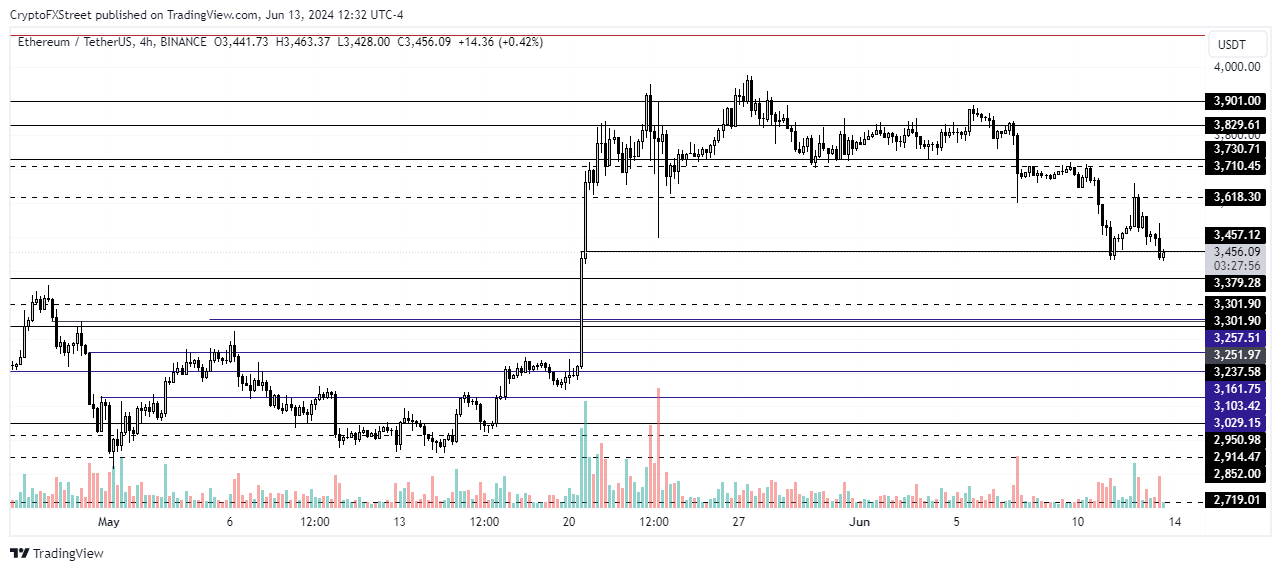
ETH/USDT 4-hour chart
The launch of spot ETH ETFs will likely push the largest altcoin to a new all-time high above $4,878. A breach of the $3,300 support will invalidate the bullish thesis.
Ethereum FAQs
Ethereum is a decentralized open-source blockchain with smart contracts functionality. Serving as the basal network for the Ether (ETH) cryptocurrency, it is the second largest crypto and largest altcoin by market capitalization. The Ethereum network is tailored for scalability, programmability, security, and decentralization, attributes that make it popular among developers.
Ethereum uses decentralized blockchain technology, where developers can build and deploy applications that are independent of the central authority. To make this easier, the network has a programming language in place, which helps users create self-executing smart contracts. A smart contract is basically a code that can be verified and allows inter-user transactions.
Staking is a process where investors grow their portfolios by locking their assets for a specified duration instead of selling them. It is used by most blockchains, especially the ones that employ Proof-of-Stake (PoS) mechanism, with users earning rewards as an incentive for committing their tokens. For most long-term cryptocurrency holders, staking is a strategy to make passive income from your assets, putting them to work in exchange for reward generation.
Ethereum transitioned from a Proof-of-Work (PoW) to a Proof-of-Stake (PoS) mechanism in an event christened “The Merge.” The transformation came as the network wanted to achieve more security, cut down on energy consumption by 99.95%, and execute new scaling solutions with a possible threshold of 100,000 transactions per second. With PoS, there are less entry barriers for miners considering the reduced energy demands.
Recommended Articles


