

BNB rallies as CZ begins jail term
- Binance's CZ reports to US federal prison on Monday as he begins his four-month jail term.
- BNB price increases by 5% as the news causes a bullish sentiment among investors.
- BNB could begin run to a new all-time high if it overcomes key resistance.
BNB's price warmed up nicely on Monday to Changpeng Zhao (CZ) beginning his jail term as it's looking toward setting a new all-time high. A new all-time high may be on the horizon if BNB breaks past key resistance.
CZ begins prison sentence
Binance's ex-CEO Changpeng Zhao (CZ) reported to Lompoc II, a federal prison in California, to begin his four-month jail term. On April 30, a US federal judge sentenced CZ to four months in jail for failing to establish robust anti-money laundering policies while serving as head of Binance. Under normal circumstances, this crime carries up to a 10 year prison sentence.
Prosecutors had proposed a three-year jail sentence, but the judge opted for a lesser sentence, citing CZ's guilty plea and cooperation with authorities. In addition to his jail term, CZ received a $50 million personal fine, while his crypto exchange Binance also agreed to pay a $4.3 billion fine.
Read more: Binance CEO CZ sentenced to four months in prison, BNB price slightly recovers
Although CZ stepped down from his role as Binance's CEO following the federal charges against him, he's still the largest shareholder in the company, with over a 90% stake. According to Bloomberg data, CZ's net worth is $36.5 billion at the time of writing, making him the richest person to serve jail time in recent US history.
BNB technical analysis: New all-time high not far away
BNB rallied nearly 6% in the past few hours following the commencement of CZ’s jail term.
The recent move has also seen BNB open interest (OI) spike by 24% in the past 24 hours, signifying increased investor attention to the asset.
Open interest is the total number of outstanding futures or options derivative contracts within a time frame that is yet to be settled.
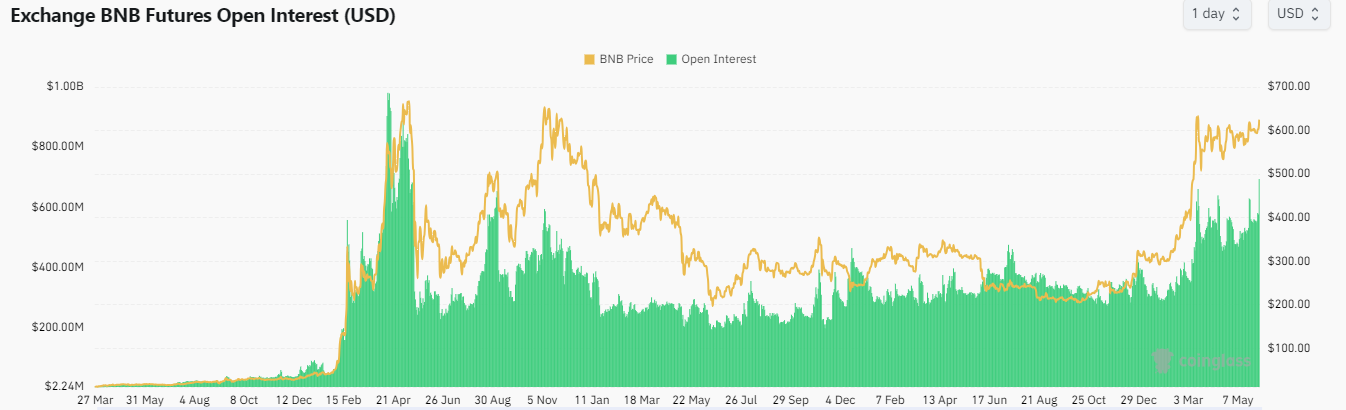
BNB Open Interest
Historically, BNB's price increase has often coincided with a rise in OI, indicating the token may be set for more price growth.
Also read: This Binance Coin price pattern breakout forecasts $1,000 per BNB
If the renewed investor interest is sustained, BNB could see a move above the $646 resistance to reach prices last seen in 2021. However, it could shed nearly 3% of its value to collect liquidity at the daily imbalance ranging from $601 to $639 before shooting above the $646 resistance.
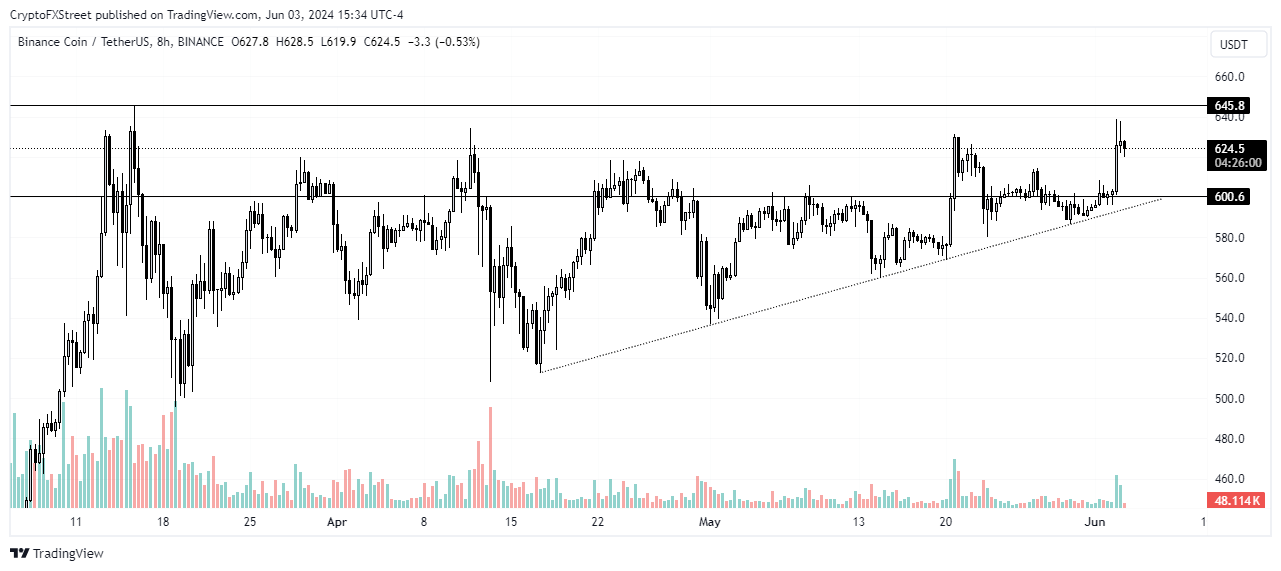
BNB/USDT 8-hour chart.
Considering that BNB is also one of the large-cap tokens that have yet to reach an all-time level in the current bull cycle, it may look to topple the $686 all-time high of May 10, 2021.
The bullish thesis will be invalidated if BNB falls below $587.
Recommended Articles


