

Three reasons why meme coin enthusiasts need to stay away from Shiba Inu
- Shiba Inu price continues consolidation above $0.0197 to $0.0273 level.
- On-chain metrics reveal that investors are looking to book profits.
- SHIB holders need to decide between being patient or booking profits for a better entry.
Shiba Inu (SHIB) price hovers around $0.0252, pondering on a directional bias. On-chain metrics show clear signs of bearish investor sentiment that are tell-tale signs of a potential downtrend.
Also read: Top trending meme coins BOME, TRUMP, WIF: Bullish signs persist
Shiba Inu investors unlikely to HODL
According to on-chain data provider Santiment, the 24-hour Active Addresses metric has plummeted significantly from 16,770 on May 22 to 6,852 on May 30. This drop in investors interacting with the Shiba Inu blockchain suggests that investors are not interested in Shiba Inu at the current price levels.
 [13.04.28, 01 Jun, 2024]-638528265692361936.png)
SHIB 24-hour Active Addresses
In addition to a drop in investor interest, SHIB holders are actively booking profit as indicated by the Network Realized Profit/Loss (NPL) indicator. Positive spikes suggest that investors are realizing profits and vice versa. After a 32% ascent in Shiba Inu price in the past two weeks or so, there have been three significant NPL upticks, suggesting active profit-taking and showcasing a bearish outlook for SHIB.
To add credence to this outlook, the supply of SHIB held on exchanges has also grown from 74.56 trillion to 76.87 trillion tokens worth nearly $76 million. This behavior indicates that holders are unsure of the future and might be looking to offload their tokens in case of panic selling.
 [13.04.16, 01 Jun, 2024]-638528265925143045.png)
SHIB NPL, Supply on Exchanges
Lastly, the Whale Transaction Count (WTC), transfers worth $100,000 or more, for Shiba Inu price also spiked during the recent uptick, showing that institutional investors were also looking to sell.
 [13.04.11, 01 Jun, 2024]-638528266090274363.png)
SHIB WTC
Also read: As random celebs like Caitlyn Jenner embrace Solana Meme Coins, early hoarders fare best
All in all, Shiba Inu price outlook seems bleak, at least in the short-term. Although the technical outlook suggests a potential recovery rally, investors need to be cautious. Due to the liquidity present on either side of the consolidation, there are two possible outcomes for SHIB.
SHIB slips 20% lower from $0.0252 to collect sell-side liquidity below $0.0205, before kickstarting a rally to $0.0315.
Instead, SHIB could first sweep the buy-side liquidity resting above $0.0295 before sliding down to collect the sell-side liquidity below $0.0205. The bounce from this point could push SHIB back up to the $0.0315 hurdle again.
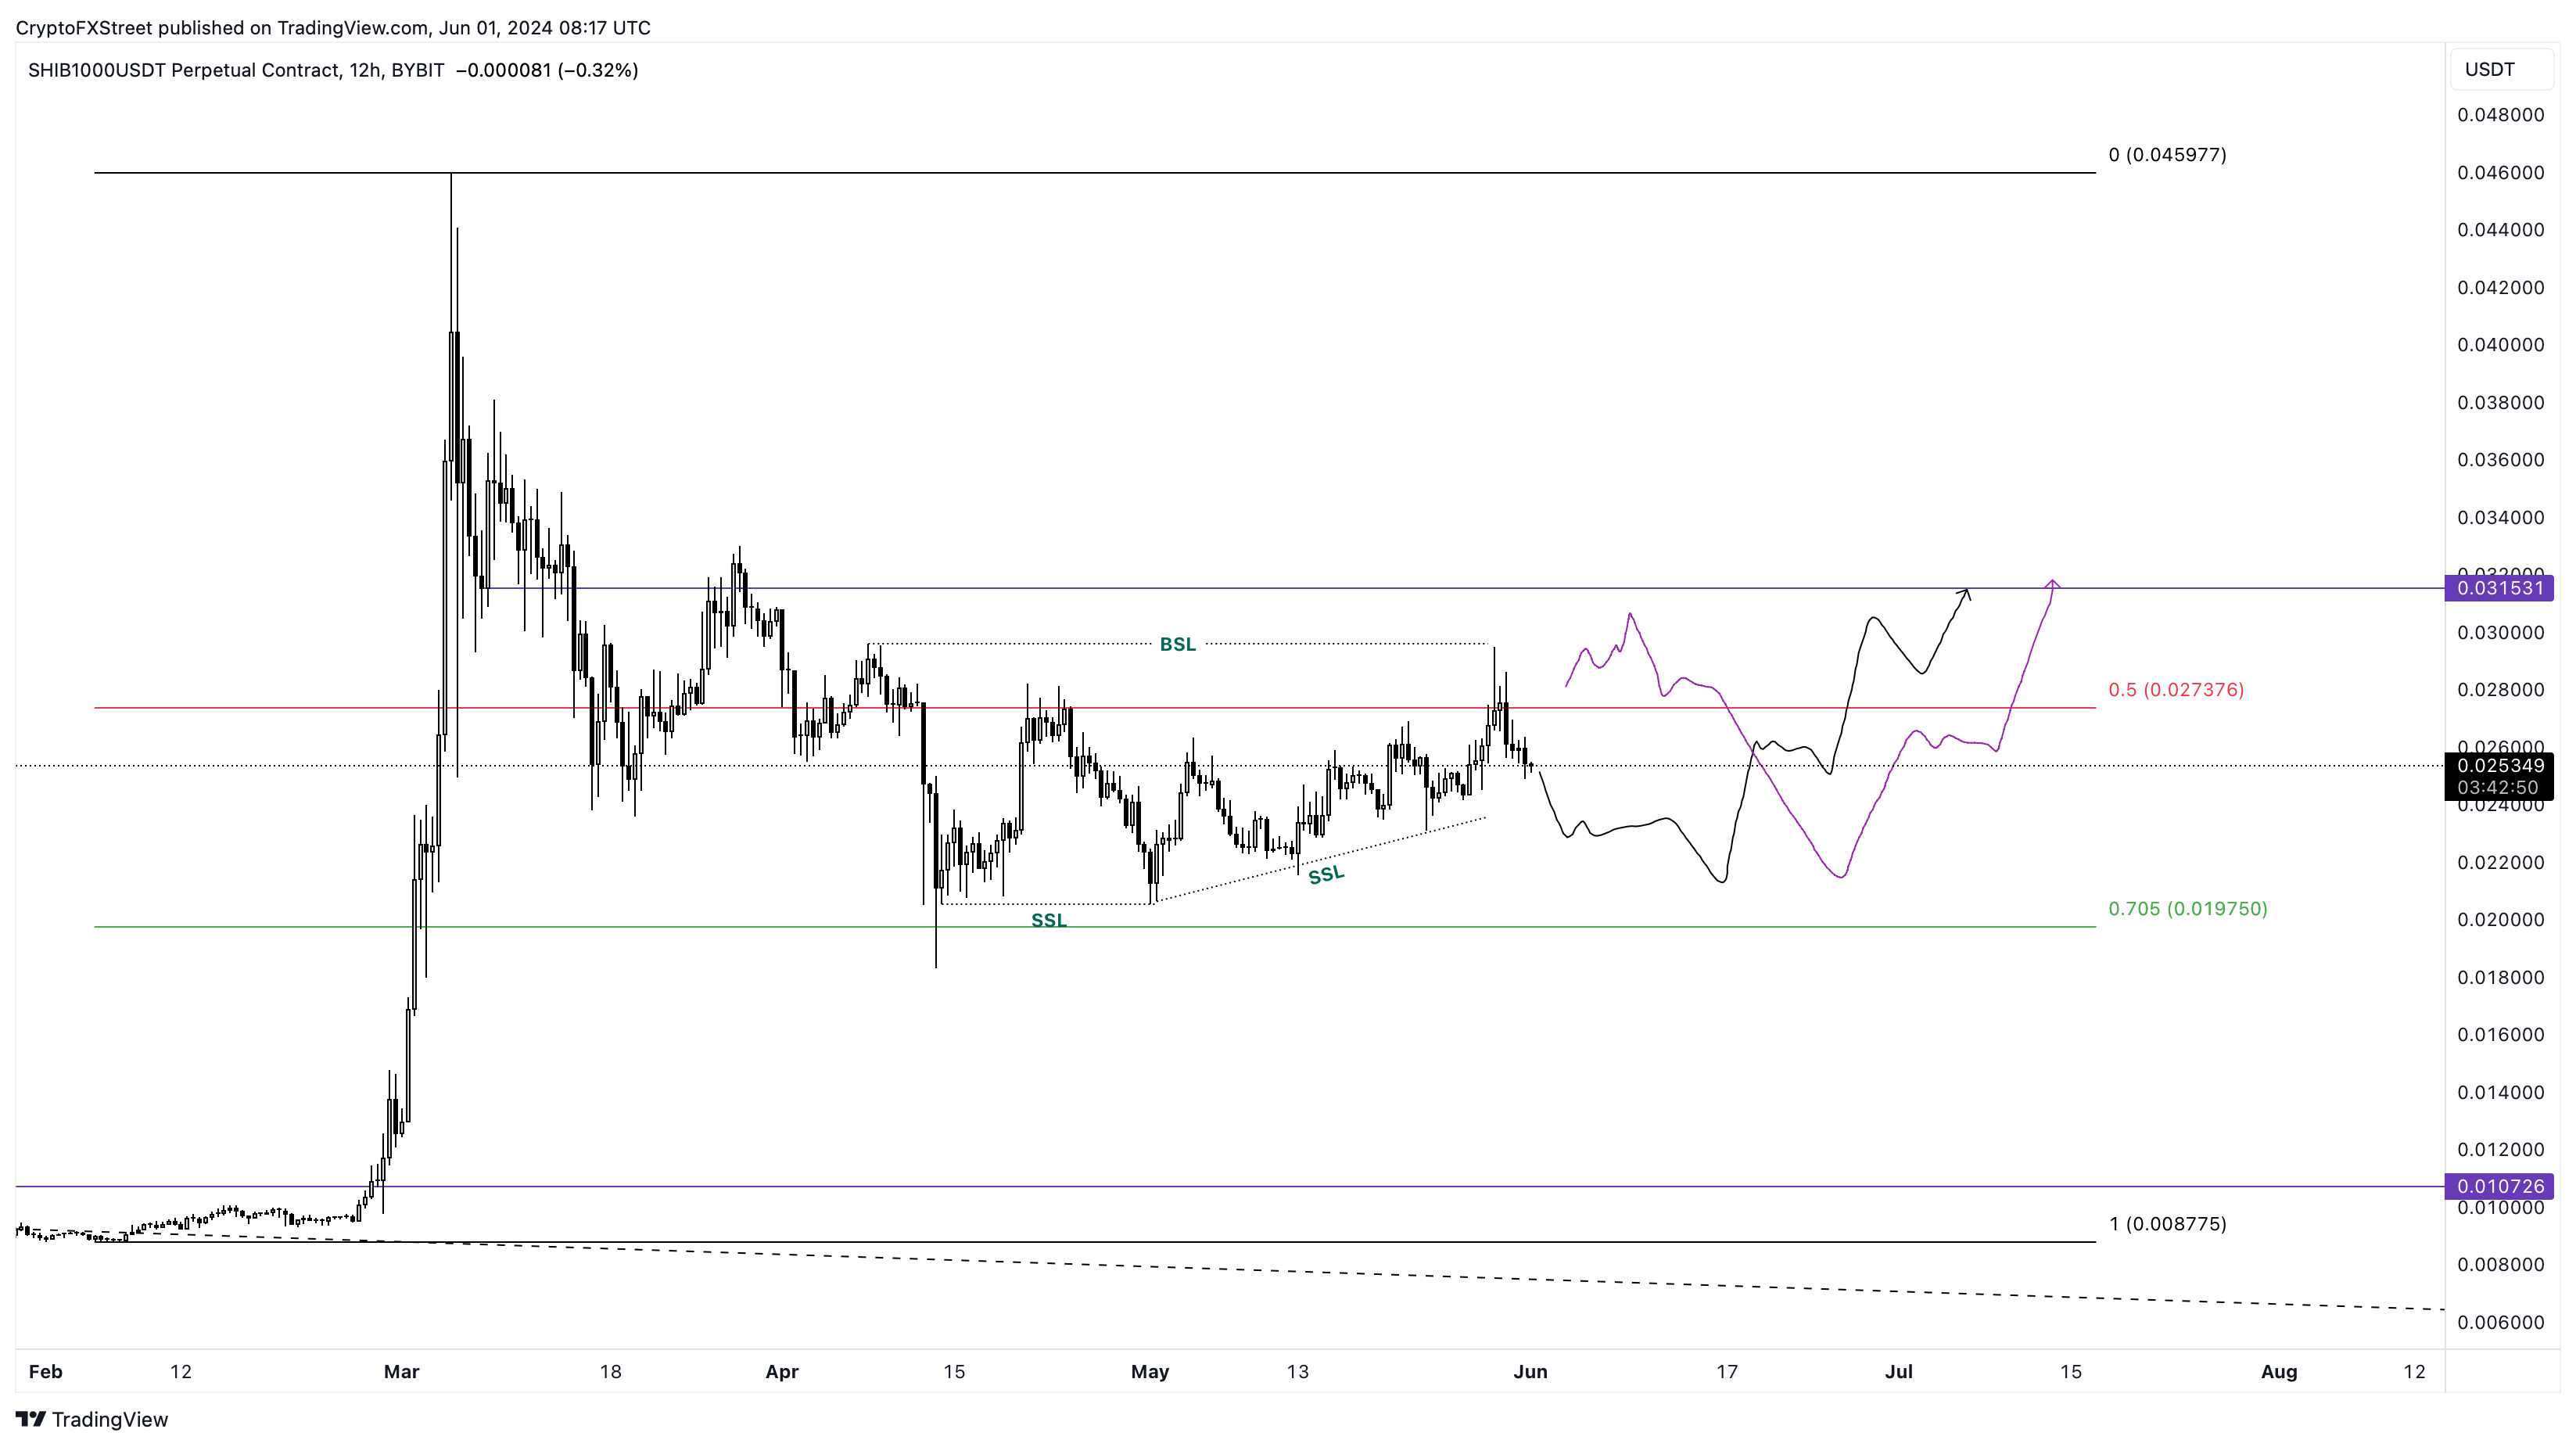
SHIB/USDT 12-hour chart
In both cases, the move from $0.0205 to $0.0315 constitutes a 45% ascent and is something that swing traders can capitalize on.
Recommended Articles


