


Top 3 Price Prediction Bitcoin, Ethereum, Ripple: Facing correction after ETFs led rally
- Bitcoin price is unable to overcome the $69,712 to $71,907 area of resistance.
- Ethereum price will likely pullback into the major support level of $3,360.
- Ripple price could end the consolidation between $0.463 and $0.572 range.
Bitcoin (BTC) price continues to consolidate in a range that offers a buying opportunity, while other major cryptocurrencies, such as Ethereum (ETH) and Ripple (XRP), look set for a potential price correction. ETH and XRP rallied 10% and 5%, respectively, right after the US Securities and Exchange Commission (SEC) approved Ethereum’s spot Exchange Traded fund (ETF).
Bitcoin price eyes for a rally
Bitcoin price rallied 8% on May 20, but such an impulsive move could lead to a retracement. As seen in the chart below, BTC is currently being rejected by the order block between $69,712 and $71,240, which also harbors the weekly close at $71,280.
Sideline investors looking for buying opportunities could do so at the following levels:
- The volume profile high node range that extends from $67,090 to $66,035.
- The 100-day Exponential Moving Average (EMA) is currently at $62,533, coinciding with the bullish order block range between $62,985 and $61,427.
If BTC bounces off the $62,533 level, it could rally 10% to the local top formed at $69,712.
The Relative Strength Index (RSI) and Awesome Oscillator (AO) indicators support the aforementioned bounce, which are firmly present above their respective mean values of 50 and 0, suggesting that the bulls are in control.
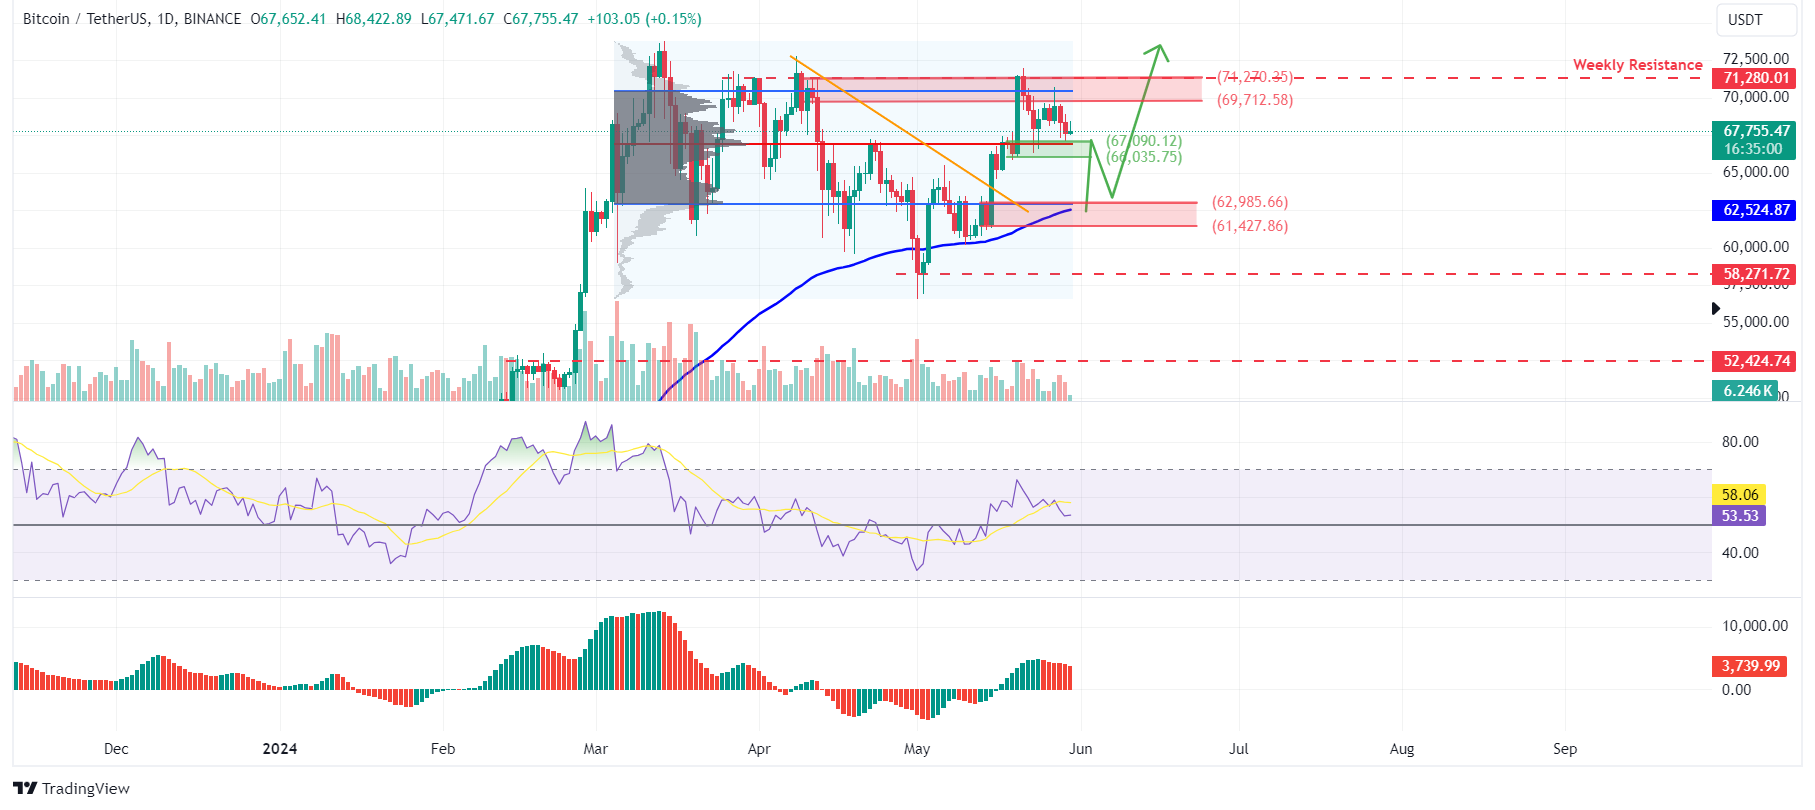
BTC/USDT 1-day chart
On the other hand, if Bitcoin's price closes below $58,271, it would invalidate this bullish thesis by producing a lower low in the higher timeframe, leading BTC to crash an extra 10% and hitting the previous support level of $52,400.
Ethereum price wants to move higher
Ethereum price broke above the falling wedge pattern and the 50 EMA level at $3,144 on May 20 and rallied 21%. Currently, ETH is being rejected by the bearish order block of March 12, ranging from $3,980 to $4,093.
Ethereum price could rally upwards in two ways:
- A break out above the daily bearish order block, extending from $3,980 to $4,093, flipping it into a support zone.
- ETH could pullback into the major support zones of 50-day EMA at $3,558, which roughly coincides with the bullish order block, stretching from $3,393 to $3,119.
If the conditions mentioned above are to play out, then the Ethereum price could revisit its all-time high (ATH) of $4,868.
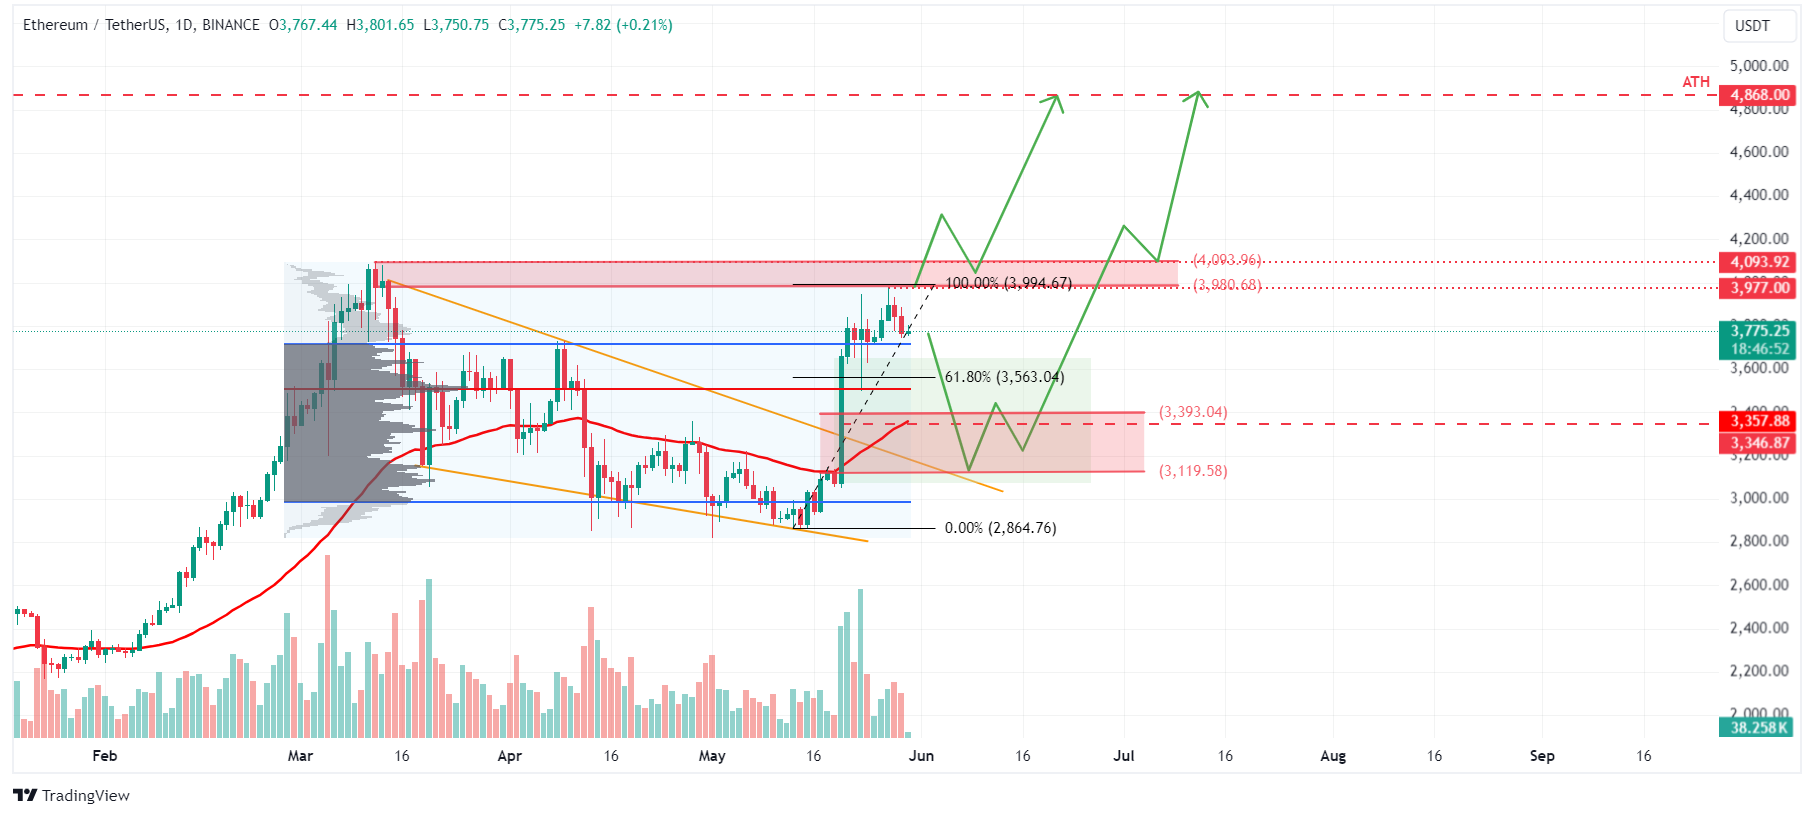
ETH/USDT 1-day chart
On the other hand, if Ethereum's daily candlestick price closes below the $2,864 level, it would produce a lower low and signal a break in the market structure. This move would invalidate the aforementioned bullish thesis, potentially triggering an extra 8% crash to the previous support level of $2,600.
Ripple price likely to end its consolidation phase
Ripple price is currently consolidating between $0.572 and $0.463 after a major 33% fall in mid-April. This 46-day consolidation has seen XRP forming higher lows in the daily time frame, indicating a decrease in selling pressure.
If Ripple price breaks above the $0.561 —$0.572 range, it could rally 8% to revisit the 61.8% Fibonacci retracement level at $0.621.
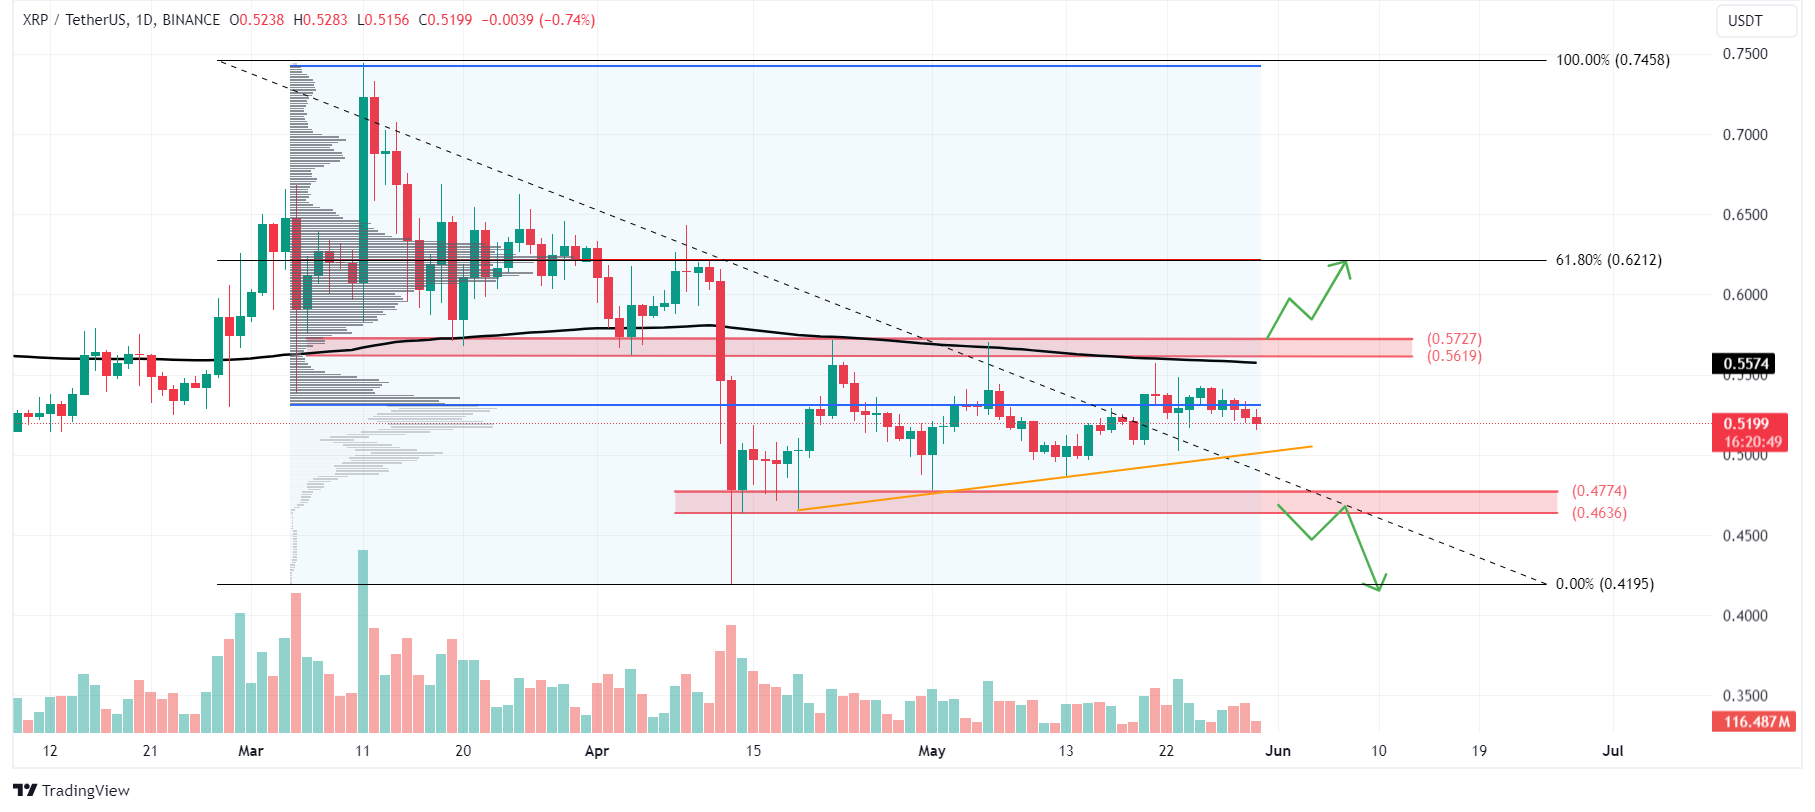
XRP/USDT 1-day chart
However, if the Ripple price breaks below the range of $0.463, then XRP would crash an additional 10% to its previous support at $0.419.
Recommended Articles


