

Solana to Hit $1,000? Analyst Makes Bullish Call Despite Recent Downturn

Source Newsbtc

Solana (SOL) defied a slight market dip today, maintaining key support levels and sparking renewed optimism among investors. The altcoin boasts a healthy 24-hour trading volume of $6.50 billion, solidifying its position among the top cryptocurrencies. Market dominance for SOL sits at 3.04%.

Analyst Bullish On Solana, Predicts Meteoric Rise

Prominent crypto analyst Trader Tardigrade isn’t shying away from bold predictions. In a recent analysis, Tardigrade expressed a highly optimistic view of Solana’s future price trajectory. According to the analyst, SOL, currently trading at $170, has successfully broken free from its recent consolidation pattern, signifying a bullish charge towards a staggering $1,000 mark.

Beyond price predictions, Tardigrade emphasized the exciting developments brewing within the Solana ecosystem. One such development is the rise of SocialFi applications, a new wave of social media platforms built on blockchain technology.
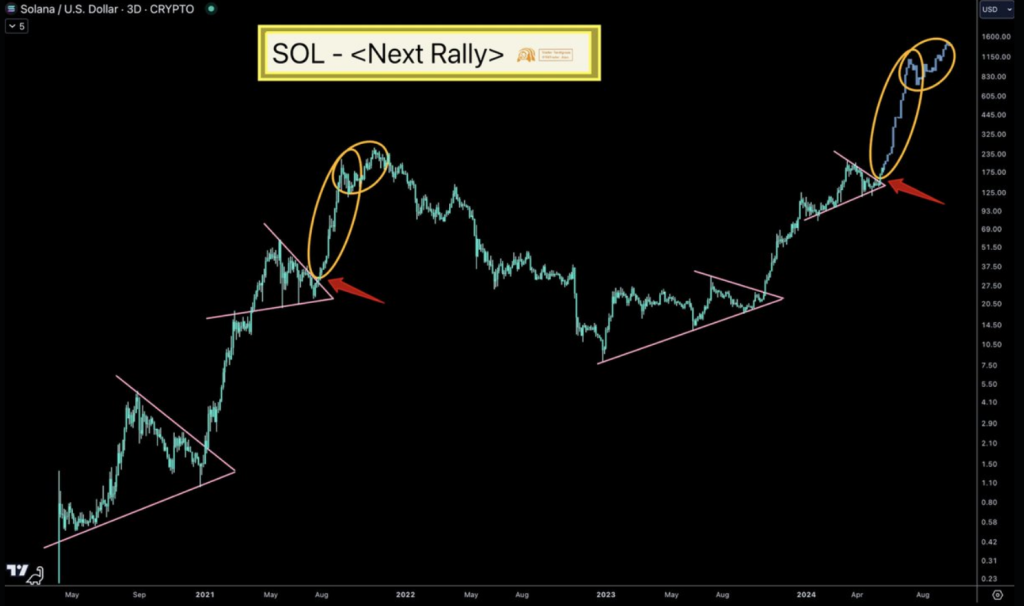
While short-term price fluctuations saw a 4.50% decrease in the last 24 hours and a 1.30% decline over the past week, the overall outlook for SOL remains upbeat. Market observers are particularly enthusiastic about both the immediate and long-term prospects for the cryptocurrency.

Ethereum ETF Approval Impact

The recent green light for the highly anticipated Ethereum ETF is expected to have a ripple effect, positively impacting the entire altcoin market, including Solana. This market-wide bullish sentiment could propel SOL prices even higher.

The Ethereum ETF’s approval not only signifies increased institutional trust in the cryptocurrency market but also paves the way for other blockchain projects to gain mainstream attention. As more investors become comfortable with cryptocurrency investments through regulated financial products, altcoins like Solana are poised to benefit from increased liquidity and wider adoption.

At its all-time high of $259 on November 6, 2021, Solana reached its highest price; at its all-time low of $ 0.503701 on May 11, 2020, it recorded its lowest price.
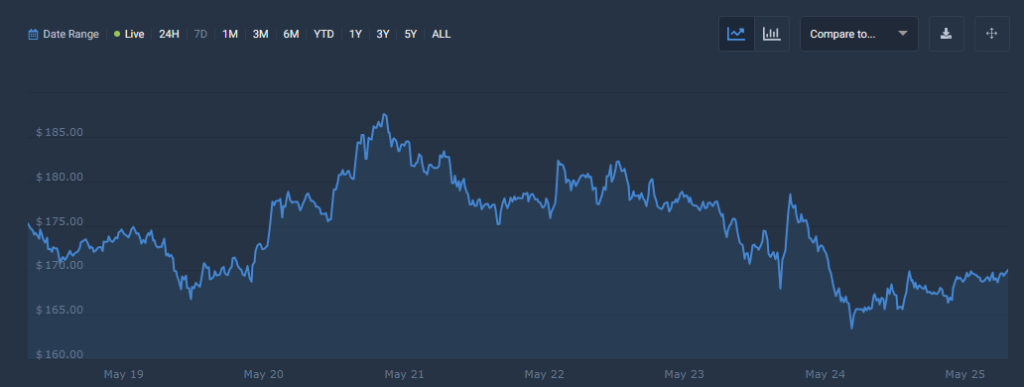
Since its ATH, the lowest price was $8.00. Since the previous cycle low, the highest SOL price was $207. Right now, there is optimistic emotion with the Solana price projection, and the Fear & Greed Index is showing 76 (Extreme Greed).

Featured image from Chorlton Fireworks, chart from TradingView 

Disclaimer: For information purposes only. Past performance is not indicative of future results.
placeholder
WTI (USOIL) Is down 2.03% on Sep 25: Here Is WhyWTI (USOIL) is down 2.03% at Sep 24 22:20(UTC+0), now at $92.517, with a 7-day down of 3.63%.What is driving WTI (USOIL)’s stock price down today?The drop in WTI crude oil prices was primarily driven by
Author  TradingKey
Yesterday 04: 57
WTI (USOIL) is down 2.03% at Sep 24 22:20(UTC+0), now at $92.517, with a 7-day down of 3.63%.What is driving WTI (USOIL)’s stock price down today?The drop in WTI crude oil prices was primarily driven by
placeholder
Silver Price Forecast: XAG/USD remains steady near $64.00 as oil prices easeSilver price (XAG/USD) inches higher after two days of losses, trading around $63.90 per troy ounce during Asian hours on Friday. Non-yielding Silver is finding underlying support as inflation concerns ease following a pullback in crude oil prices.
Author  FXStreet
Yesterday 03: 30
Silver price (XAG/USD) inches higher after two days of losses, trading around $63.90 per troy ounce during Asian hours on Friday. Non-yielding Silver is finding underlying support as inflation concerns ease following a pullback in crude oil prices.
placeholder
Gold Price Forecast: Gold Drops Below $4,300, Will It Continue to Fall? As of the European session on September 24, gold prices (XAUUSD) extended their correction, dipping below $4,300 intraday to hit a low of $4,262.45. After previously rebounding close to $
Author  TradingKey
Sep 24, Thu
As of the European session on September 24, gold prices (XAUUSD) extended their correction, dipping below $4,300 intraday to hit a low of $4,262.45. After previously rebounding close to $
placeholder
Yen touches 158.37 as Tokyo reopens, then slips back — ¥15.4 trillion of intervention and the 200-day line stand between here and 160USD/JPY reached 158.37 overnight, its highest since early September, then eased to 157.88 as Japanese markets reopened after a three-day holiday. The Ministry of Finance has spent ¥15.4 trillion defending the yen since late July and the BOJ ran a rate check on September 18. The 200-day average sits at 158.43.
Author  Irene Q.
Sep 24, Thu
USD/JPY reached 158.37 overnight, its highest since early September, then eased to 157.88 as Japanese markets reopened after a three-day holiday. The Ministry of Finance has spent ¥15.4 trillion defending the yen since late July and the BOJ ran a rate check on September 18. The 200-day average sits at 158.43.
placeholder
US input costs rose at the fastest pace in four years — the September flash PMI beat is an inflation story, not a growth storyUS September flash PMIs came in far above expectations, with the composite at 58.4, a five-year high. But the detail that moved markets was input cost inflation at its fastest since October 2022, driven by fuel, transport and supply shortages. Brent is back above $100 and the 10-year Treasury yield has hit its highest since 2007.
Author  Suzie
Sep 24, Thu
US September flash PMIs came in far above expectations, with the composite at 58.4, a five-year high. But the detail that moved markets was input cost inflation at its fastest since October 2022, driven by fuel, transport and supply shortages. Brent is back above $100 and the 10-year Treasury yield has hit its highest since 2007.
goTop
quote