


Bitcoin price tests $67,000 with over $120 million in total liquidations across crypto market
- Bitcoin price is up 10% in seven days, shattering $67,000 threshold on Friday.
- Over $120 million in total liquidations recorded across crypto market.
- $2.1 billion worth of Bitcoin and Ethereum options expire today.
- A stable close above $67K would indicate a change in market structure
Bitcoin (BTC) price continues to show strength even as the market prepares for the weekend. After the April CPI release on Wednesday, and multiple news pointing to retail and institutional interest for BTC exposure through exchange-traded funds (ETF), the pioneer cryptocurrency is closing the week with the right foot forward.
Also Read: Bitcoin Weekly Forecast: Is BTC out of the woods?
Daily digest market mover: Bitcoin rally liquidates over $120 million in total positions
Bitcoin price is trading with a bullish bias, boasting up to 10% in gains over the past seven days. In the last 24 hours, it is up by 2.2%, which is not a mean feat even for the king of crypto. With altcoins taking the same cues, the global crypto market capitalization is up by 2.8% to $2.43 trillion.
With the surge, over $120 million in total positions have been liquidated across the market. This is composed of $83 million in short positions and nearly $40 million in long positions.
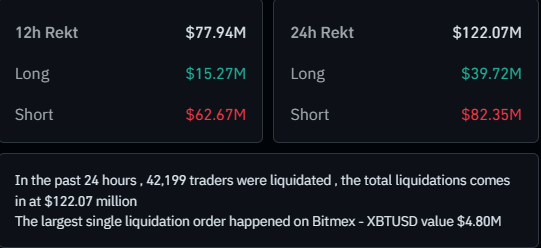
Total liquidations
Meanwhile, up to $2.1 billion worth of Bitcoin and Ethereum options expire today. Specifically, 18,000 BTC options are set to expire with a put call ratio of 0.63. The maximum pain point is at $63,000 with notional value of $1.2 billion.
JUST IN: $2,100,000,000 worth of #Bitcoin & #Ethereum options expire today.
— wallstreetbets alerts (@wsbalerts) May 17, 2024
For the layperson, a significant amount of cryptocurrency derivative contracts have reached their expiration date on the same day. These options contracts give the holder the right, but not the obligation, to buy or sell a specified amount of Bitcoin or Ethereum at a predetermined price on a future date.
The expiration of such a large amount of options contracts can sometimes lead to increased volatility in the cryptocurrency market. This comes as traders close out their positions or adjust their strategies based on the expiring contracts. It can also impact the overall sentiment and direction of the market in the short term.
Technical analysis: Bitcoin price attempts market structure change above $67,000
Bitcoin price has forayed above the $67,000 level after a series of higher highs on the one-day time frame. After a sequence of lower highs between April 8 and May 9, BTC has overcome the critical threshold of $65,500. If it confirms a candlestick close above the $67,000 level, it would validate a change in market structure.
Typically, a change in market structure is characterized by changes in price behavior, trading volume, volatility and other market dynamics. This shift can be indicative of a transition from one phase to another in terms of market sentiment, investor behavior and market participants' activities.
For BTC, it means a shift from a ranging market to a trending market. Notice the sustained higher lows of the Relative Strength Index (RSI), showing that buyer momentum continues to rise.
The Awesome Oscillator (AO) flipping into positive territory with green histogram bars reinforces this. A green AO signals that the most recent market momentum is bullish. When it is climbing toward positive territory, it suggests that the bullish momentum is strengthening.
A stable close above $67,206 on the one-day time frame would set the pace for a continuation of the climb toward $70,000 psychological level. In a highly bullish case, BTC could flip this threshold into a support floor and use it as the jumping-off point to target the $73,777 all-time high.
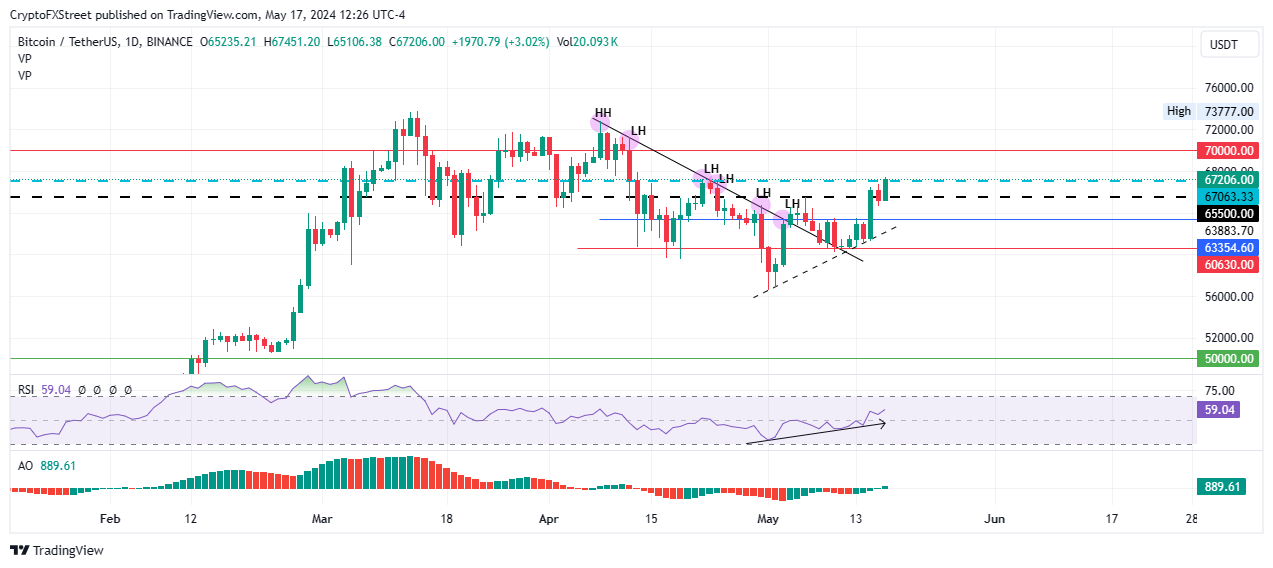
BTC/USDT 1-day chart
On the other hand, a rejection from the $67,000 area could see Bitcoin price retract below $65,500 level. Lower, a key level to watch would be the $63,354 support level. If it fails to hold, late bulls could catch BTC around the $56,000 area, 16% below current levels.
Bitcoin, altcoins, stablecoins FAQs
Bitcoin is the largest cryptocurrency by market capitalization, a virtual currency designed to serve as money. This form of payment cannot be controlled by any one person, group, or entity, which eliminates the need for third-party participation during financial transactions.
Altcoins are any cryptocurrency apart from Bitcoin, but some also regard Ethereum as a non-altcoin because it is from these two cryptocurrencies that forking happens. If this is true, then Litecoin is the first altcoin, forked from the Bitcoin protocol and, therefore, an “improved” version of it.
Stablecoins are cryptocurrencies designed to have a stable price, with their value backed by a reserve of the asset it represents. To achieve this, the value of any one stablecoin is pegged to a commodity or financial instrument, such as the US Dollar (USD), with its supply regulated by an algorithm or demand. The main goal of stablecoins is to provide an on/off-ramp for investors willing to trade and invest in cryptocurrencies. Stablecoins also allow investors to store value since cryptocurrencies, in general, are subject to volatility.
Bitcoin dominance is the ratio of Bitcoin's market capitalization to the total market capitalization of all cryptocurrencies combined. It provides a clear picture of Bitcoin’s interest among investors. A high BTC dominance typically happens before and during a bull run, in which investors resort to investing in relatively stable and high market capitalization cryptocurrency like Bitcoin. A drop in BTC dominance usually means that investors are moving their capital and/or profits to altcoins in a quest for higher returns, which usually triggers an explosion of altcoin rallies.
Recommended Articles


