

LINK price jumps 10% as Chainlink races toward tokenization of funds

Source Fxstreet
  • Chainlink network has completed tests with US banking giants to accelerate the tokenization of funds.
  • JPMorgan, Franklin Templeton, Invesco, and BNY Mellon are among the ten participating firms.
  • Network cofounder Sergey Nazarov says large market players are coming together to leverage blockchains, smart contracts, and Oracle networks.
  • Chainlink price is up 10% as LINK bulls flock to the scene

Chainlink (LINK) price has remained range-bound for a while, stuck between the $16.00 roadblock to the upside and $13.08 to the downside. However, in light of recent revelations, the token, which powers the verifiable web of the decentralized computing platform, may have further upside potential.

Also Read: Chainlink co-founder expects ETF narrative to play into other coins

Chainlink finalizes tests with DTCC and US banking giants

In its pursuit to accelerate the tokenization of funds, the Chainlink network has completed its planned tests with the DTCC and ten partnering firms. The partnering firms are American Trust Custody, Edward Jones, JPMorgan, American Century Investments, Franklin Templeton, MFS, US Bank, BNY Mellon, Invesco, and State Street.

The test reiterated the ability of Chainlink’s Cross Chain Interoperability Protocol (CCIP) to serve as an abstraction layer between the DTCC and the many blockchains needed for integration now and in the future.

In an interview, Chainlink co-founder Sergey Nazarov says that this test is important, showing “large market participants are coming together to use blockchains, smart contracts, and Oracle networks together to solve very tangible immediate problems.”

Chainlink price is up 10% in the past 24 hours, riding the wave of this news as well as the broader bullish sentiment as Bitcoin price remains above $65,500. With the Relative Strength Index (RSI) sustaining higher lows into the region above the mean level of 50 and the Moving Average Convergence Divergence (MACD) holding above the orange band of its signal line, bullish sentiment is growing in the LINK market.

The yellow nodes or spikes on the volume profile also show that bullish hands are currently interacting with the Link price, which could steer further upside potential. If the LINK bulls are able to push the Chainlink price above the $16.863 resistance level, a flip of this roadblock into support will promote more buy orders.

However, LINK would only be attractive to buy after the price records are stable, close to $18.320. In a highly bullish case, the gains could see the Chainlink price extend a neck higher to the $20.702 roadblock.
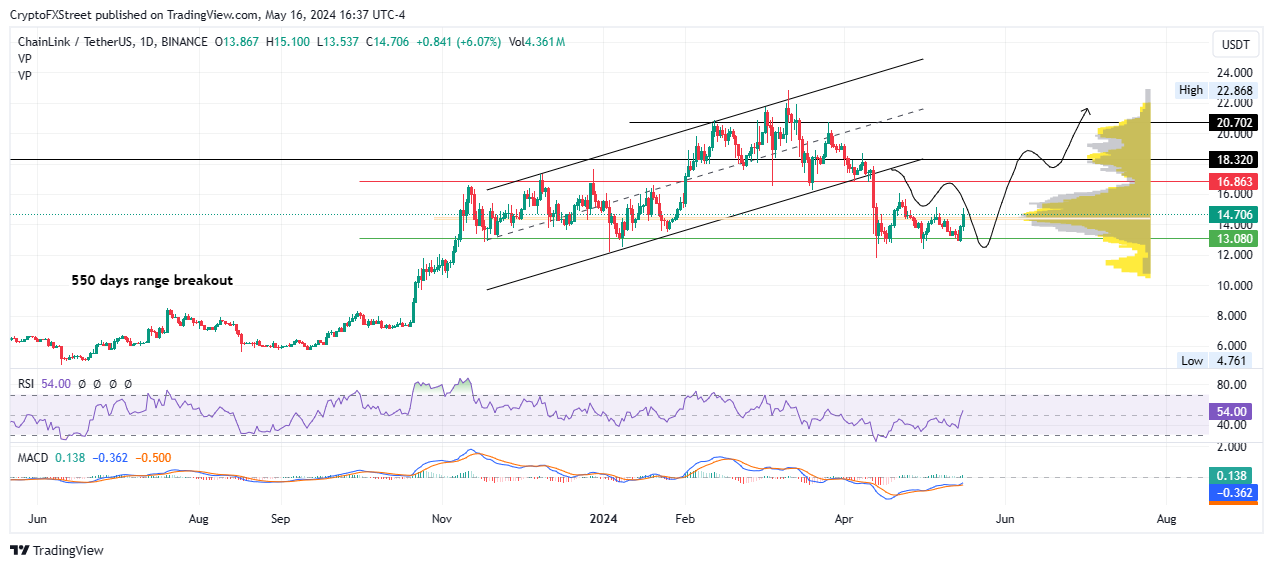
LINK/USDT 1-day chart

Conversely, if traders cash in on the gains made, which has happened multiple times before leading to consolidation, the Chainlink price would topple. While a decisive candlestick close below $13.080 would be concerning,  only a low below the $11.788 support level would invalidate the bullish thesis. 

Disclaimer: For information purposes only. Past performance is not indicative of future results.
placeholder
Nvidia reports tomorrow with an interim CEO — $108 billion is the easy numberNvidia closed at 162.85 on Friday, down 12.75% on the week and 32% below its 6 October record, with market value down to $3.92 trillion. The Q3 bar is $108 billion ±2%, and consensus already sits at $108.7 ~ 108.8 billion, so the revenue line is not where the surprise lives. The number that decides the reaction is the 71 ~ 72% Q4 gross-margin trough, followed by a Q4 guide against a $124.9 billion consensus. This piece prices the print, marks the 158.39 line and lays out the three scenarios in a table.
Author  Irene Q.
Yesterday 02: 11
Nvidia closed at 162.85 on Friday, down 12.75% on the week and 32% below its 6 October record, with market value down to $3.92 trillion. The Q3 bar is $108 billion ±2%, and consensus already sits at $108.7 ~ 108.8 billion, so the revenue line is not where the surprise lives. The number that decides the reaction is the 71 ~ 72% Q4 gross-margin trough, followed by a Q4 guide against a $124.9 billion consensus. This piece prices the print, marks the 158.39 line and lays out the three scenarios in a table.
placeholder
Anthropic is six times oversubscribed at $1.4 trillion while Nvidia is down 32% — the AI trade has two pricesAnthropic lists on Nasdaq as ANT on Thursday at $70 ~ $78 a share, raising up to $64.4 billion at a target valuation near $1.4 trillion, and the book is reportedly six times covered. In the same six weeks, Nvidia has fallen 32% and the QQQ is 10.9% below its October peak. Private capital and public markets are marking the same AI complex at two very different prices. This piece separates the two books: what the S-1 shows, who is anchoring the $26 billion private placement, and what Thursday's debut would have to do to change the public tape.
Author  Irene Q.
Yesterday 02: 27
Anthropic lists on Nasdaq as ANT on Thursday at $70 ~ $78 a share, raising up to $64.4 billion at a target valuation near $1.4 trillion, and the book is reportedly six times covered. In the same six weeks, Nvidia has fallen 32% and the QQQ is 10.9% below its October peak. Private capital and public markets are marking the same AI complex at two very different prices. This piece separates the two books: what the S-1 shows, who is anchoring the $26 billion private placement, and what Thursday's debut would have to do to change the public tape.
placeholder
Weekly Report: The index rose 2.5% while Nvidia fell 12.7% — two equity divergences, one should closeThe S&P 500 rose 2.51% to 7,561.67 and the QQQ rose 3.63% to 679.89 last week, while Nvidia fell 12.75% to 162.85 — a sixth straight weekly loss and 32% below its October record. In the same five sessions, energy equities rose 5.42% while WTI fell 2.52%. Both pairs normally move together (60-day correlations of +0.64 and +0.58). This report ranks which divergence closes first, with the trigger for each.
Author  Irene Q.
Yesterday 02: 35
The S&P 500 rose 2.51% to 7,561.67 and the QQQ rose 3.63% to 679.89 last week, while Nvidia fell 12.75% to 162.85 — a sixth straight weekly loss and 32% below its October record. In the same five sessions, energy equities rose 5.42% while WTI fell 2.52%. Both pairs normally move together (60-day correlations of +0.64 and +0.58). This report ranks which divergence closes first, with the trigger for each.
placeholder
Gold Price Analysis Today | Forex Gold Analysis | XAU/USD Analysis - November 16, 2026Get the latest gold price analysis, forex gold insights, and XAU/USD analysis for November 16, 2026. Read on for the details.
Author  Mitrade
Yesterday 02: 45
Get the latest gold price analysis, forex gold insights, and XAU/USD analysis for November 16, 2026. Read on for the details.
placeholder
Weekly Report: DXY 103.41, 10-year 5.15%, AUD carry 3bp — three FX regimes flipped in one weekThe dollar index rose 1.09% to 103.41, a 19-month high, while the US 10-year closed at 5.154% and the Australia-US two-year spread collapsed to about 3 basis points from 36. EURUSD fell 1.59% to 1.1024, USDJPY rose 1.51% to 159.78 and AUDUSD fell 1.79% to 0.6764, a 10-month low. Three FX regimes — the broad dollar, the US rate level and the Australian carry premium — flipped in the same week. This report marks the thresholds, ranks which one can flip back first, and lists the week's calendar.
Author  Irene Q.
23 hours ago
The dollar index rose 1.09% to 103.41, a 19-month high, while the US 10-year closed at 5.154% and the Australia-US two-year spread collapsed to about 3 basis points from 36. EURUSD fell 1.59% to 1.1024, USDJPY rose 1.51% to 159.78 and AUDUSD fell 1.79% to 0.6764, a 10-month low. Three FX regimes — the broad dollar, the US rate level and the Australian carry premium — flipped in the same week. This report marks the thresholds, ranks which one can flip back first, and lists the week's calendar.
Related Instrument
goTop
quote