


Top 3 Price Prediction Bitcoin, Ethereum, Ripple: Altcoins rescued as BTC acts on CPI data
- Bitcoin price could achieve a market structure change toward further upside if BTC holds stable above $65,500.
- Ethereum defends $2,900, but 26% upside potential will only be activated after breaching $3,212.
- Ripple price’s RSI must record a stable higher high above mean level of 50 for XRP to become attractive.
Bitcoin (BTC) price rescued altcoins on Wednesday following US inflation data, which was measured by determining change in the Consumer Price Index (CPI). Like the core CPI, the CPI came in cooler than previous months at 3.4%.
❖ U.S CPI (MOM) (APR) ACTUAL: 0.3% VS 0.4% PREVIOUS; EST 0.4%
— *Walter Bloomberg (@DeItaone) May 15, 2024
❖ U.S CPI (YOY) (APR) ACTUAL: 3.4% VS 3.5% PREVIOUS; EST 3.4%
❖ U.S CORE CPI (MOM) (APR) ACTUAL: 0.3% VS 0.4% PREVIOUS; EST 0.3%
❖ U.S CORE CPI (YOY) (APR) ACTUAL: 3.6% VS 3.8% PREVIOUS; EST 3.6%
Markets like this so far with yields falling as well as the US Dollar (USD). Cryptocurrency assets moved higher, which means the data release was a much-needed catalyst.
Also Read: Bitcoin price restores early May highs as US CPI surprises to downside
Bitcoin price is a fraction away from market structure change
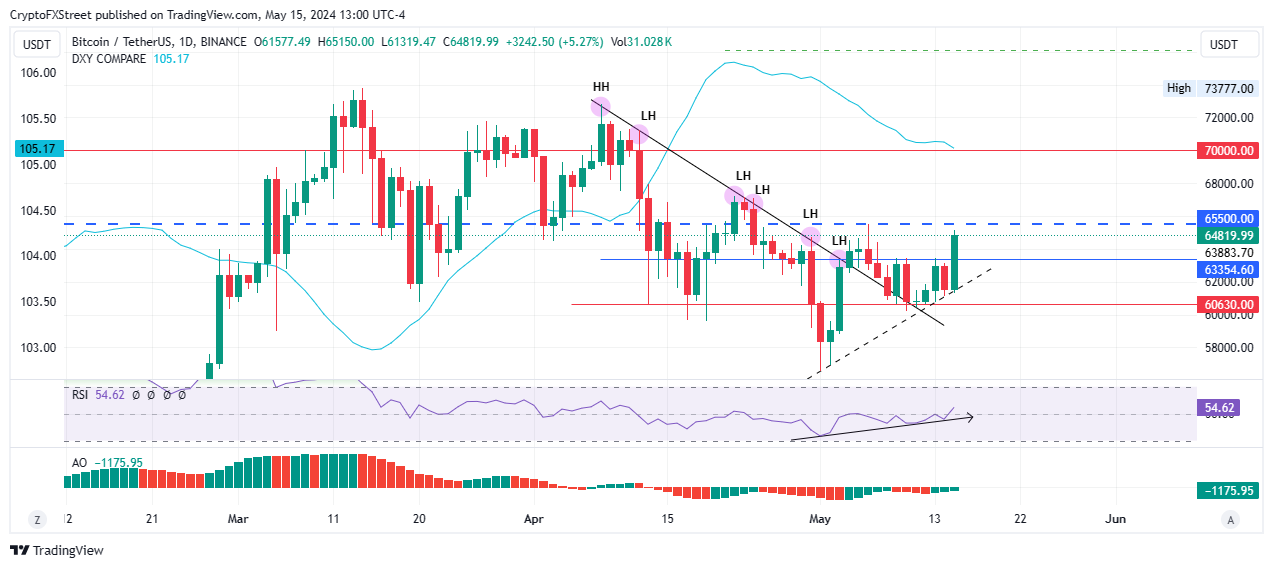
Bitcoin price is trading with a bullish bias, gliding along an ascending trendline with higher highs. After a sequence of lower highs, BTC could change the market structure if it manages a stable close above the $65,500 resistance level.
This is likely, provided BTC holders keep their profit appetite in check and buyer momentum increases. The higher lows on the Relative Strength Index (RSI) show a growing bullish trend. Traders looking to enter long positions for BTC may consider waiting for a higher reading on the RSI.
A stable close above $65,500 on the one-day time frame would encourage more buy orders, with the ensuing buying pressure sending Bitcoin price to $70,000. Beyond this level, BTC would have a chance at taking back the $73,777 peak. Notably, the DXY Compare indicator is also dropping, which has often displayed a countercurrent flow against BTC price.
BTC/USDT 1-day chart
Conversely, if traders book profits for the Wednesday god candle, Bitcoin price could drop. A slip below $63,354 would spook panic sellers like it did on two recent occasions, May 9 and 13, where BTC was rejected from the aforementioned level.
In a dire case, Bitcoin price could descend below the ascending trendline and ultimately fall below the $60,630 support level. Below this level, BTC could roll over to $58,000, or worse, $56,552, levels last tested on May 1.
Also Read: Will GameStop stock resurgence have downstream effect on BTC and alts?
$3,212 level is critical for Ethereum price’s upside potential
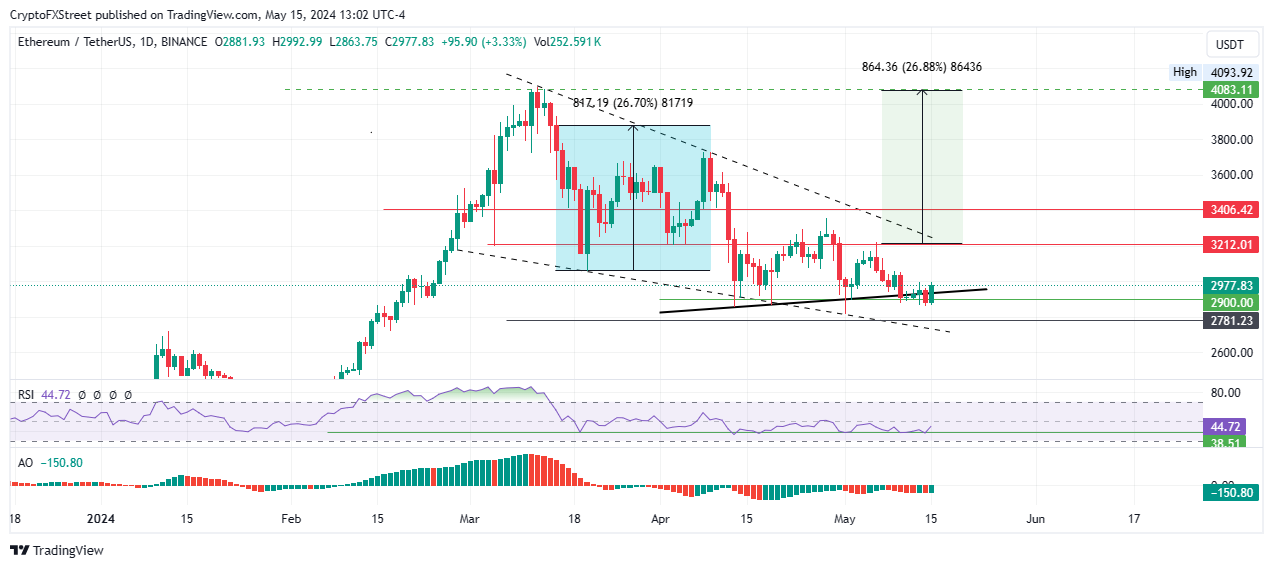
Ethereum price is attempting to reclaim ground above the ascending trendline after a slip below on Tuesday. The governing chart pattern is a falling wedge, which is a bullish reversal technical formation. For the 26% target objective to be realized, however, ETH must manage a candlestick close above $3,212.
ETH/USDT 1-day chart
On the other hand, increased seller momentum could see Ethereum price drop. If the slump extends to close below $2,781, it would invalidate the bullish thesis.
Notably, the RSI continues to chop sideways with equal lows as it remains subdued below the mean level of 50. This shows the bears still have the upper hand.
Also Read: Ethereum faces key resistance in attempt at short-term bull run, Solana flips ETH Mainnet in terms of revenue
XRP bulls sitting on their hands
Ripple price remains range-bound as XRP bulls continue to sit on their hands. This is seen with the RSI stuck below the mean level of 50 since April 11. If the RSI records a higher high within the upper segment of the range, Ripple price could extend the climb.
In the meantime, Ripple price is likely to consolidate along the 50% Fibonacci placeholder of $0.4952, with the horizontal chop likely to continue.

XRP/USDT 1-day chart
Conversely, enhanced profit-booking could see Ripple price wipe out the ground covered, slipping below $0.4952. In a dire case, XRP price could extend the fall to $0.4500, or worse, extend a leg down to $0.4188, levels last tested on April 13.
Also Read: XRP holds gains as attorneys debate relevance of discounts offered to Ripple’s institutional clients
Bitcoin, altcoins, stablecoins FAQs
Bitcoin is the largest cryptocurrency by market capitalization, a virtual currency designed to serve as money. This form of payment cannot be controlled by any one person, group, or entity, which eliminates the need for third-party participation during financial transactions.
Altcoins are any cryptocurrency apart from Bitcoin, but some also regard Ethereum as a non-altcoin because it is from these two cryptocurrencies that forking happens. If this is true, then Litecoin is the first altcoin, forked from the Bitcoin protocol and, therefore, an “improved” version of it.
Stablecoins are cryptocurrencies designed to have a stable price, with their value backed by a reserve of the asset it represents. To achieve this, the value of any one stablecoin is pegged to a commodity or financial instrument, such as the US Dollar (USD), with its supply regulated by an algorithm or demand. The main goal of stablecoins is to provide an on/off-ramp for investors willing to trade and invest in cryptocurrencies. Stablecoins also allow investors to store value since cryptocurrencies, in general, are subject to volatility.
Bitcoin dominance is the ratio of Bitcoin's market capitalization to the total market capitalization of all cryptocurrencies combined. It provides a clear picture of Bitcoin’s interest among investors. A high BTC dominance typically happens before and during a bull run, in which investors resort to investing in relatively stable and high market capitalization cryptocurrency like Bitcoin. A drop in BTC dominance usually means that investors are moving their capital and/or profits to altcoins in a quest for higher returns, which usually triggers an explosion of altcoin rallies.
Recommended Articles


