


Top 3 Price Prediction Bitcoin, Ethereum, Ripple: Altcoins thresh as BTC conceals directional bias
- Bitcoin price could reverse current market structure if bulls manage a stable candlestick close above $65,500.
- Ethereum price’s 26% upside potential under threat as ETH tests $2,900 support.
- XRP provides another buying opportunity at $0.50 as Ripple price plunges almost 10% in a week.
Bitcoin (BTC) price continues to conceal its hand on higher time frames with the stance compelling altcoins to pick a side. Altcoins with bullish fundamentals continue to show short-term strength, whereas those devoid of any continue to bleed. The fate of altcoins hinges on BTC with a show of stability likely to kickstart a rally for Ethereum (ETH) and Ripple (XRP) prices.
Also Read: Crypto market eyes a bullish turnaround
Bitcoin price attempts market structure reversal
Bitcoin price is trading with a bullish bias on the H4 time frame, consolidating along an ascending trendline. The Relative Strength Index (RSI) has managed a few higher highs, suggesting a growing bullish trend.
However, for the current market structure to change, the bulls must manage to push BTC beyond $65,500 and maintain a stable candlestick above it on the four-hour chart. Such a move would pave the way for an extension to the $72,797 threshold, beyond which the $73,777 all-time high would be ripe for retaking.
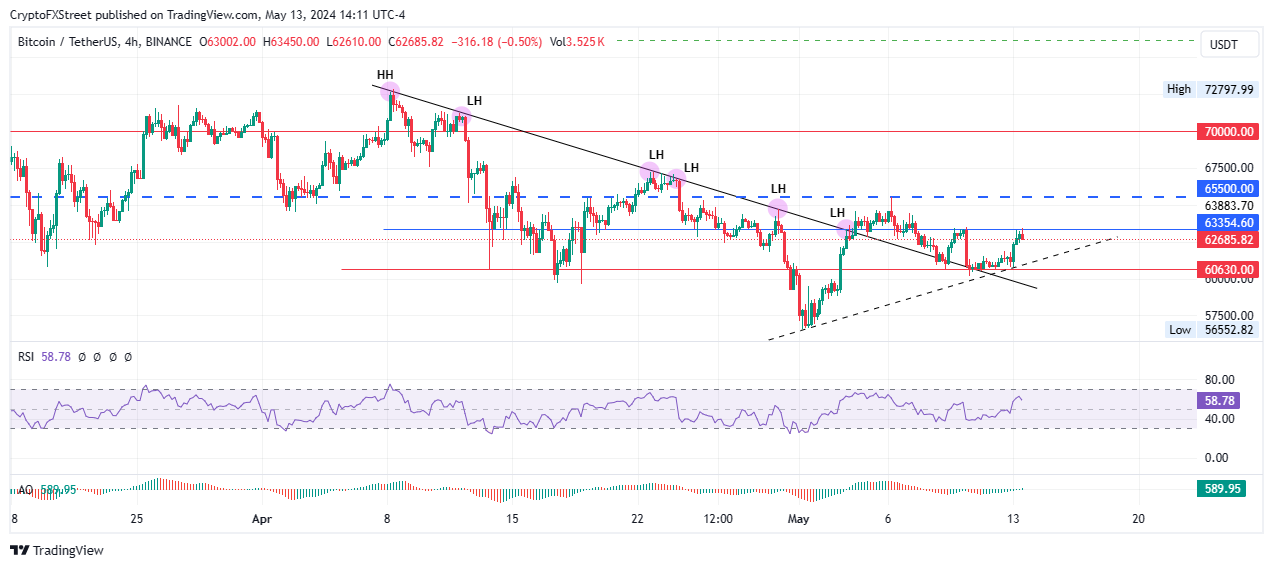
BTC/USDT 4-hour chart
Conversely, if the bears have their way, Bitcoin price could drop, slipping below the support confluence between the ascending trendline and the horizontal line at $60,630. In a dire case where BTC rolls below the $60,000 psychological level, it would trigger panic selling. This could send Bitcoin price all the way to the $56,552 support level before a potential recovery.
Also Read: Bitcoin price attempts recovery after weeklong downtrend as mainland China wants in on Hong Kong spot BTC ETF
Ethereum price’s 26% target objective could fall through
Ethereum price consolidation within a falling wedge pattern continues as the bullish reversal technical formation signals a possible 26% target objective. However, with BTC concealing its directional bias, this potential weakens.
Notably, Ethereum price has slipped below the ascending trendline, worsened by the equal lows on the RSI. If the RSI support breaks, ETH could fall through, recording a lower low and extending the downtrend below the $2,900 threshold.
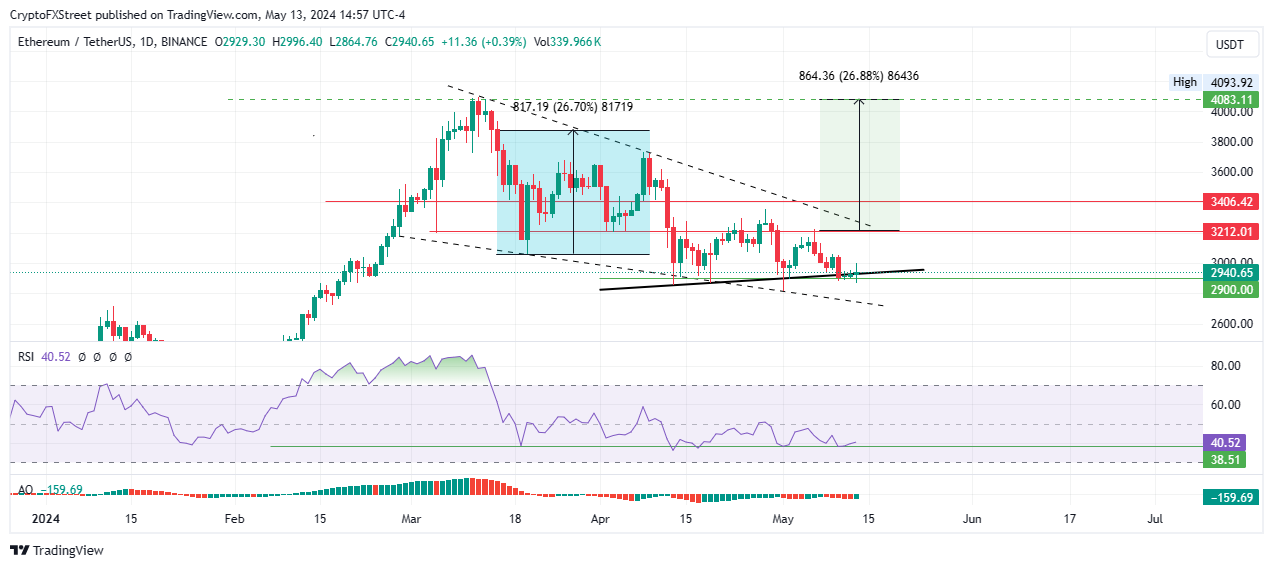
ETH/USDT 1-day chart
On the other hand, enhanced buyer momentum above current levels could see Ethereum price break above the $3,212 resistance level. A stable close above this level on the one-day time frame would activate the breakout, potentially sending ETH 26% north to $4,083.
Also Read: Ethereum could see slight increase, institutional whales make hefty deposits on Coinbase.
XRP bulls have another buying opportunity
Ripple price has tested the 50% Fibonacci placeholder for yet another time. But not all hope is lost as XRP tests the support due to the 50% Fibonacci placeholder at $0.4952. If this support level holds, the XRP price could climb 12% to take back the $0.5703 resistance level.
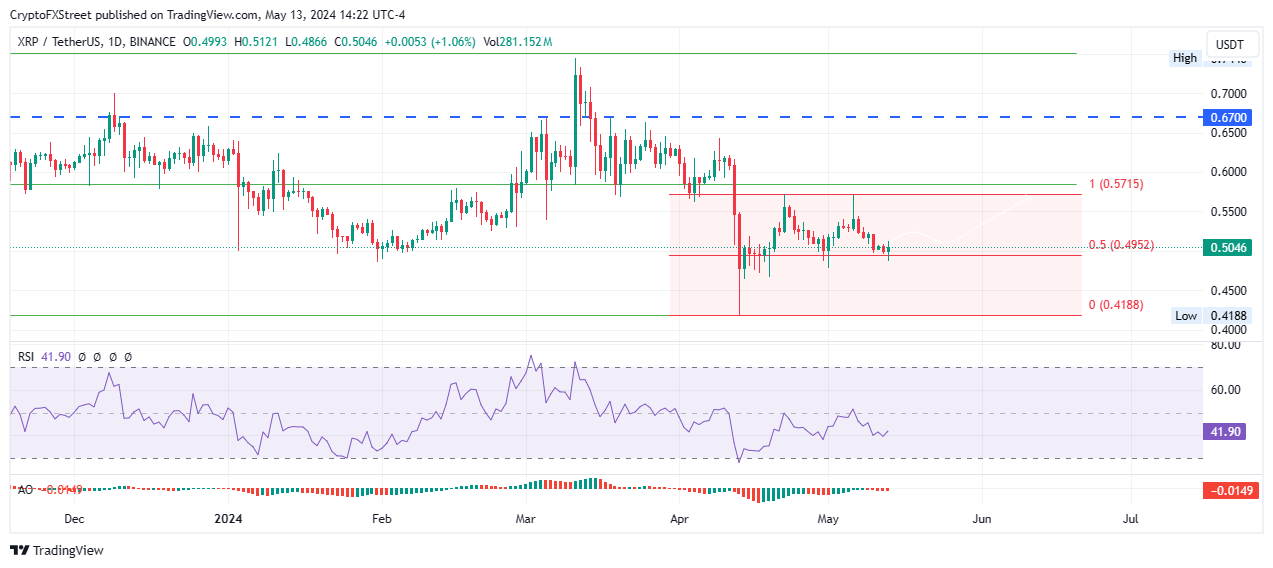
XRP/USDT 1-day chart
Conversely, if the $0.4952 support breaks, Ripple price could extend the fall to $0.4500, or in a dire case extend a leg south to $0.4188, levels last tested on April 13.
Also Read: SEC vs. Ripple lawsuit update: All related parties to file letters to seal motions and evidence
Bitcoin, altcoins, stablecoins FAQs
Bitcoin is the largest cryptocurrency by market capitalization, a virtual currency designed to serve as money. This form of payment cannot be controlled by any one person, group, or entity, which eliminates the need for third-party participation during financial transactions.
Altcoins are any cryptocurrency apart from Bitcoin, but some also regard Ethereum as a non-altcoin because it is from these two cryptocurrencies that forking happens. If this is true, then Litecoin is the first altcoin, forked from the Bitcoin protocol and, therefore, an “improved” version of it.
Stablecoins are cryptocurrencies designed to have a stable price, with their value backed by a reserve of the asset it represents. To achieve this, the value of any one stablecoin is pegged to a commodity or financial instrument, such as the US Dollar (USD), with its supply regulated by an algorithm or demand. The main goal of stablecoins is to provide an on/off-ramp for investors willing to trade and invest in cryptocurrencies. Stablecoins also allow investors to store value since cryptocurrencies, in general, are subject to volatility.
Bitcoin dominance is the ratio of Bitcoin's market capitalization to the total market capitalization of all cryptocurrencies combined. It provides a clear picture of Bitcoin’s interest among investors. A high BTC dominance typically happens before and during a bull run, in which investors resort to investing in relatively stable and high market capitalization cryptocurrency like Bitcoin. A drop in BTC dominance usually means that investors are moving their capital and/or profits to altcoins in a quest for higher returns, which usually triggers an explosion of altcoin rallies.
Recommended Articles


