

Could Worldcoin price shoot up 45% ahead of OpenAI’s live stream on Monday?

Source Fxstreet
  • Worldcoin price eyes a quick 45% rally in anticipation of OpenAI’s live stream on Monday.
  • WLD needs to clear $6.70 hurdle before it can climb up to $8.55. 
  • A daily candlestick close below $4.22 support level will invaldiate the bullish thesis for the AI-based token.

Worldcoin (WLD) price has formed a double bottom around a key support level, suggesting a potential accumulation. If the OpenAI’s Monday live stream has a positive impact on Artificial Intelligence (AI) field, it could positively impact WLD and other AI-based tokens. 

Also read: Arkham price primed for a recovery rally ahead of OpenAI’s announcement

Worldcoin price ready to move higher

Worldcoin price has set up a double bottom above the daily support level of $4.22. This technical formation comes after a 70% crash between March 10 and April 13, suggesting a bottomming of the downtrend and a potential reversal.

Worldcoin price has breached the $5.62 and came close to hitting its initial target of $6.70. But due to the overall market conditions, WLD retraced and is currently hovering around $5.62. If Bitcoin (BTC) price climbs higher, altcoins including WLD could see an upthrust that tackles the $6.70 hurdle. 

Considering that the Relative Strength Index (RSI) and Awesome Oscillator (AO) are both bounce off their respective mean levels, overcoming $5.62 could propel Worldcoin price to the next key hurdle of $8.55. In total, this move would consitute a 45% gain for WLD holders. 
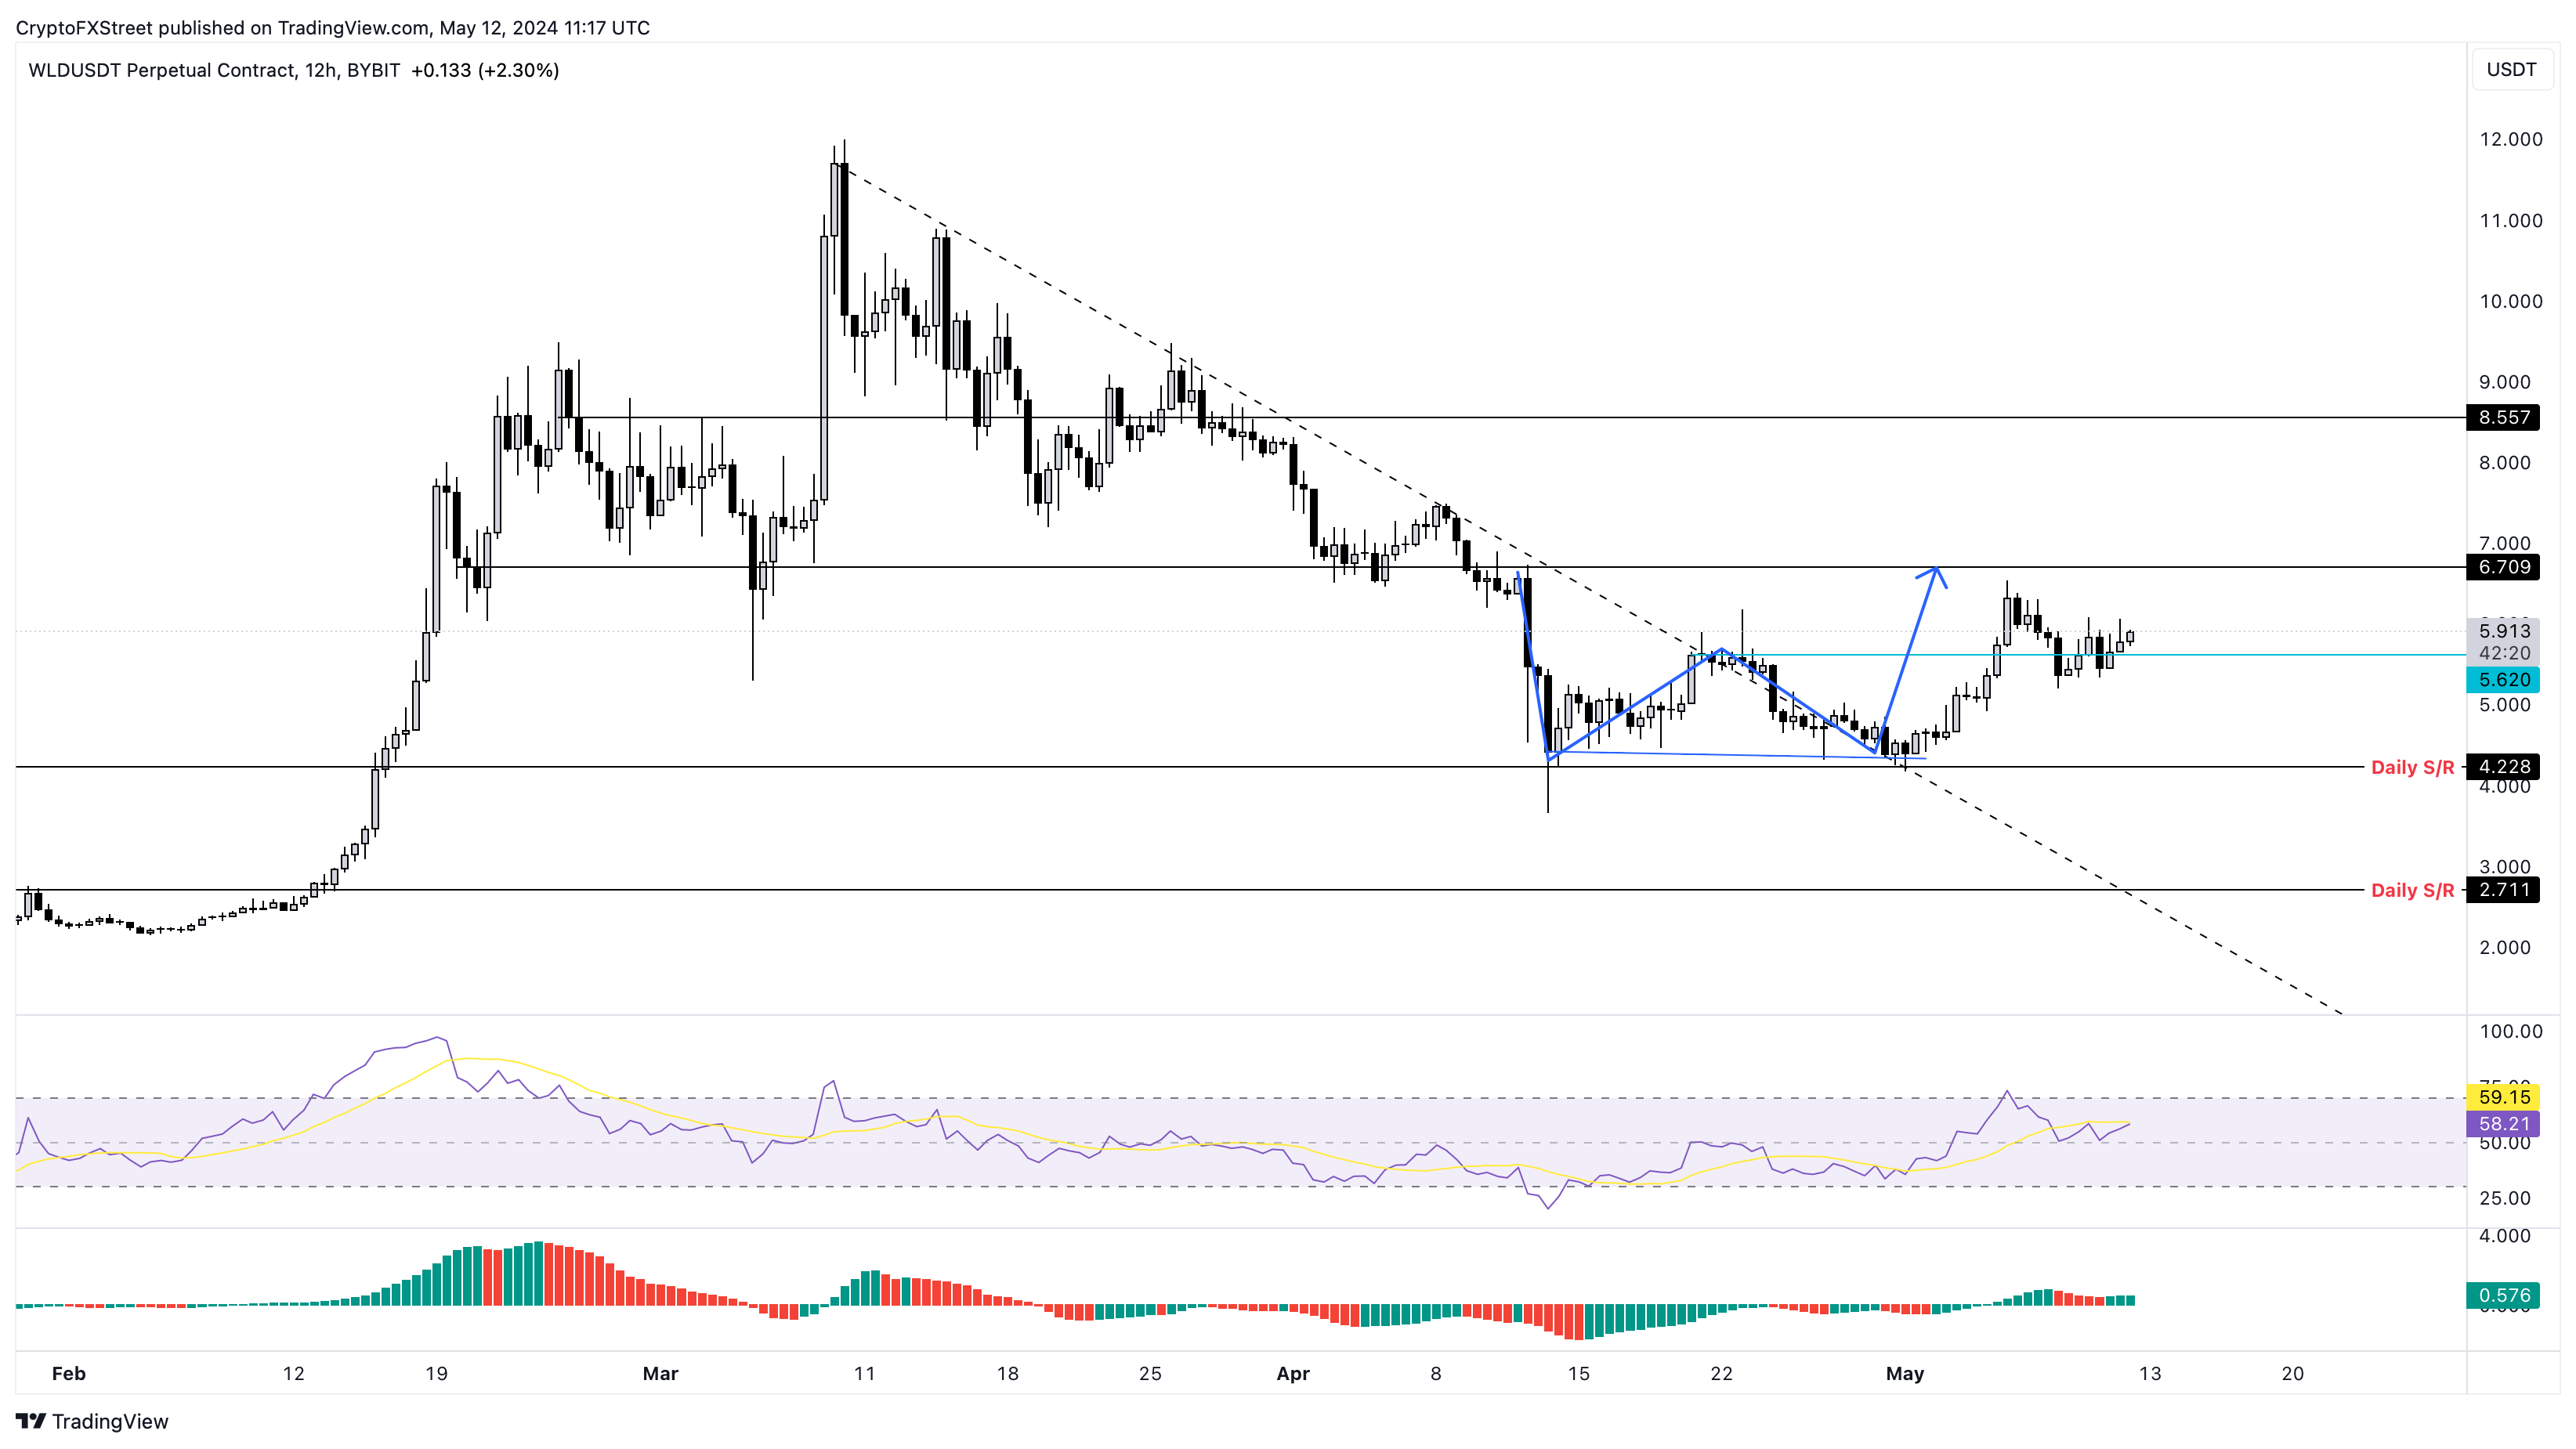
WLD/USDT 12-hour chart

WLD/USDT 12-hour chart

On the contrary, if investors decide that the OpenAI announcement is a not a big deal, it could suck the buying pressure out, causing Worldcoin price to slide lower. If WLD produces a daily candelstick close below $4.22 it would create a lower low and invaldiat the bullish thesis. In such a case, Worldcoin price could crash 35% and revisit the $2.71 support level. 

Read more: Worldcoin’s four buy signals hint at a reversal rally

Disclaimer: For information purposes only. Past performance is not indicative of future results.
placeholder
Anthropic files for a $2 trillion IPO — the $80.7 billion loss is the decoy, the $450 billion compute bill is the riskAnthropic publicly filed its S-1 on October 26, revealing $16.29 billion of first-half revenue (+1,304% year over year) and a $80.7 billion net loss — of which $72.4 billion is a non-cash convertible-note charge. The real number is the $450 billion of signed, mostly non-cancelable compute commitments. Here is what the filing says, why NVDA, ARM and MU are the tradeable read-through, and the conditions that decide whether the AI trade passes its first public valuation test.
Author  Irene Q.
Oct 27, Tue
Anthropic publicly filed its S-1 on October 26, revealing $16.29 billion of first-half revenue (+1,304% year over year) and a $80.7 billion net loss — of which $72.4 billion is a non-cash convertible-note charge. The real number is the $450 billion of signed, mostly non-cancelable compute commitments. Here is what the filing says, why NVDA, ARM and MU are the tradeable read-through, and the conditions that decide whether the AI trade passes its first public valuation test.
placeholder
Brent's $115 front month sits $4.6 above January — the $14 spread to WTI is the supply-risk premiumDecember Brent trades at $115.29 while January is $110.71, a $4.58 backwardation. The December Brent-WTI spread is $14.2, versus a $3-5 normal. That gap, not the headline, is where the Middle East supply risk is priced. Here is what the curve says, why the December contract's expiry on October 30 will mechanically cut the headline by $4.6, and the 108.81 neckline that decides the next move.
Author  Irene Q.
Oct 28, Wed
December Brent trades at $115.29 while January is $110.71, a $4.58 backwardation. The December Brent-WTI spread is $14.2, versus a $3-5 normal. That gap, not the headline, is where the Middle East supply risk is priced. Here is what the curve says, why the December contract's expiry on October 30 will mechanically cut the headline by $4.6, and the 108.81 neckline that decides the next move.
placeholder
Gold Price Analysis Today | Forex Gold Analysis | XAU/USD Analysis - October 29, 2026Get the latest gold price analysis, forex gold insights, and XAU/USD analysis for October 29, 2026. Read on for the details.
Author  Mitrade
Oct 29, Thu
Get the latest gold price analysis, forex gold insights, and XAU/USD analysis for October 29, 2026. Read on for the details.
placeholder
Gold Price Analysis Today | Forex Gold Analysis | XAU/USD Analysis - October 30, 2026Get the latest gold price analysis, forex gold insights, and XAU/USD analysis for October 30, 2026. Read on for the details.
Author  Mitrade
Yesterday 02: 21
Get the latest gold price analysis, forex gold insights, and XAU/USD analysis for October 30, 2026. Read on for the details.
placeholder
US GDP grew 3.4% and core PCE held at 3.1% — December is now a hike trade, not a cut tradeUS Q3 GDP rose 3.4%, above the 3.1% estimate, while September headline PCE hit 3.6% and core held at 3.1%. December hike odds are near 90%; inventories, AI capex and energy explain why.
Author  Irene Q.
Yesterday 07: 12
US Q3 GDP rose 3.4%, above the 3.1% estimate, while September headline PCE hit 3.6% and core held at 3.1%. December hike odds are near 90%; inventories, AI capex and energy explain why.
goTop
quote