

Will TRUMP Holders $70 Million Flash Selling Push Price To Historic Lows?
Official Trump (TRUMP) price is trading at $3.21, down 1.32% on the day, after surrendering nearly all of a 49.65% rally that peaked on March 13.
The token now sits 3.2% above its all-time low of $2.705, and two on-chain signals confirm that sellers remain in control.
TRUMP Coins Hit Exchanges
Exchange balance data from Glassnode shows TRUMP holders sent a wave of tokens to exchanges during the mid-March rally. Balances hovered near 15 million from March 7 to 9, then surged to approximately 41 million by March 14.
That spike of roughly 26 million tokens — deposited at prices near $4 — represents approximately $104 million in sell-side positioning at the peak. Within 24 hours of that peak, balances collapsed back to 19.5 million as selling was absorbed and the price reversed sharply.
Want more token insights like this? Sign up for Editor Harsh Notariya’s Daily Crypto Newsletter here.
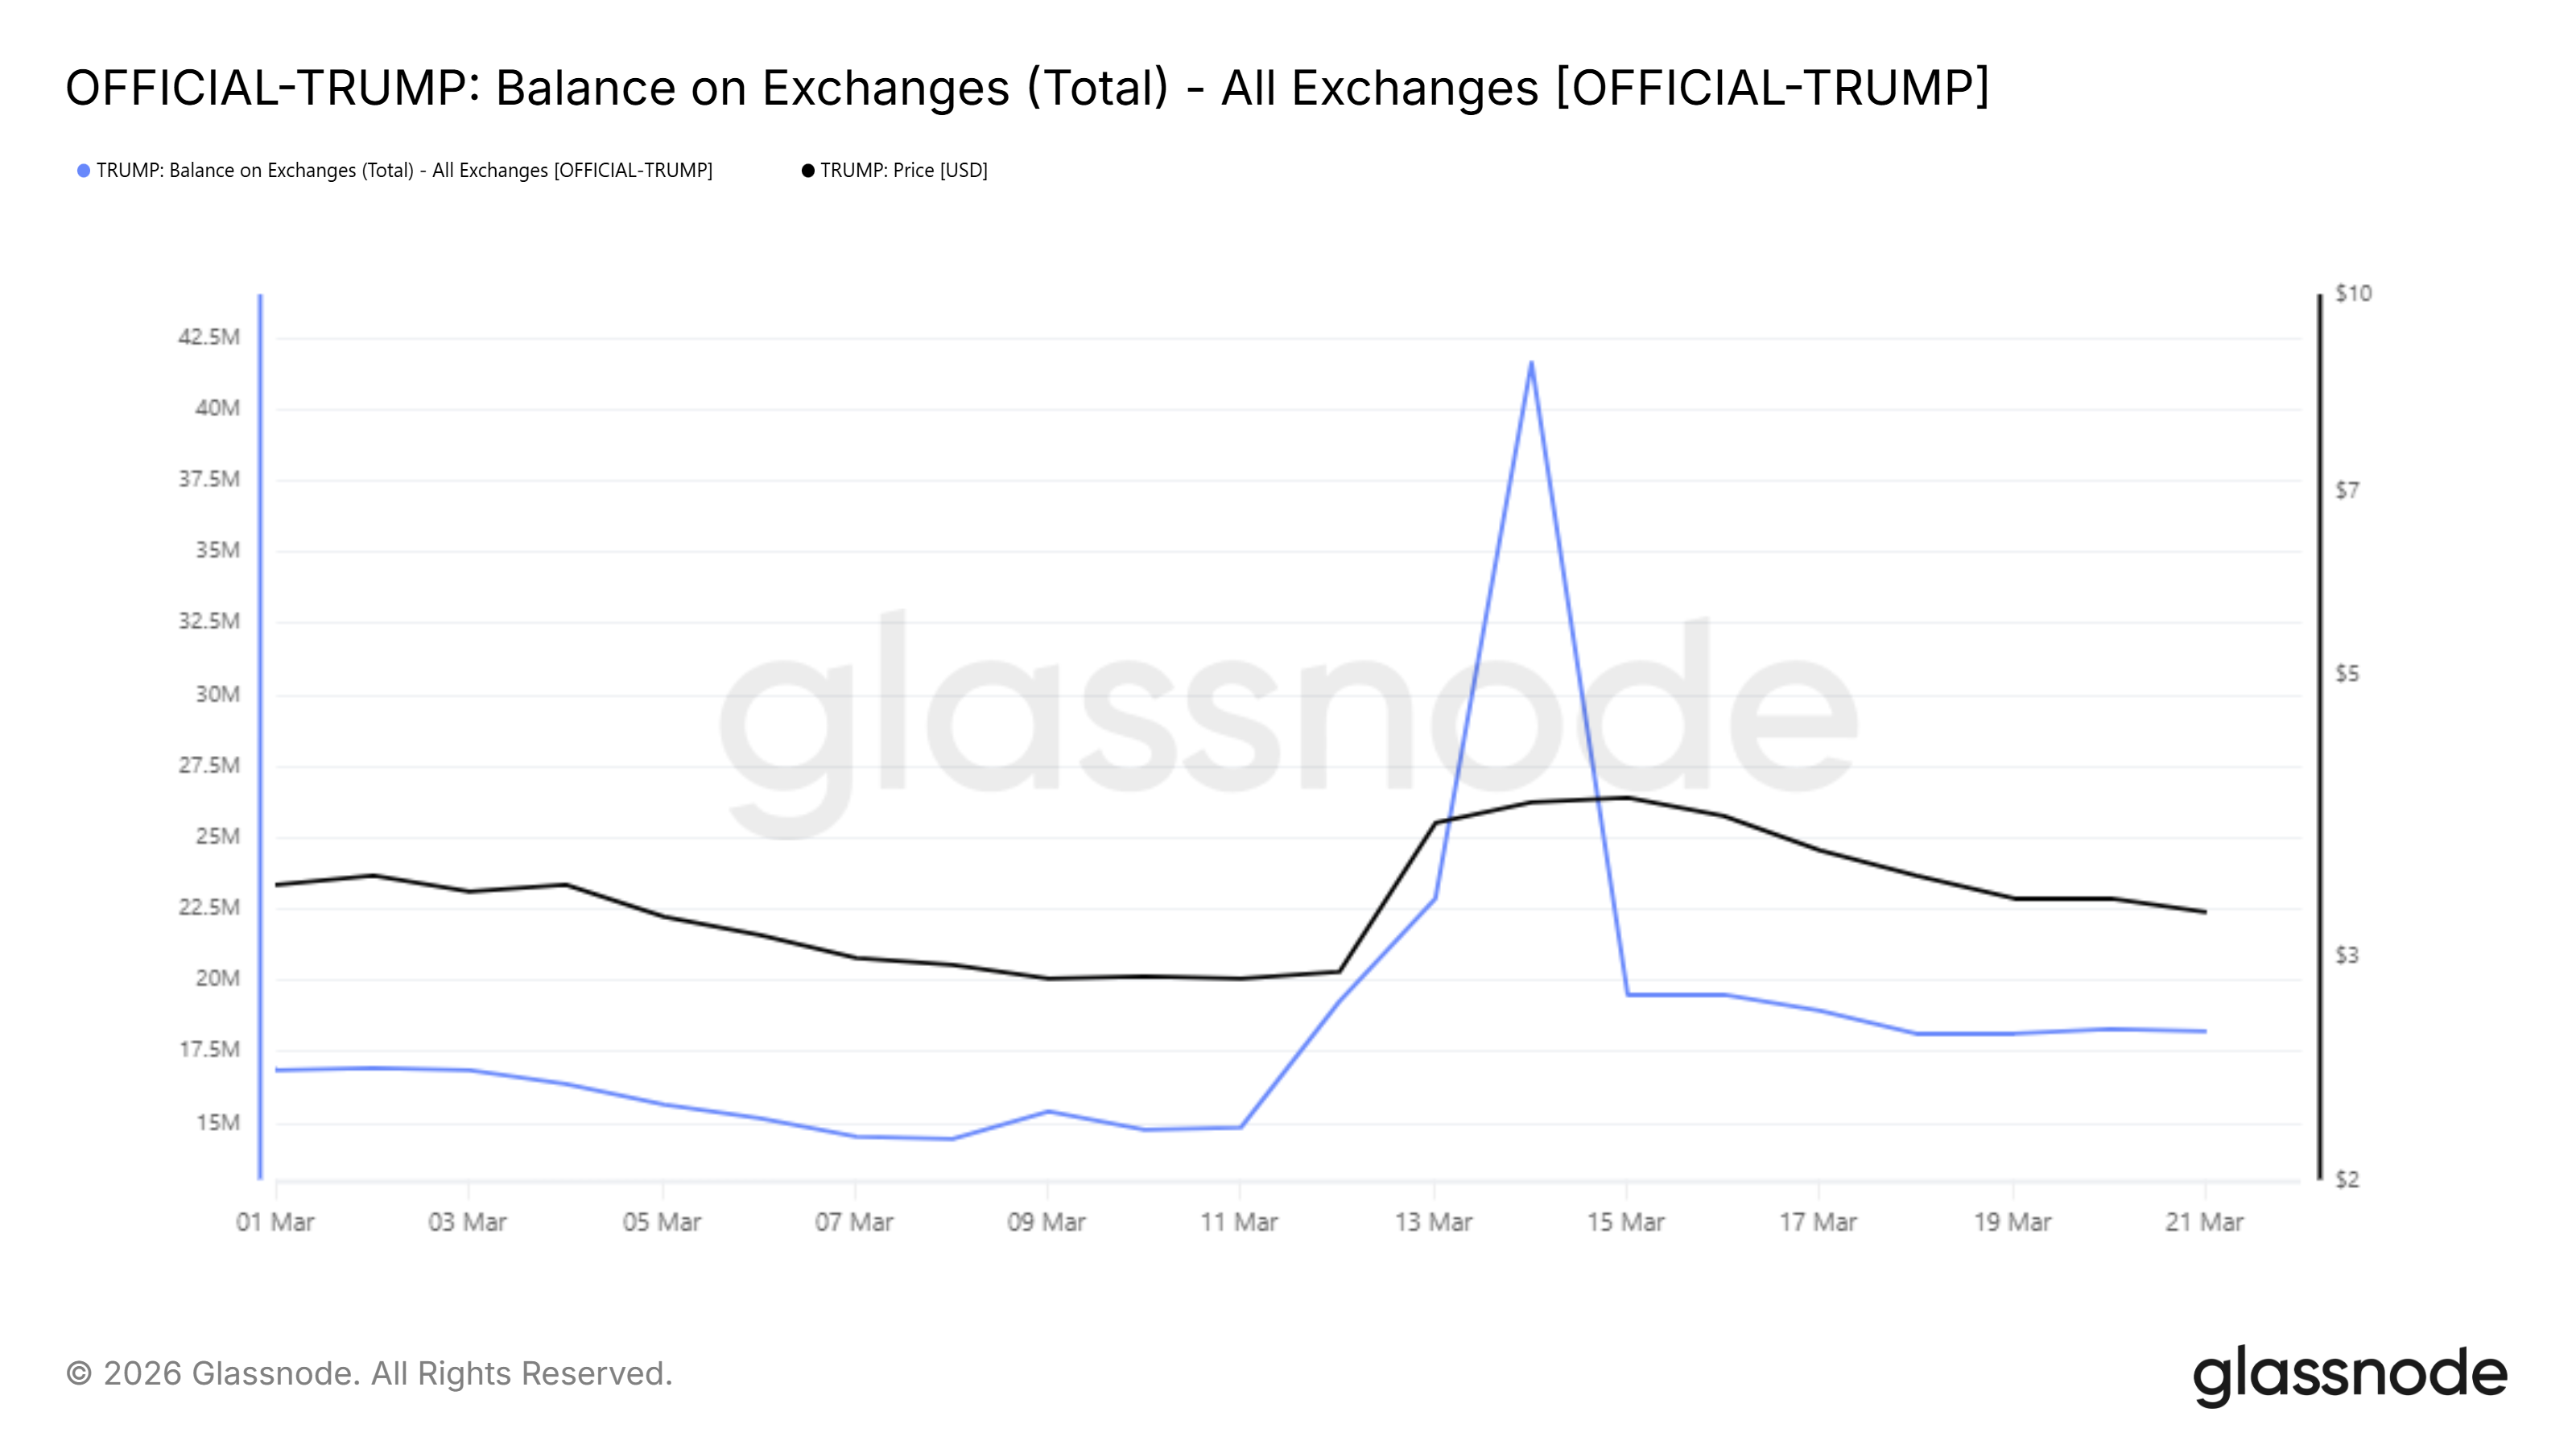 TRUMP Balance On Exchanges. Source: Glassnode
Since March 15, exchange balances have stabilized near 18.5 million. However, that level remains elevated compared to the March lows, suggesting residual sell pressure has not fully cleared.
Money Flow Drops to Second-Lowest Reading Since February
Despite the TRUMP exchange inflow spike, the Chaikin Money Flow (CMF) told the clearest story. The indicator fell to -0.26 in early March before recovering to near zero by March 13 — just as the rally unfolded.
That recovery proved short-lived. The CMF has since dropped back to -0.14, its second-lowest reading since February 19. The indicator has not sustained a positive reading since a brief spike to +0.04 on February 25.
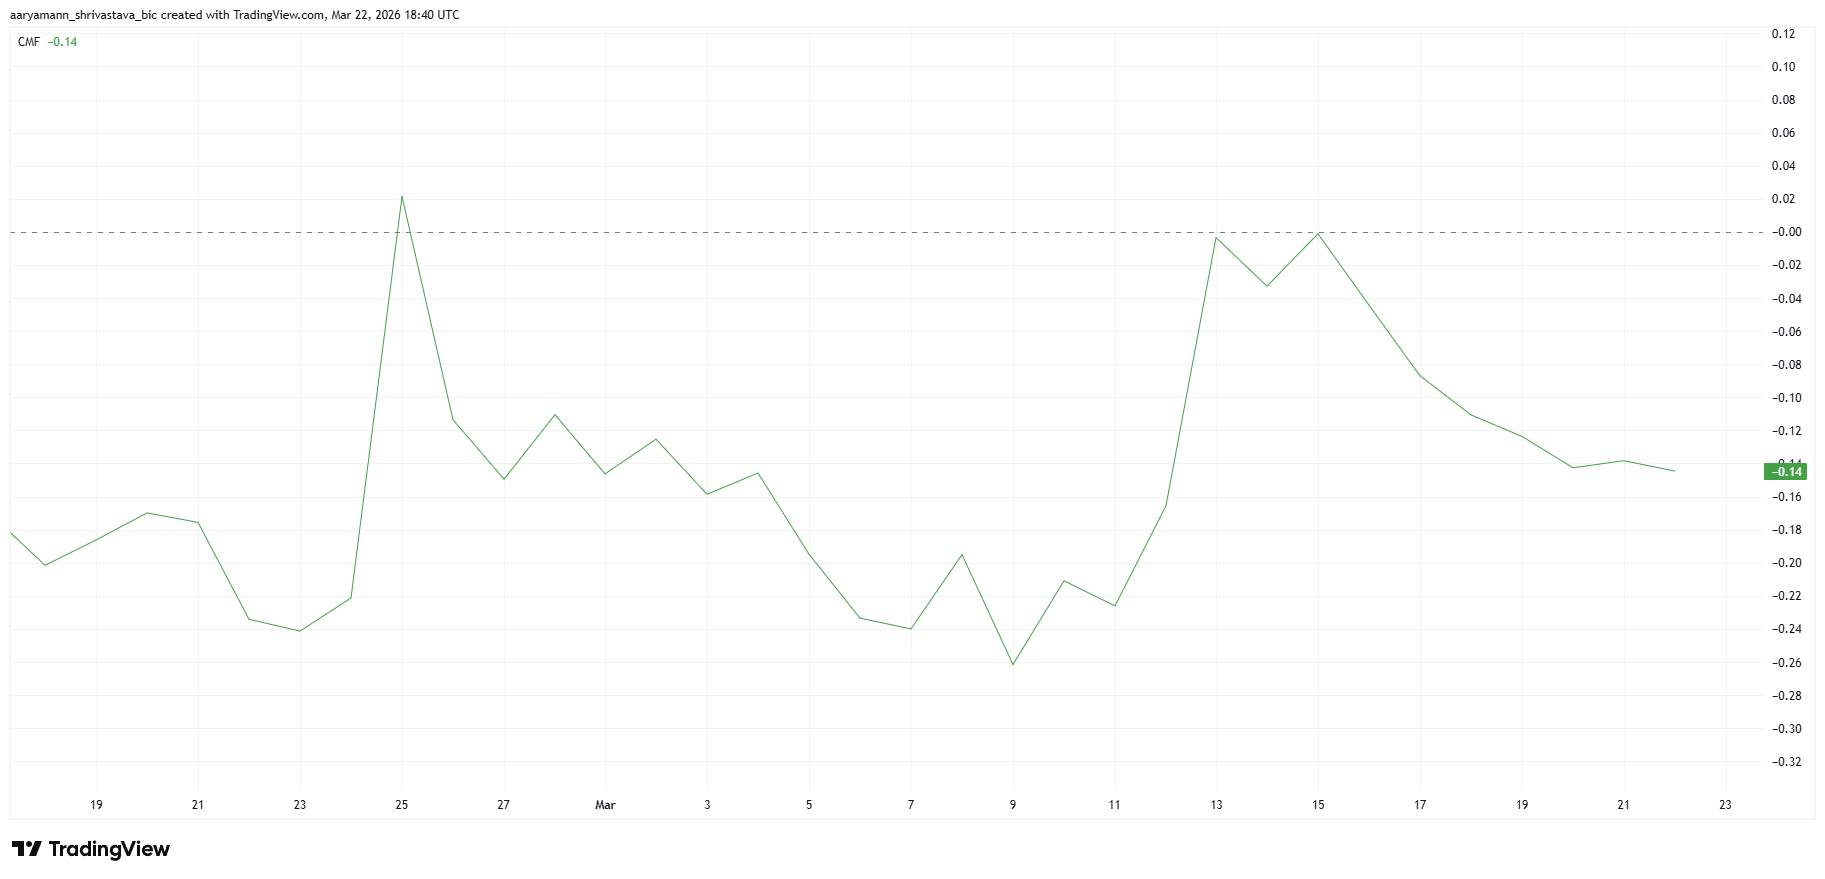 TRUMP CMF. Source: TradingView
A CMF reading of -0.14 indicates significant capital outflow. For selling pressure to ease, the indicator would need to recover above zero and hold — something it has failed to do for nearly a month.
TRUMP Price Forecast: The All-Time Low Is the Next Target
TRUMP price shows a drop of 20.61% from the March 13 peak at roughly $4.04, which has already played out and brought the price to the current $3.21 level. A second annotated measured move projects a further -15.76% decline, targeting approximately $2.71, the all-time low.
Price is trading below the Fibonacci 1.0 extension at $3.309, which now acts as resistance. The 1.236 extension at $2.941 is the next meaningful level before the all-time low at $2.705.
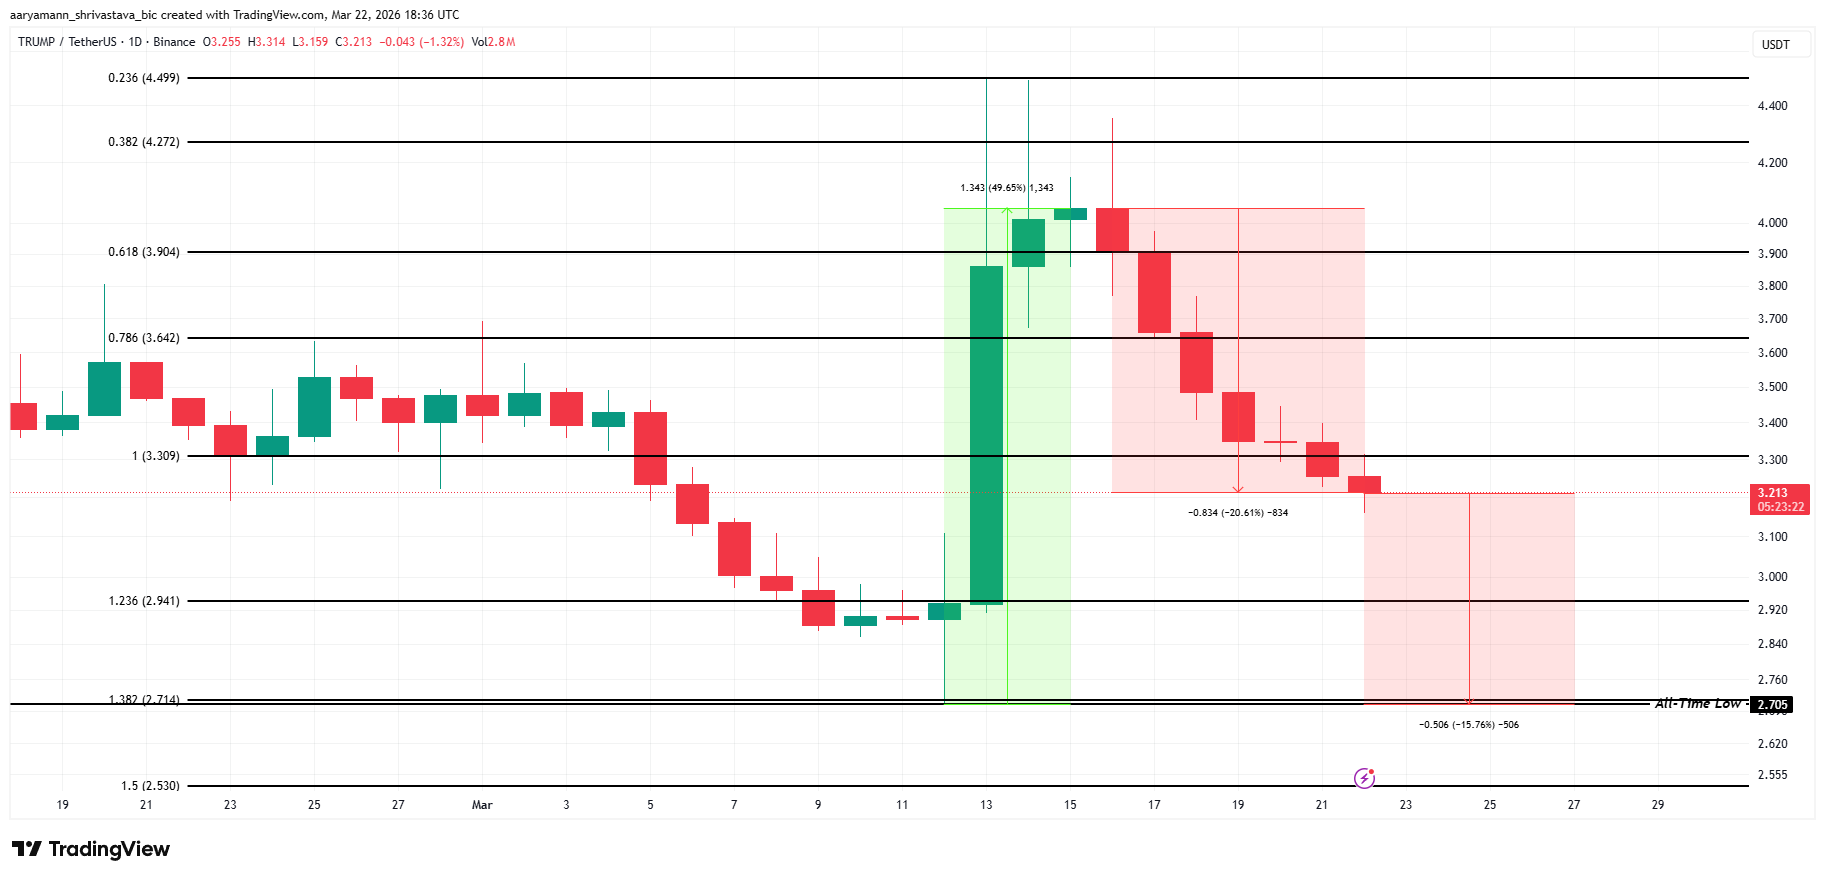 TRUMP Price Analysis. Source: TradingView
A daily close below $3.00 would remove the last psychological floor before the all-time low territory. The Mar-a-Lago gala hosted for token holders in March provided a brief catalyst for the rally, but that event-driven demand has fully faded.
To invalidate the bearish setup, TRUMP buyers would need to reclaim $3.642 — the 0.786 Fibonacci level — on a daily closing basis. Without a new catalyst of similar or greater magnitude, the all-time low at $2.705 is the most structurally significant target remaining.
Recommended Articles


