

HYPE Surges 20% in a Week; Force Behind Rally Now Threatens Reversal
Hyperliquid’s native token HYPE has quietly become one of the strongest performers in the crypto market this week. The token is up roughly 3% today, more than 20% over the past seven days. HYPE price is up nearly 50% year-to-date, outperforming many major cryptocurrencies that have mostly traded sideways.
The rally accelerated after HYPE broke out of a bullish chart structure earlier this month. But a closer look at momentum indicators, exchange flows, and derivatives positioning now suggests that the same force that pushed the rally higher could begin to work in the opposite direction.
HYPE Breaks Bullish Pattern, But Momentum Shows Early Weakness
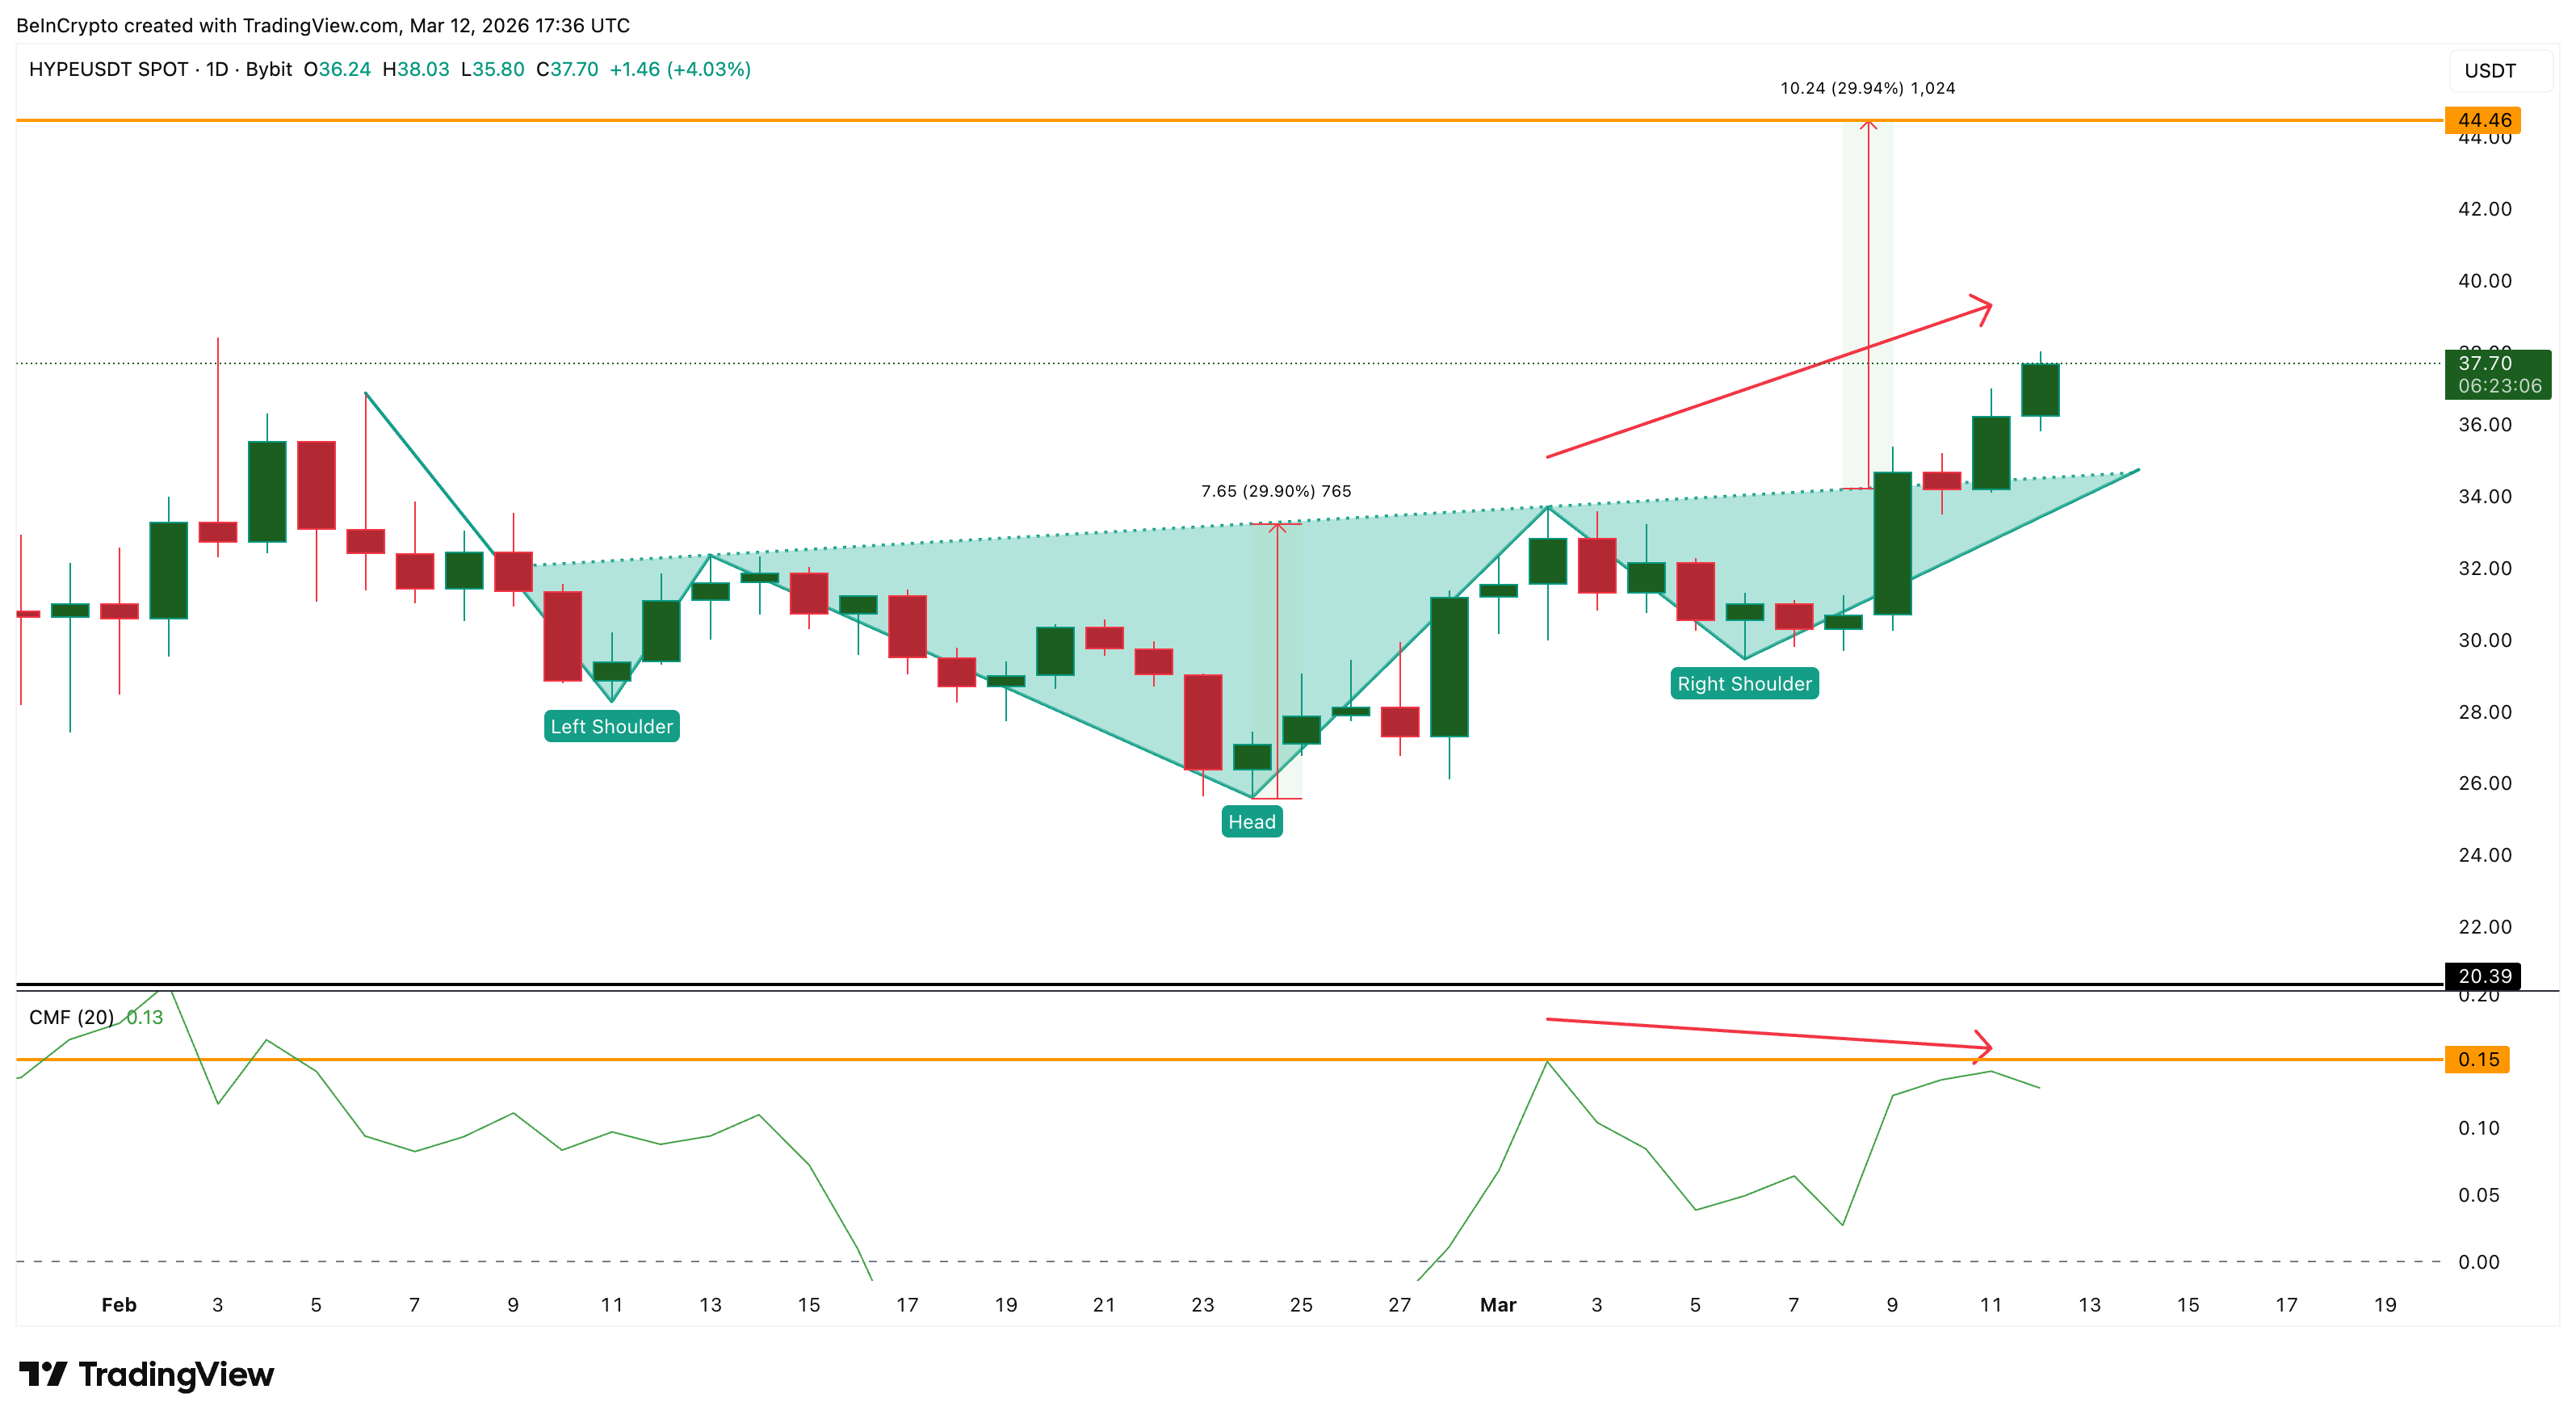
HYPE’s recent rally began after the token broke above the neckline of an inverse head-and-shoulders pattern on March 9.
Based on the height of the pattern, the breakout points to a theoretical upside target near $44, representing roughly 30% upside from the neckline level if the rally continues.
Want more token insights like this? Sign up for Editor Harsh Notariya’s Daily Crypto Newsletter here.
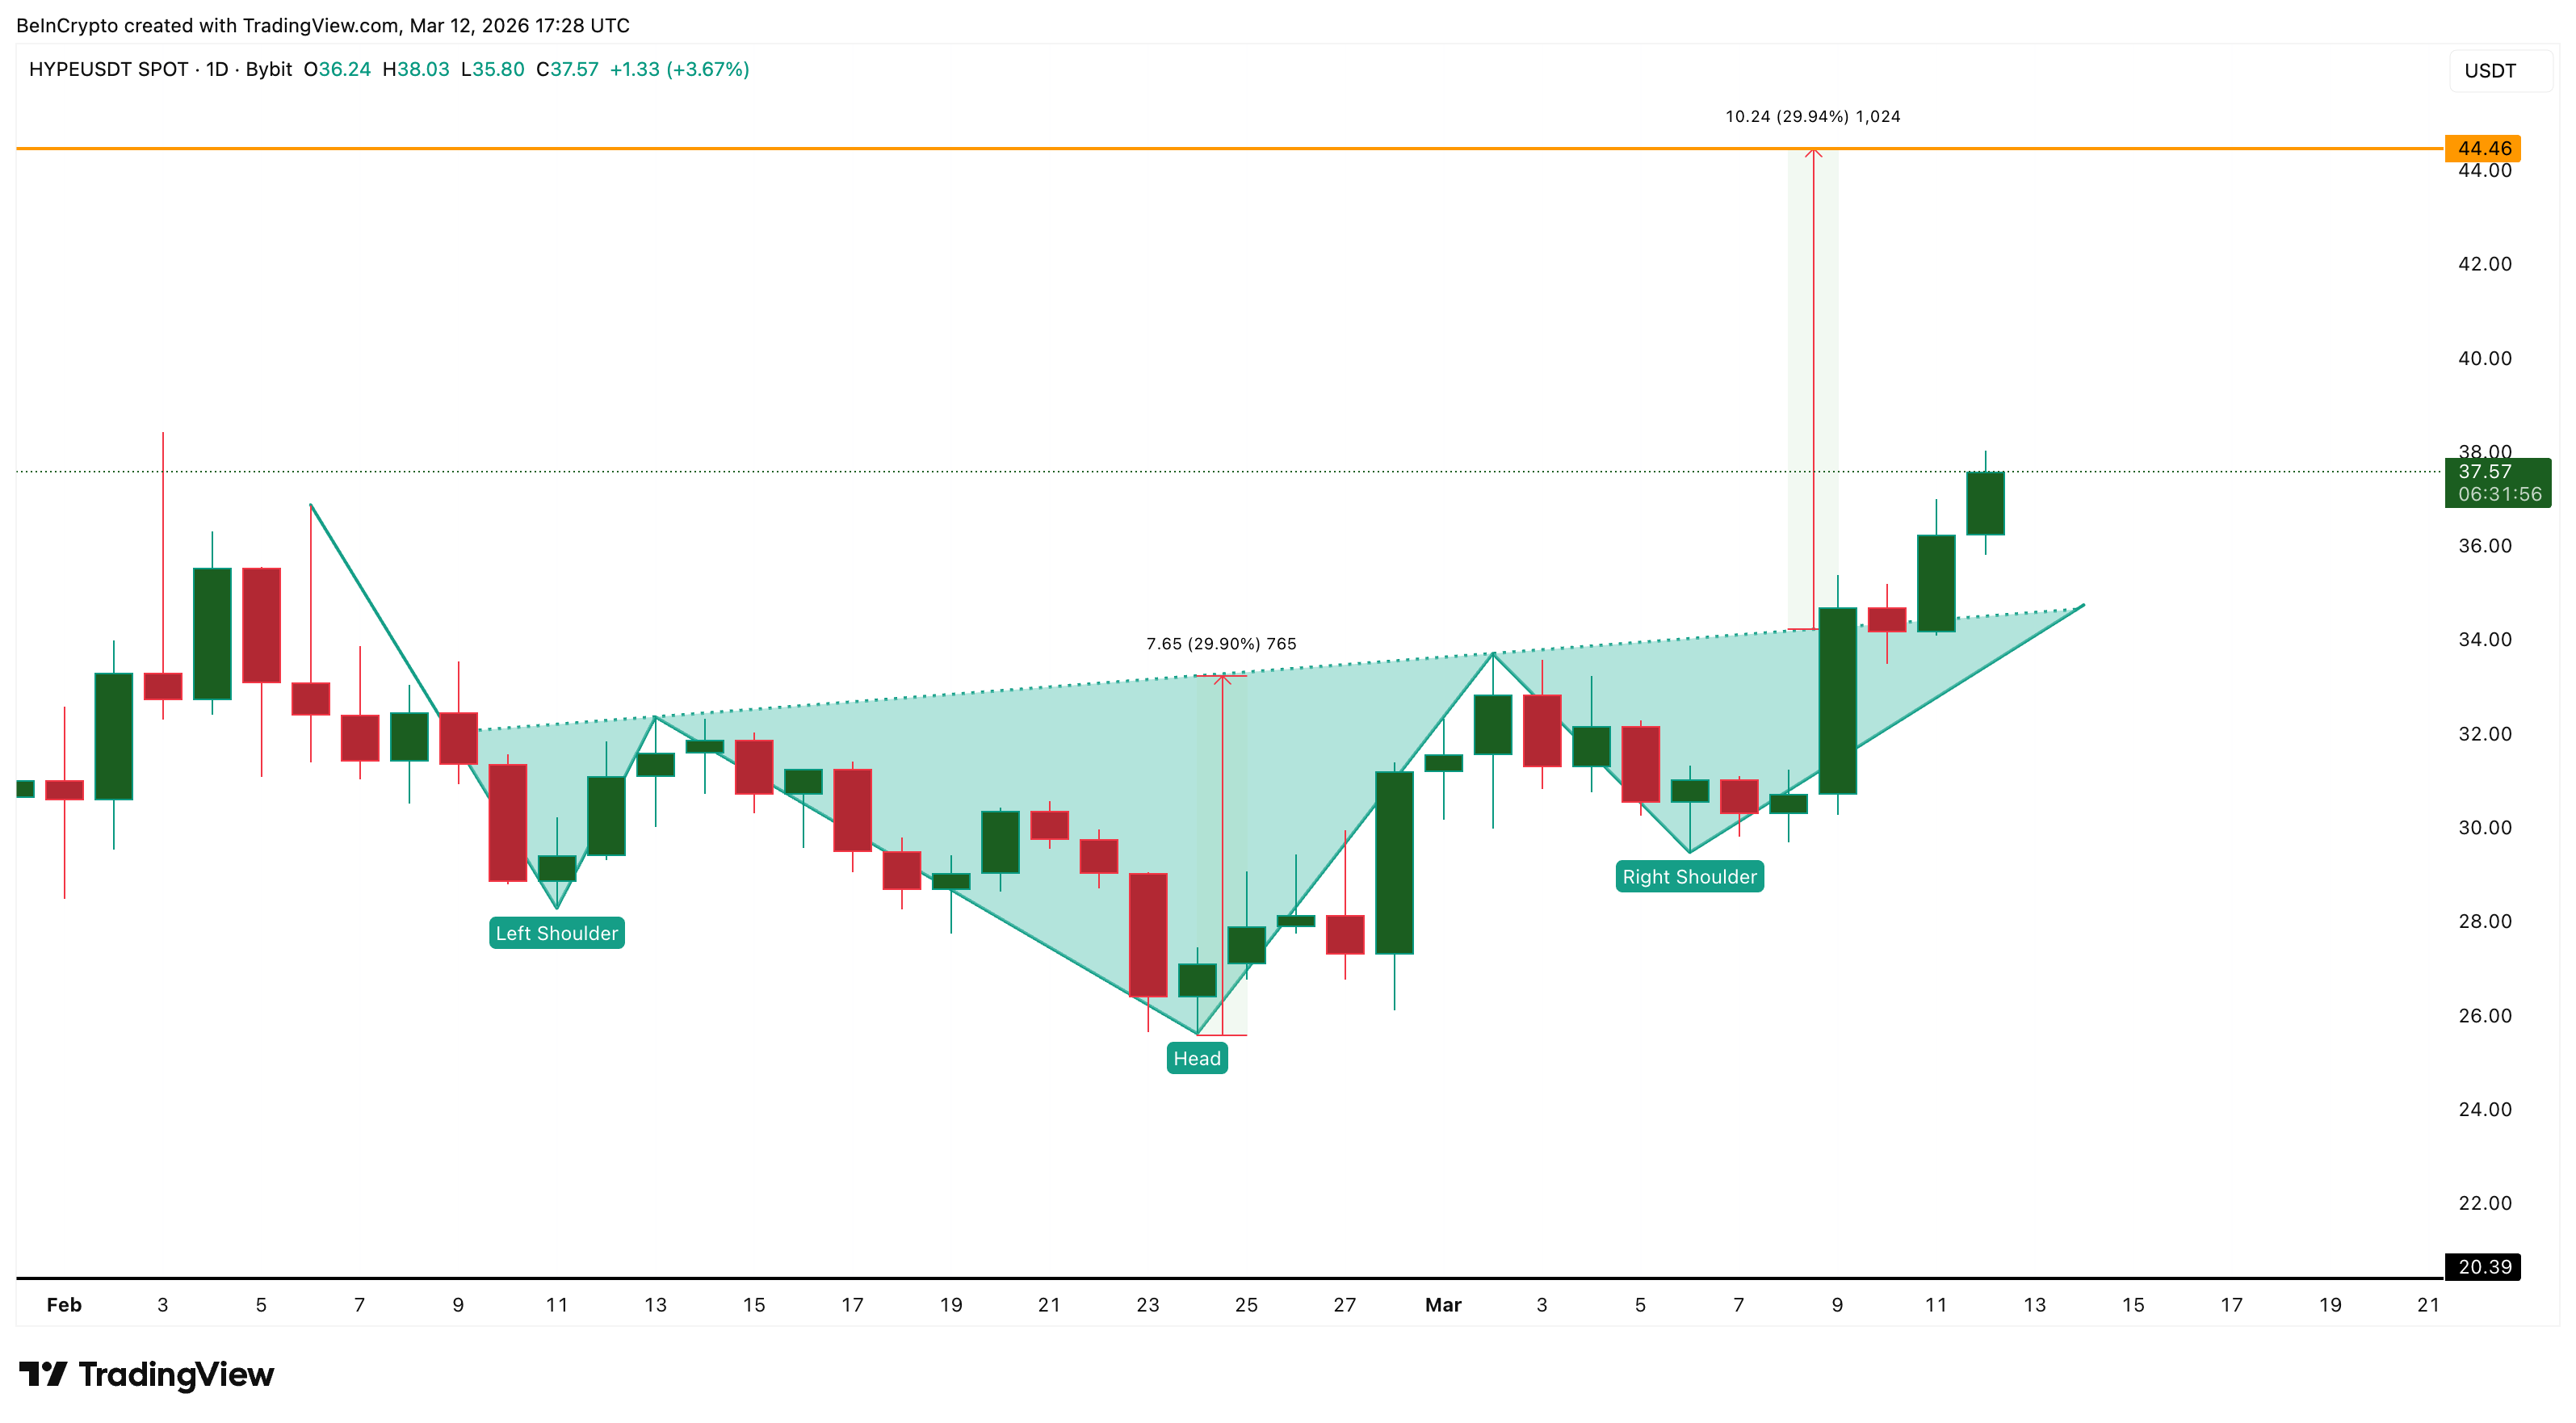 HYPE Price Structure: TradingView
However, a shorter-term signal suggests momentum may already be slowing.
On the 12-hour chart, a divergence has formed between price and the Relative Strength Index (RSI), a momentum indicator. Between January 28 and March 12, HYPE’s price formed a higher high, while RSI produced a lower high. This setup is known as a bearish divergence, which often appears when buying momentum weakens even as prices continue rising. On a given timeframe, this weakness can trigger a price reversal.
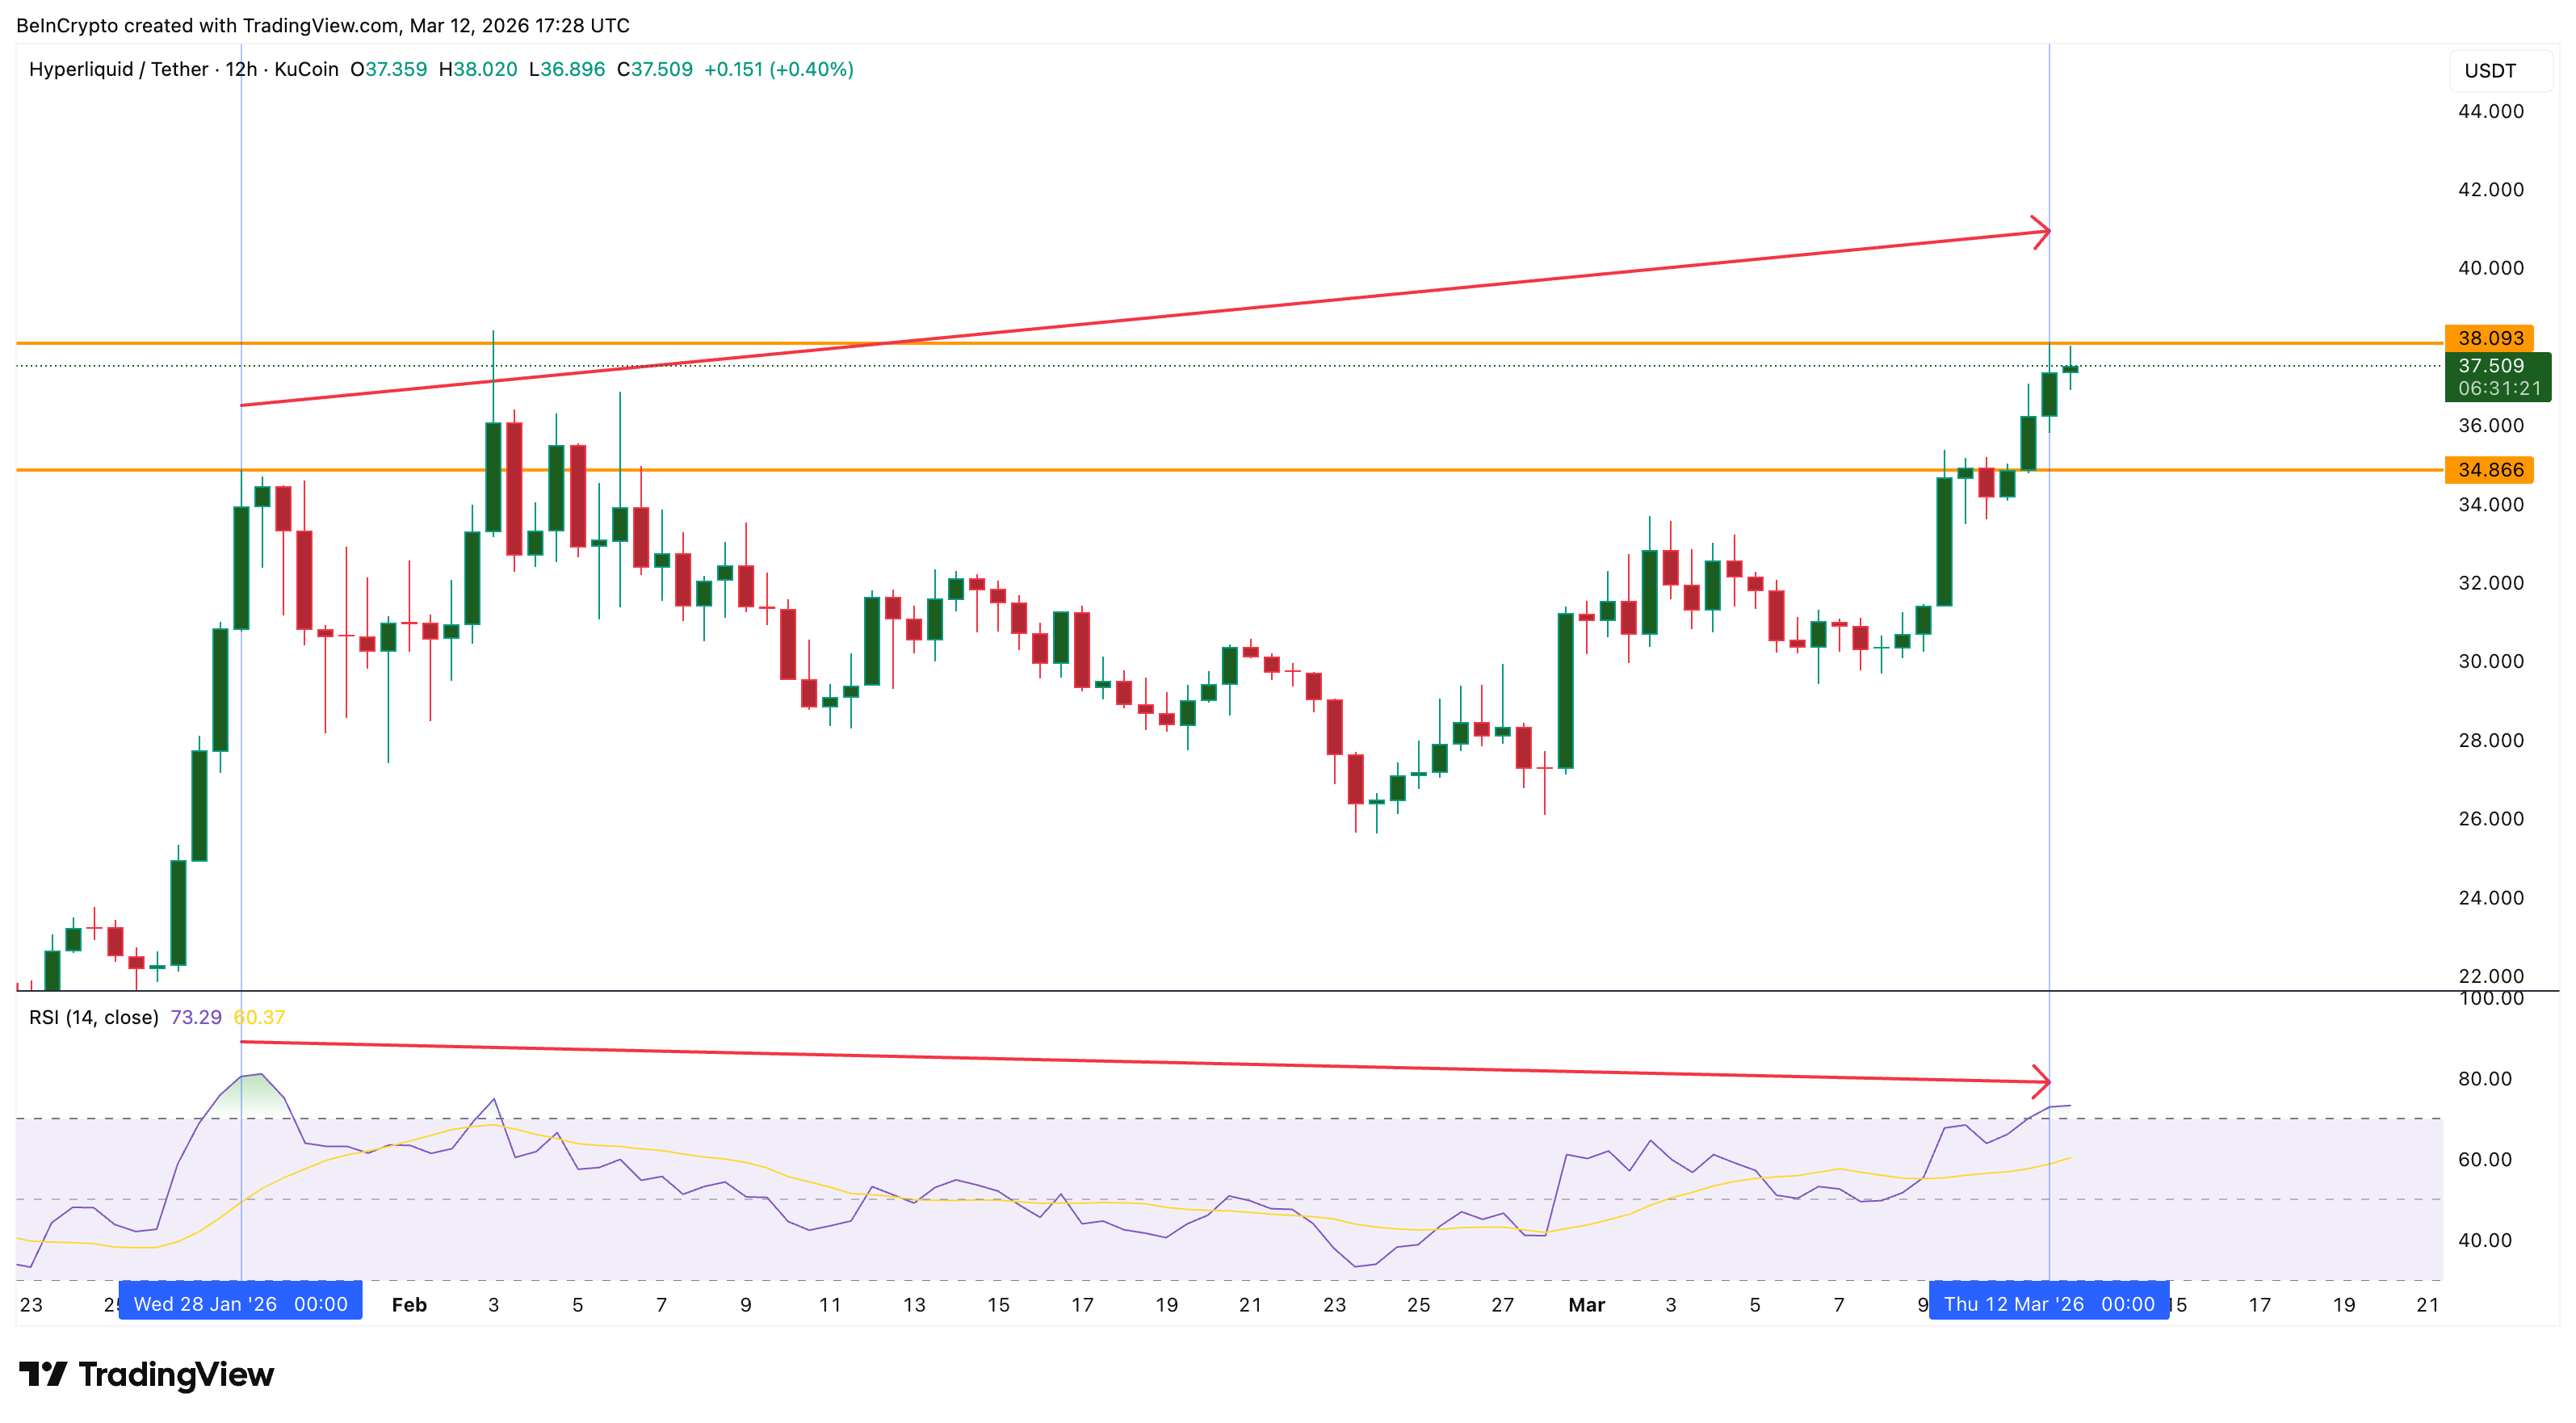 RSI Divergence: TradingView
But price momentum alone does not fully explain the next leg. To understand what actually fueled the move and why it now poses a risk, we need to examine exchange activity.
Exchange Flows Show the HYPE Surge Had Weak Spot Demand
Exchange flow data reveals an unusual pattern behind the recent price move. During the week ending March 2, HYPE recorded about $13.82 million in net outflows from exchanges. Outflows typically suggest investors are withdrawing coins to hold them, which can reduce selling pressure. However, the situation changed during the week when the rally accelerated.
During the week ending March 9, exchanges recorded about $9.62 million in net inflows, meaning more HYPE moved onto trading platforms. Inflows are often associated with potential selling pressure because coins become easier to trade.
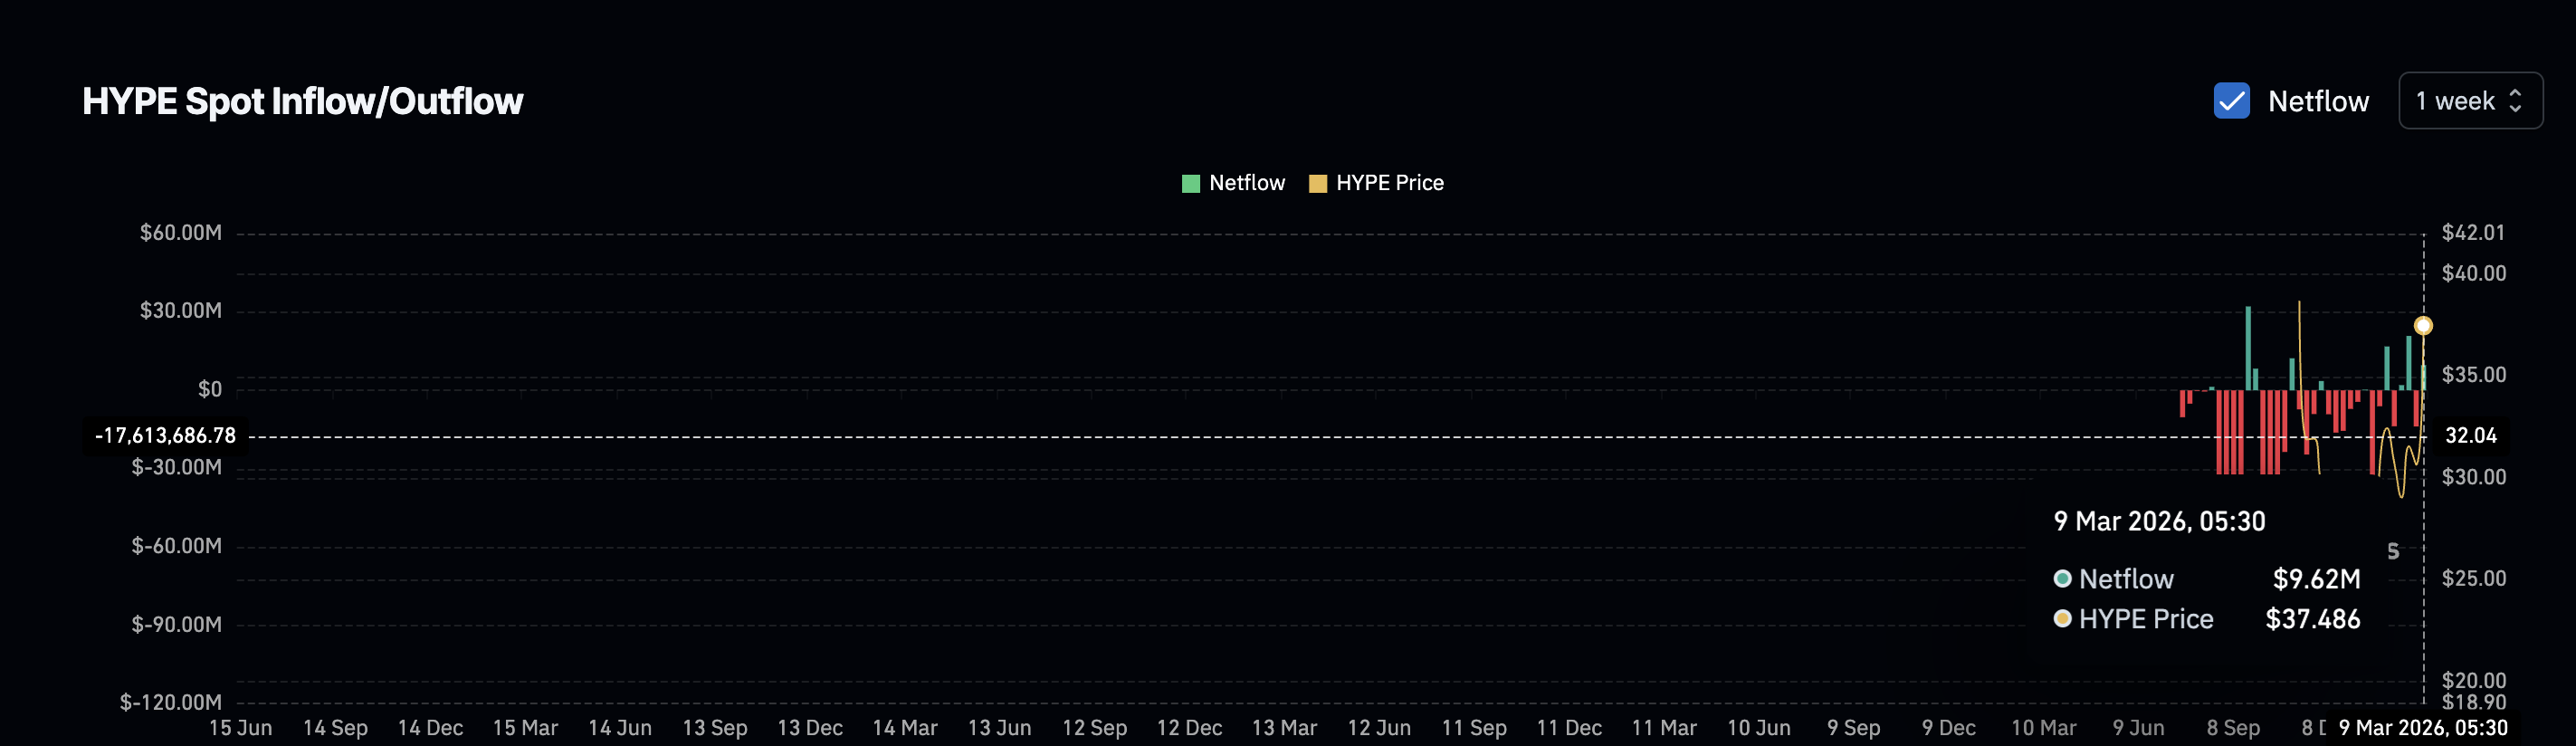 Spot Flows: Coinglass
This suggests the price rally was not supported by strong spot accumulation. Instead, the move appears to have been driven primarily by activity in the derivatives market.
And the derivatives data makes that dynamic clearer.
Liquidation Data Highlights Short Squeeze Trigger And a New Risk
Liquidation data from the Binance HYPE/USDT perpetual market suggests the recent rally was driven by short liquidations. The derivatives positioning now highlights how extreme this shift has become.
On the seven-day timeframe, Binance data shows over $26 million in long leveraged positions compared with only about $7 million in short positions, creating an imbalance of roughly 3.5 to 1 in favor of longs.
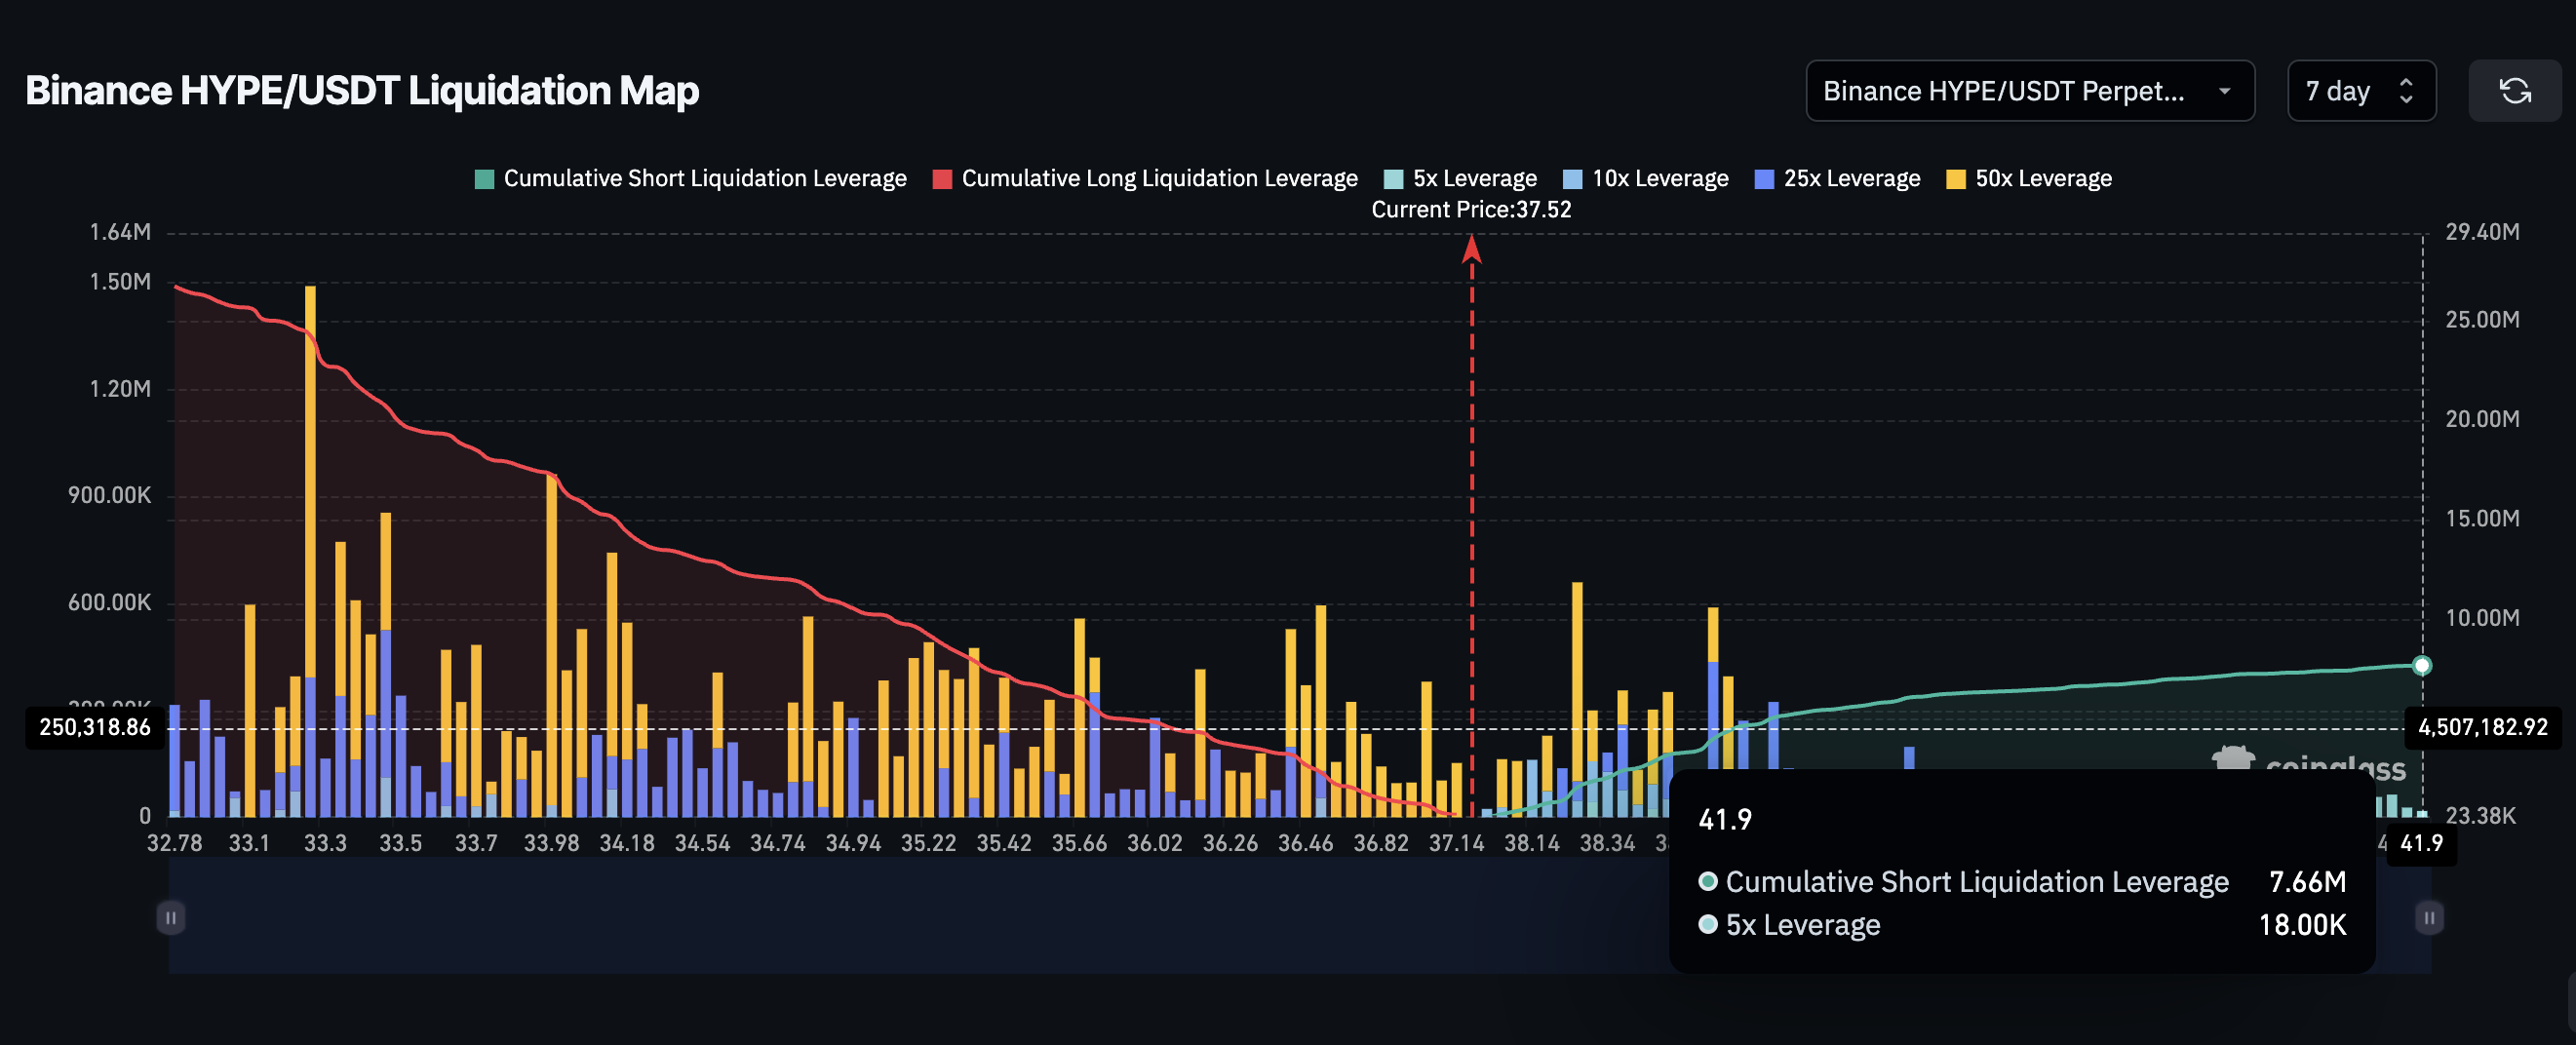 Liquidation Map: Coinglass
In a normal market environment without a strong fundamental trigger, such a sharp skew toward long leverage usually indicates that many short positions faced liquidations during the rally. That forced unwinding likely helped drive the sharp price increase seen over the past week.
With leverage now heavily concentrated on the long side, even a modest price decline can begin triggering liquidations in the opposite direction. That could add fuel to the reversal warning.
That possibility becomes clearer when examining capital flow indicators on the daily chart.
Weakening Money Flow Puts Key HYPE Price Levels Into Focus
Another signal supporting the pullback risk comes from the Chaikin Money Flow (CMF) indicator. CMF is a volume-weighted indicator that tracks whether money is flowing into or out of an asset. Traders often use it as a proxy for large capital activity.
Between March 1 and March 11, HYPE’s price continued making higher highs, but the CMF indicator formed lower highs. This divergence suggests that although prices are rising, the amount of capital supporting the rally is gradually weakening.
 Weak CMF: TradingView
The indicator remains above zero, meaning buying pressure has not completely disappeared. But the declining trend indicates the inflows may no longer be strong enough to sustain the same pace of gains. As a result, several price levels now determine what happens next.
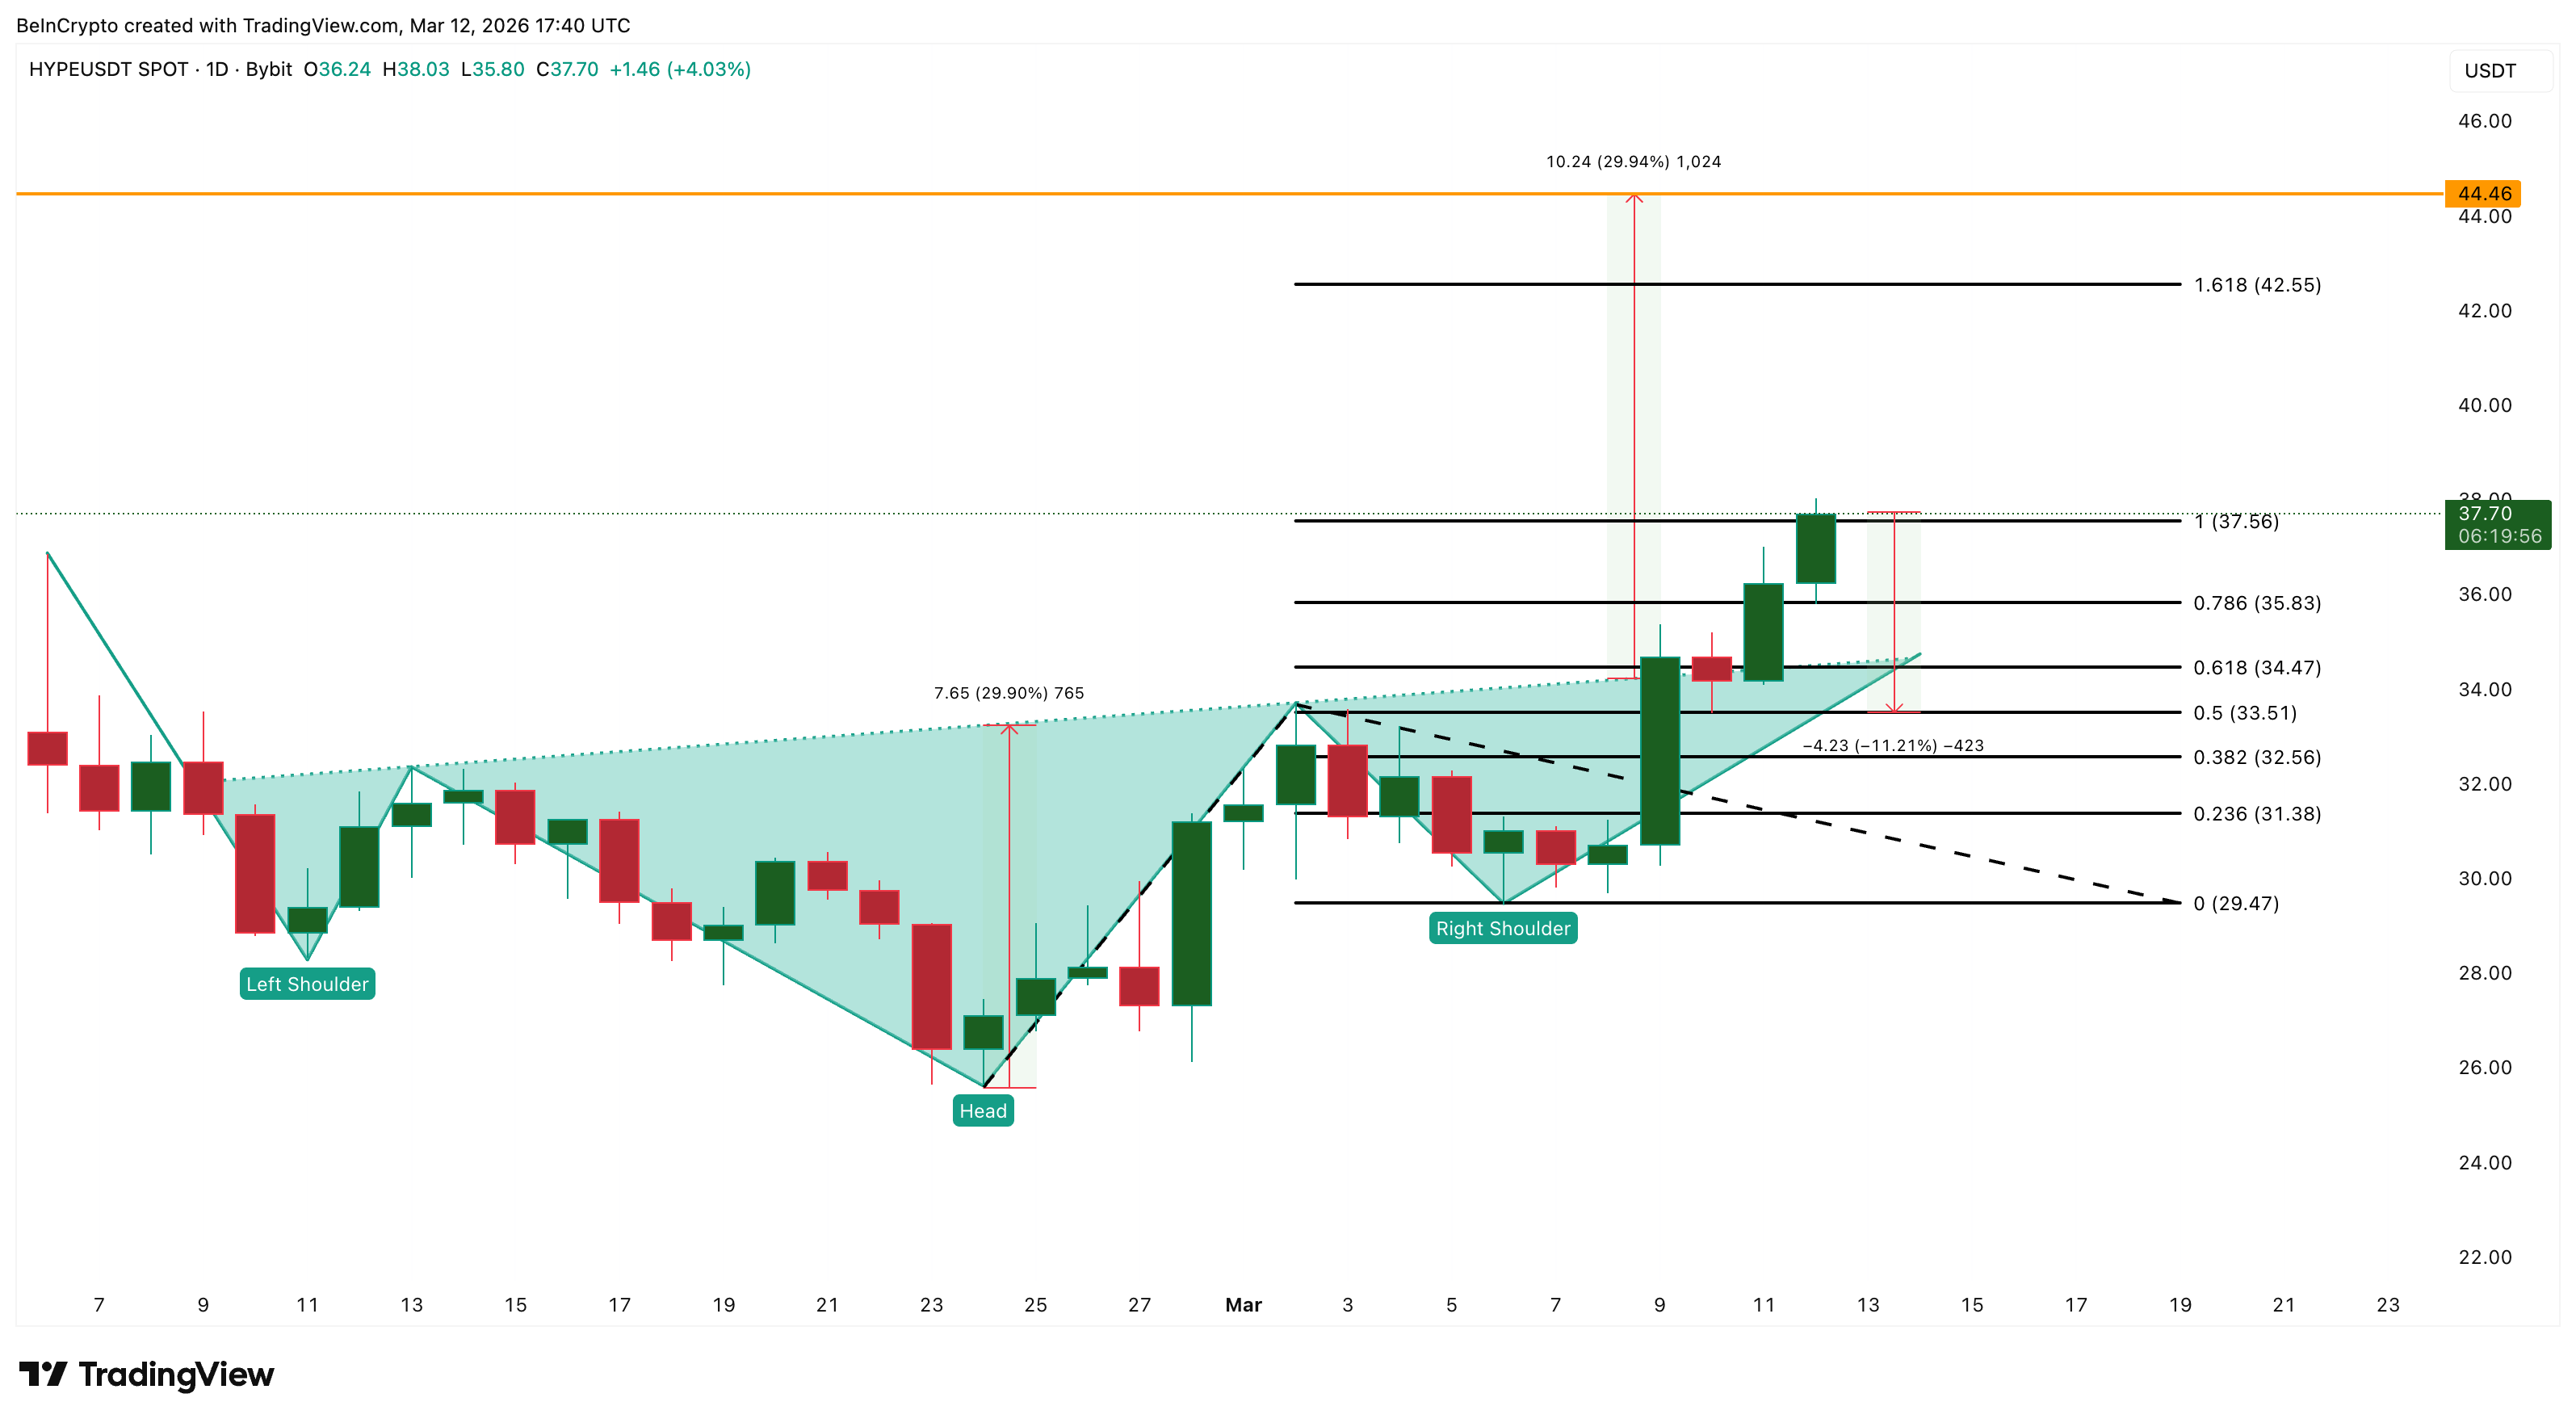
The first key resistance sits near $37.
If HYPE manages to close decisively above this level, the rally could extend toward $42, with the $44 region representing the full breakout target of the inverse head-and-shoulders pattern. However, if sellers push the price back below this resistance zone, a pullback becomes more likely.
 HYPE Price Analysis: TradingView
The first support level appears near $35, where a large cluster of leveraged positions is currently present. A break below this level could trigger liquidations that push the price toward $33, representing roughly an 11% drop from current levels.
A deeper decline below $29 would invalidate the bullish breakout pattern entirely and could trigger a reversal.
Recommended Articles


