

Pi Coin Rallies 75% Ahead of Pi Day! Can the Breakout Go Further?
Pi Coin is drawing fresh attention as the network approaches two major milestones. The token has gained about 5% in the past 24 hours and roughly 24% over the past week. The bigger story is the longer move. Over the past 30 days exactly, Pi Coin has surged nearly 75% ahead of Pi Day on March 14, an annual community event for the Pi network.
The rally continues as the Pi Network protocol upgrade deadline on March 12 arrives, bringing renewed interest to the ecosystem. The move accelerated after PI broke out of a bullish continuation pattern earlier this week. With technical signals and event-driven speculation aligning, traders are now watching whether the rally can extend further.
Pi Day Excitement, Upgrade Deadline, And EMA Signal Trigger Pi Breakout
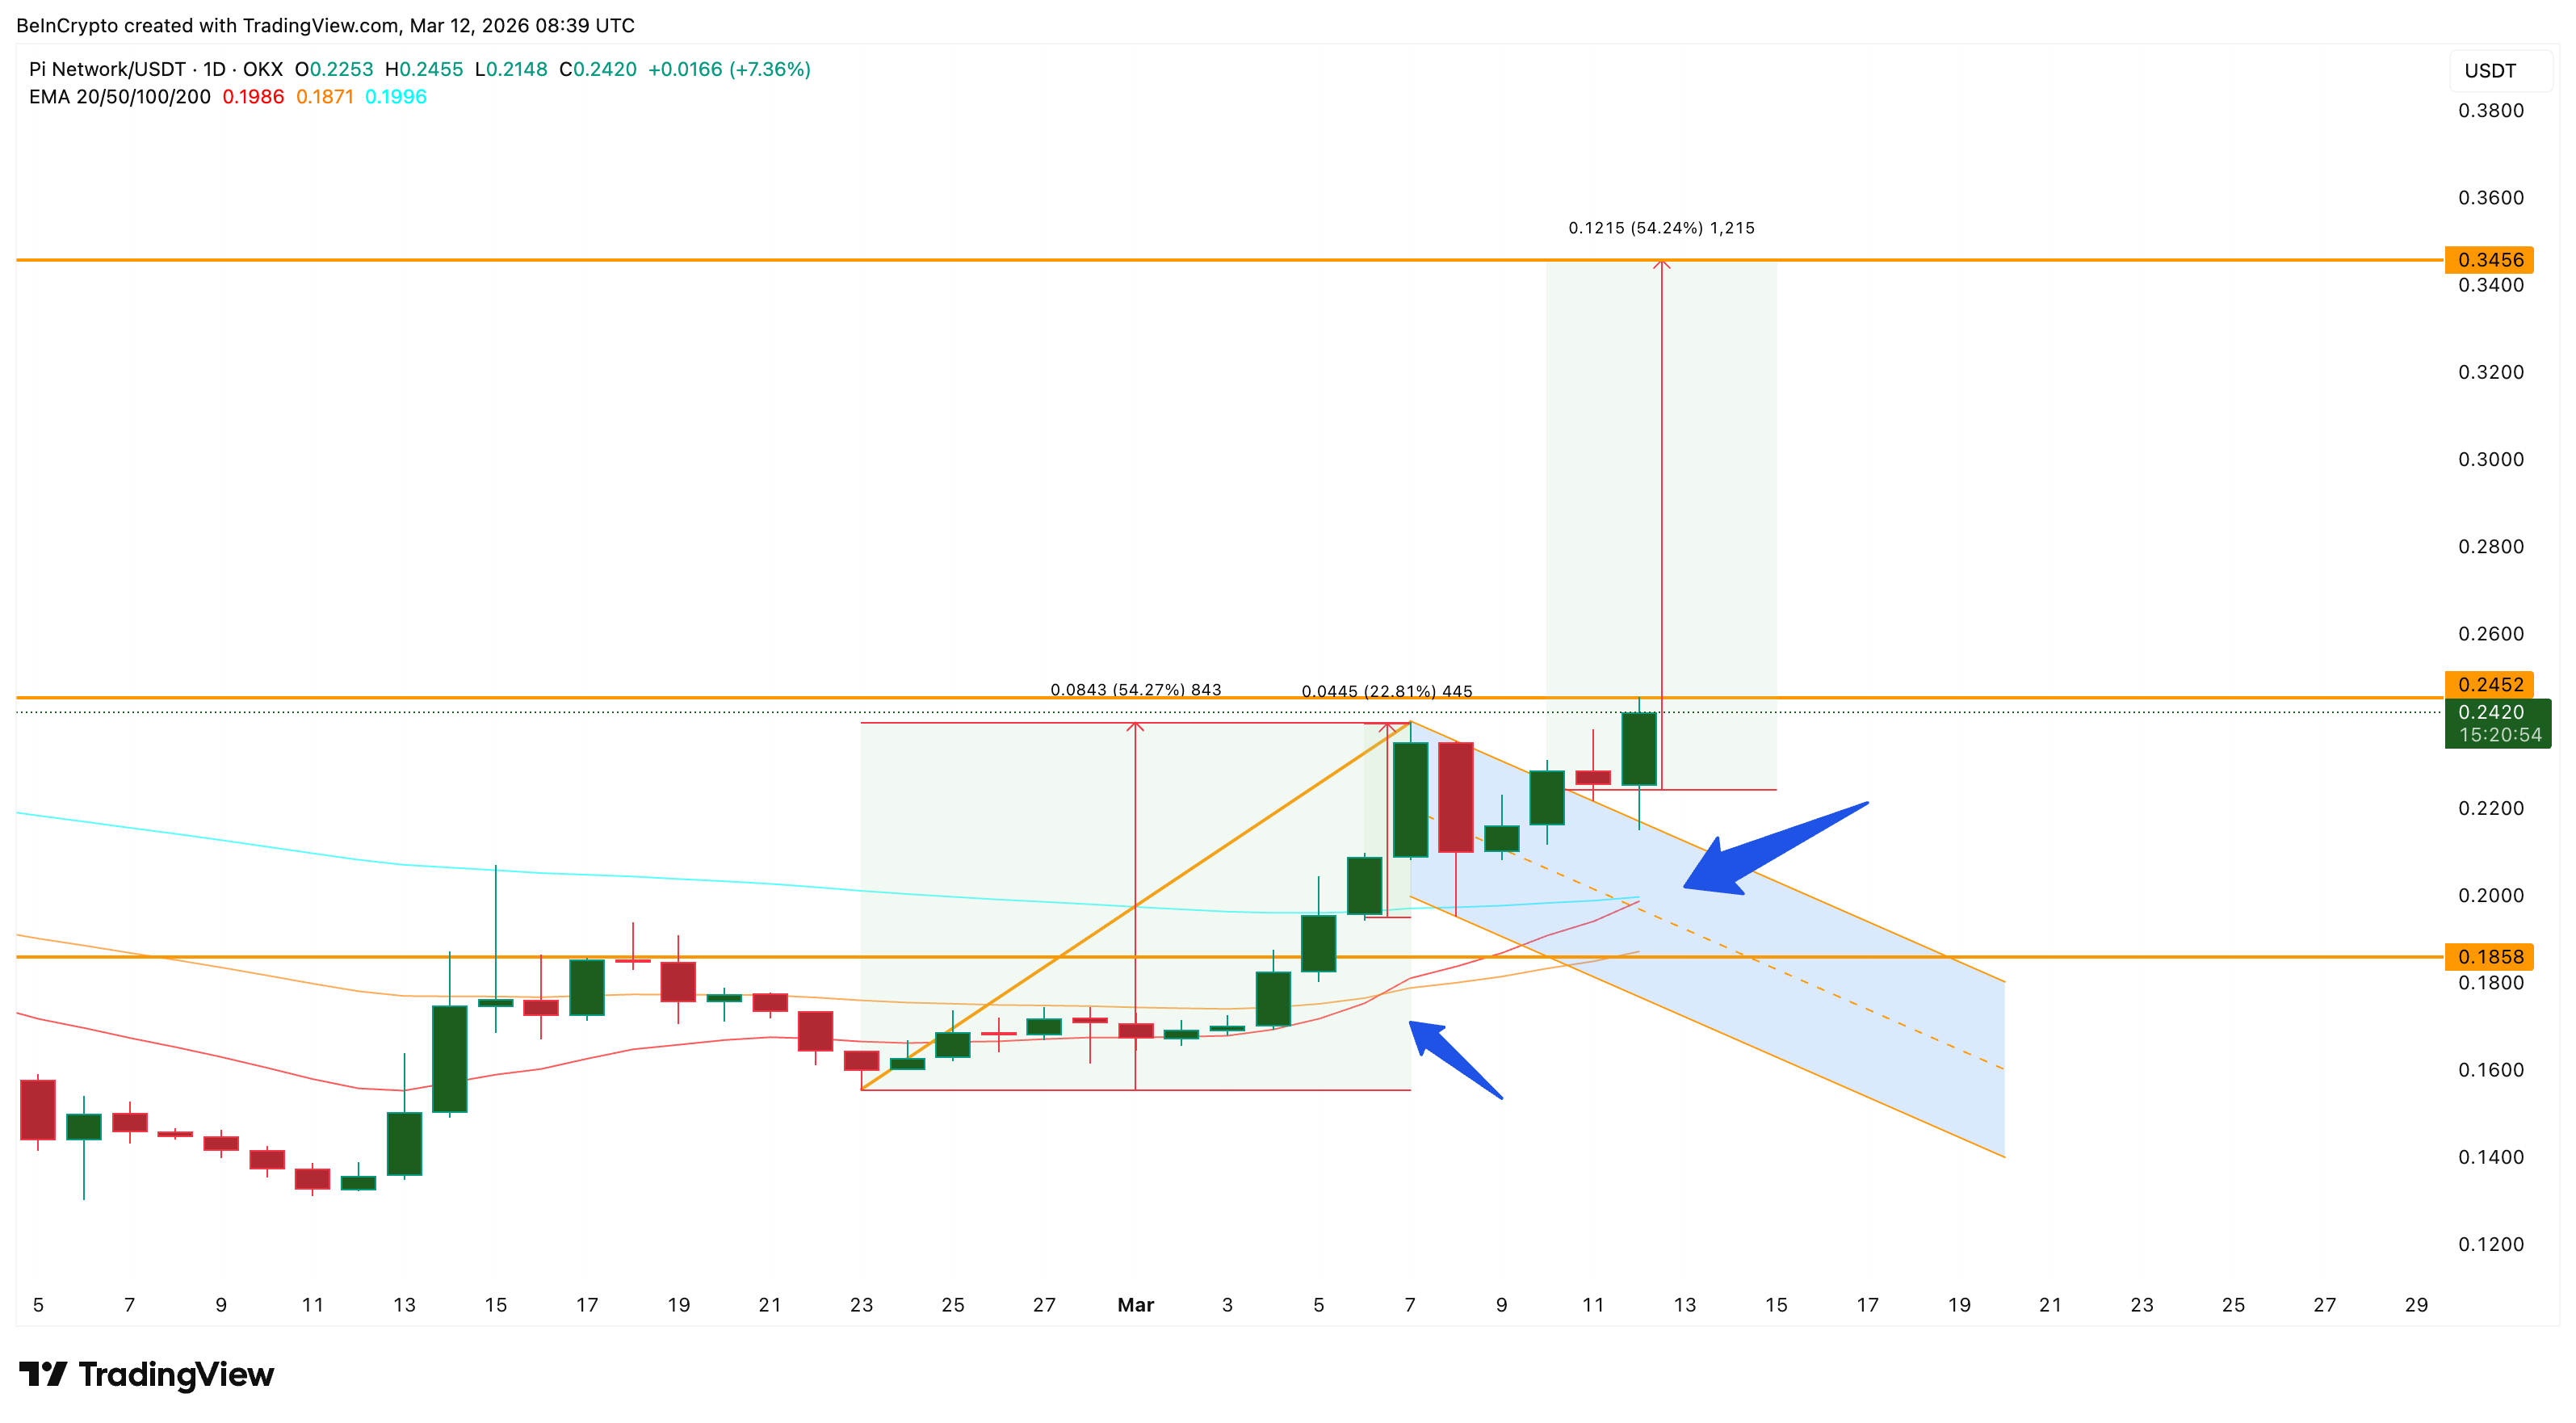
Pi Coin’s latest rally accelerated after the price broke out of a flag-and-pole pattern on March 10, a continuation pattern that often appears when a market pauses briefly before resuming its trend. The breakout pushed the token toward $0.245, which is now acting as the immediate resistance zone. On this final ‘Protocol Upgrade’ day, PI buyers are trying their best to push the price above this resistance.
At the same time, a bullish moving-average signal is forming. The 20-day EMA, an exponential moving average that tracks short-term momentum, is approaching a bullish crossover above the 100-day moving average, a signal traders often interpret as strengthening bullish momentum.
A similar signal earlier in the rally, when the 20-day EMA crossed above the 50-day average, was followed by a 22% surge in Pi Coin, which is why traders are watching this developing crossover closely.
Want more token insights like this? Sign up for Editor Harsh Notariya’s Daily Crypto Newsletter here.
 PI Price Structure: TradingView
The breakout also arrives just as the network approaches the protocol upgrade deadline and the Pi Day celebration, creating a mix of technical momentum and event-driven interest that has fueled the recent rally.
Capital Inflows Suggest Big Money Is Supporting the Rally
Capital flow indicators suggest buyers remain active behind the move.
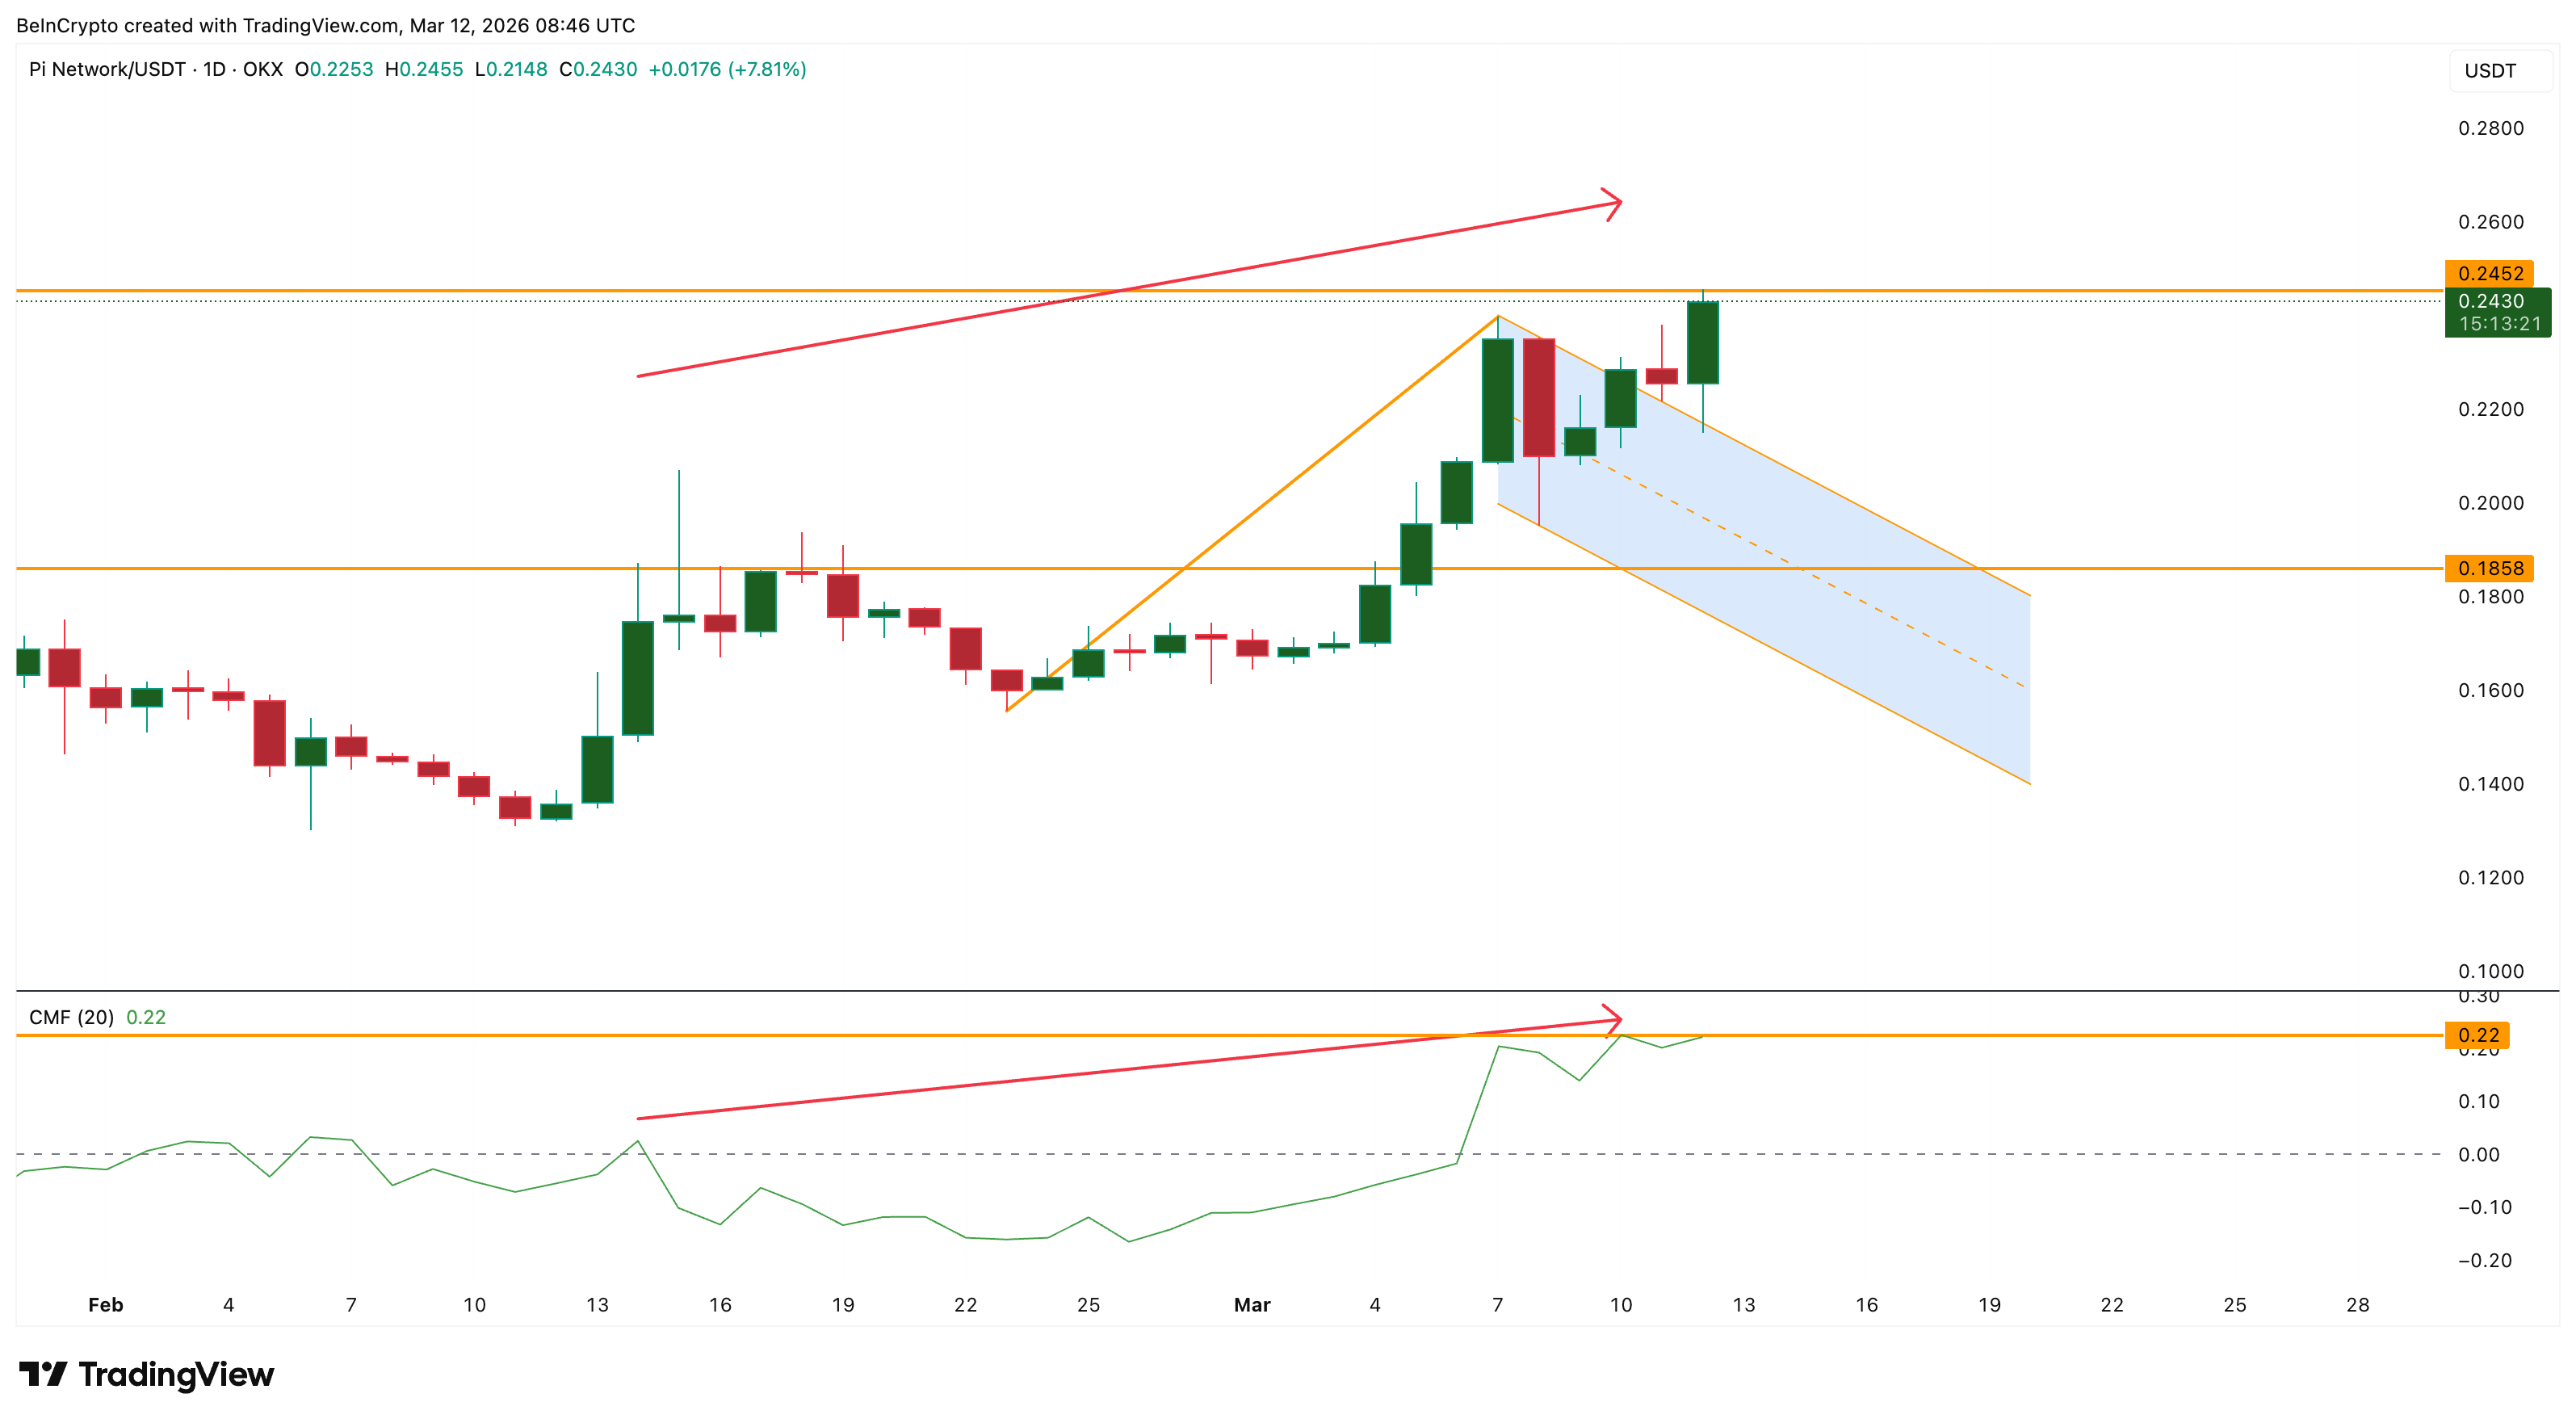
One important signal comes from CMF or Chaikin Money Flow, a volume-based indicator often used as a proxy for big money inflows.
PI’s CMF briefly cooled in mid-February before resuming a steady uptrend. However, relative to the February level, it continued making higher highs into the March breakout, showing that buying pressure has accompanied the price rally.
The indicator is now approaching the 0.22 level, which would confirm continued buying pressure if broken. If CMF pushes above this level, it would signal that capital inflows remain strong enough to support another upward Pi Coin price move.
 PI CMF Surges: TradingView
However, if CMF begins falling instead, it would indicate weakening buying pressure and could open the door to a short-term pullback.
Smart Money Remains Bullish, But Momentum Shows a Small Warning
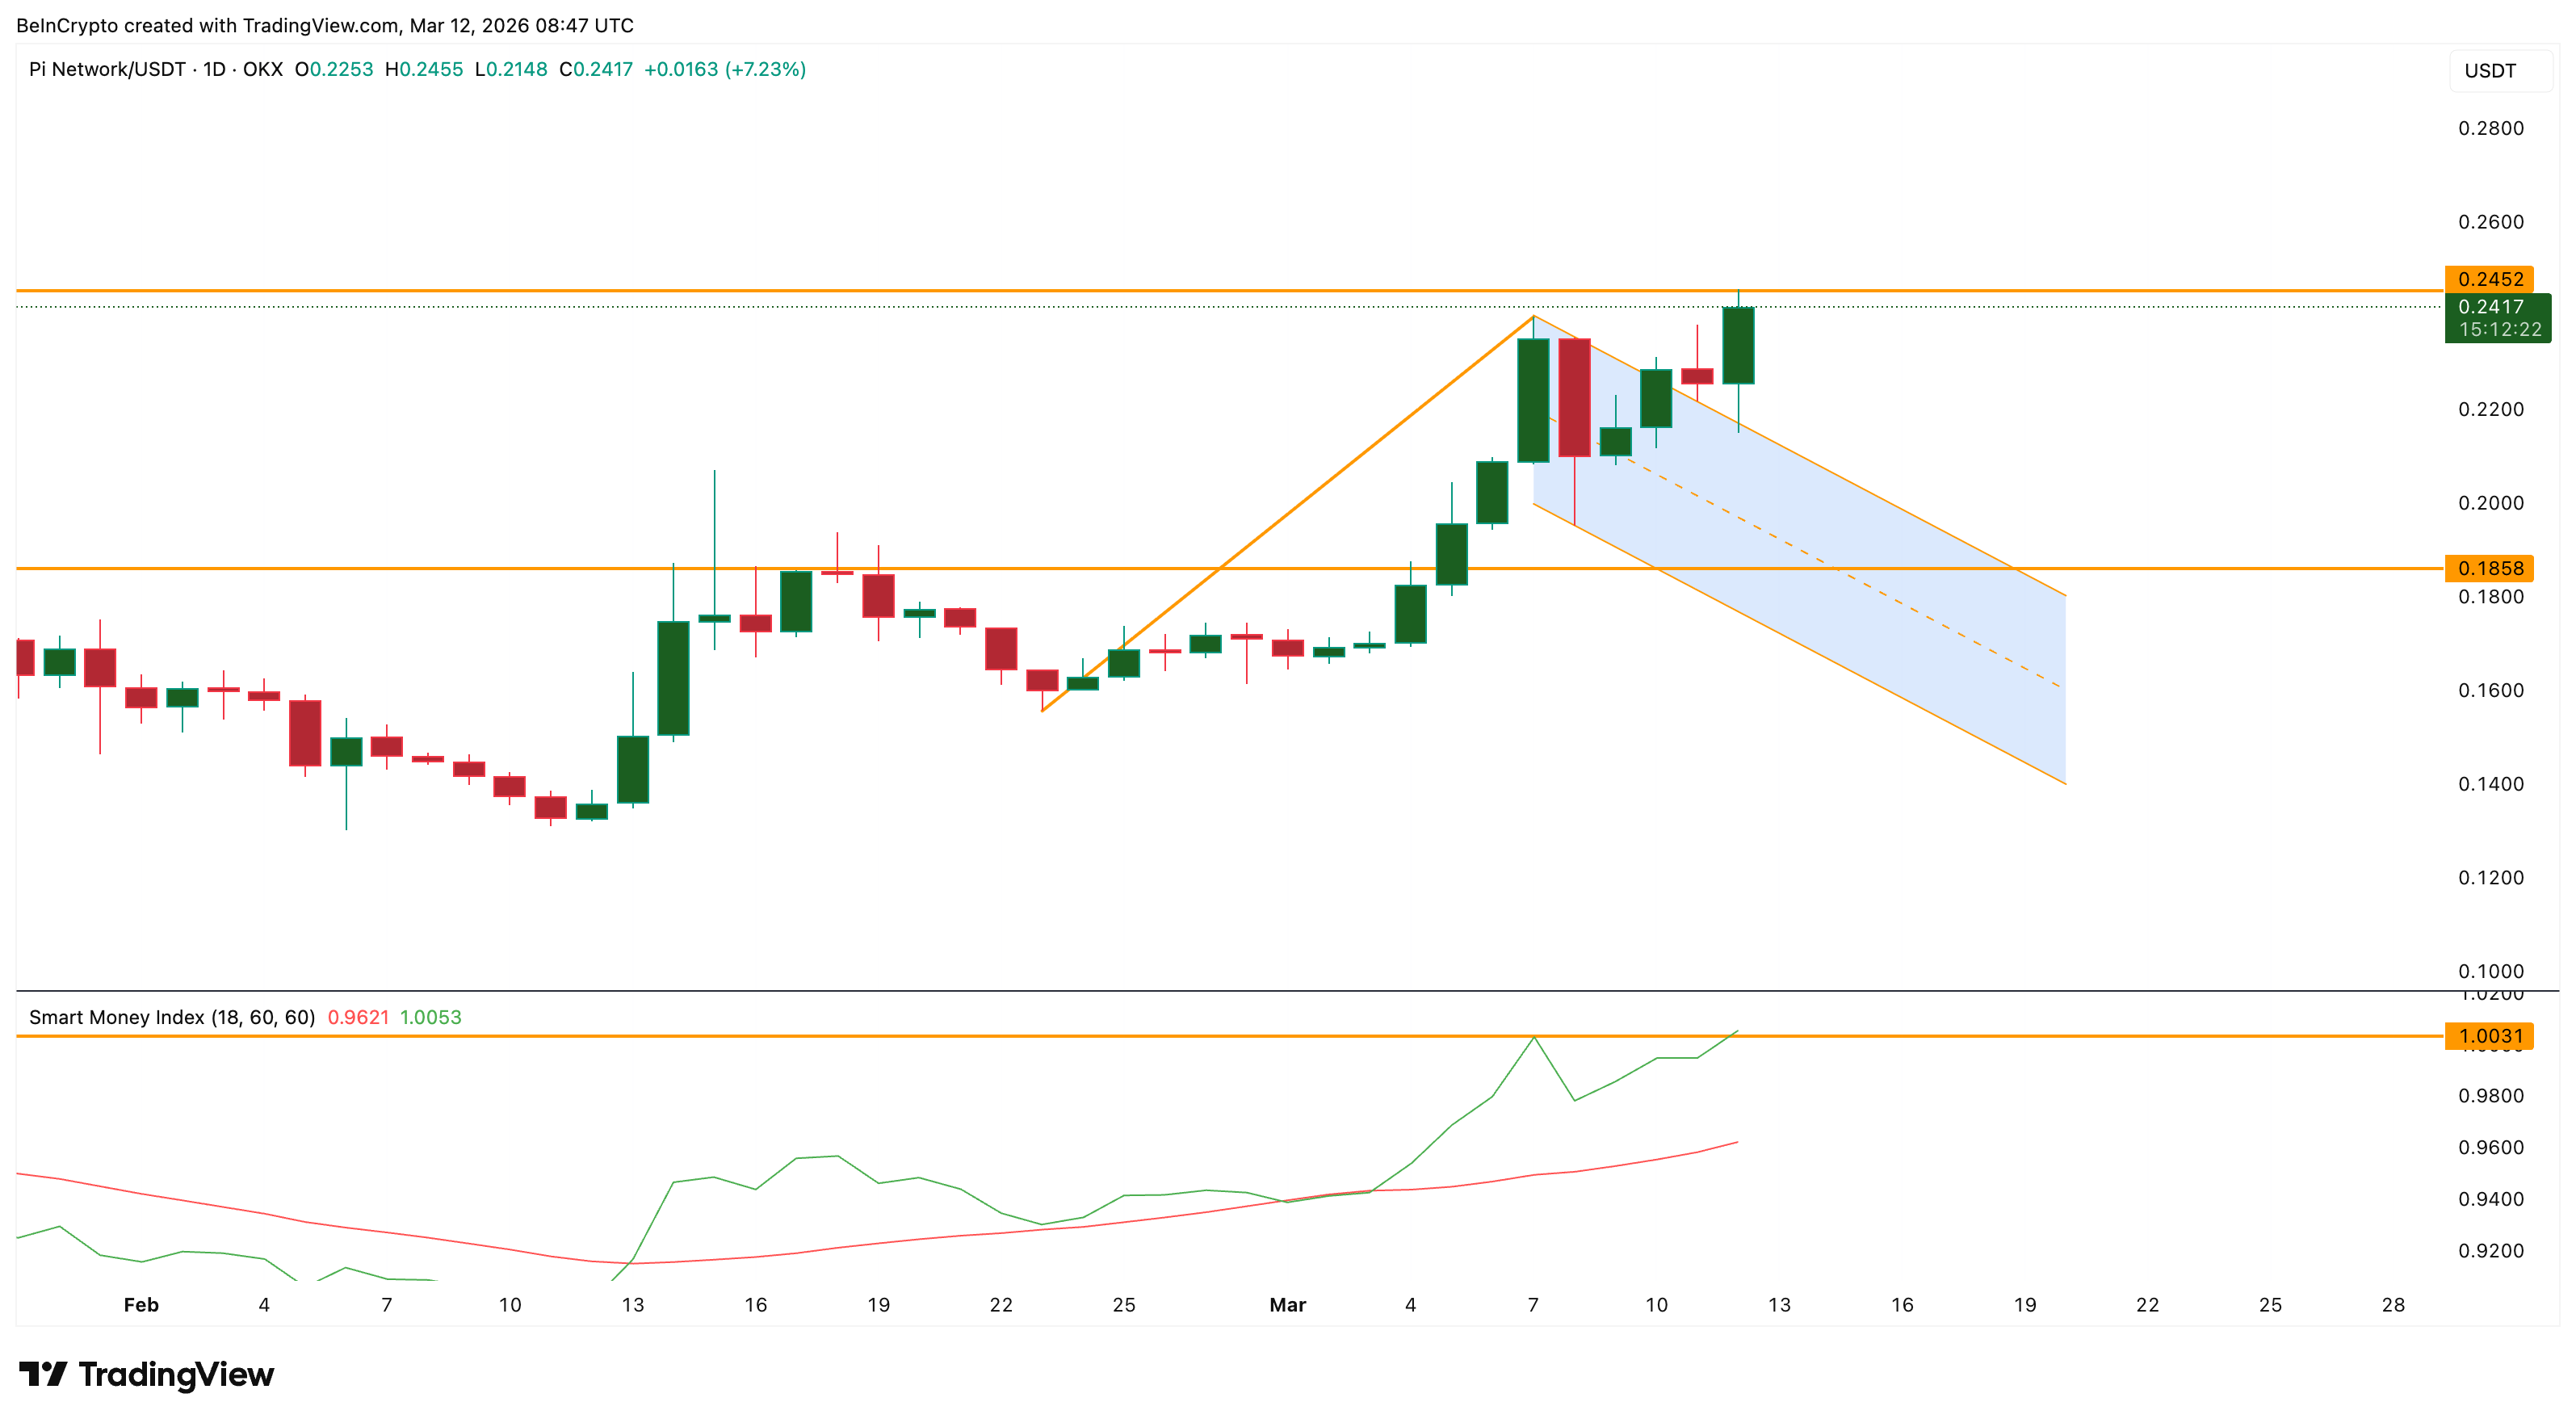
Another metric tracking trader positioning suggests optimism among experienced participants.
The Smart Money Index, an indicator that attempts to capture the behavior of experienced traders, has been trending upward since March 3. Recently, the index moved above the previous peak recorded on March 7, suggesting that informed traders may still be positioning for further upside.
 Smart Money Bullish: TradingView
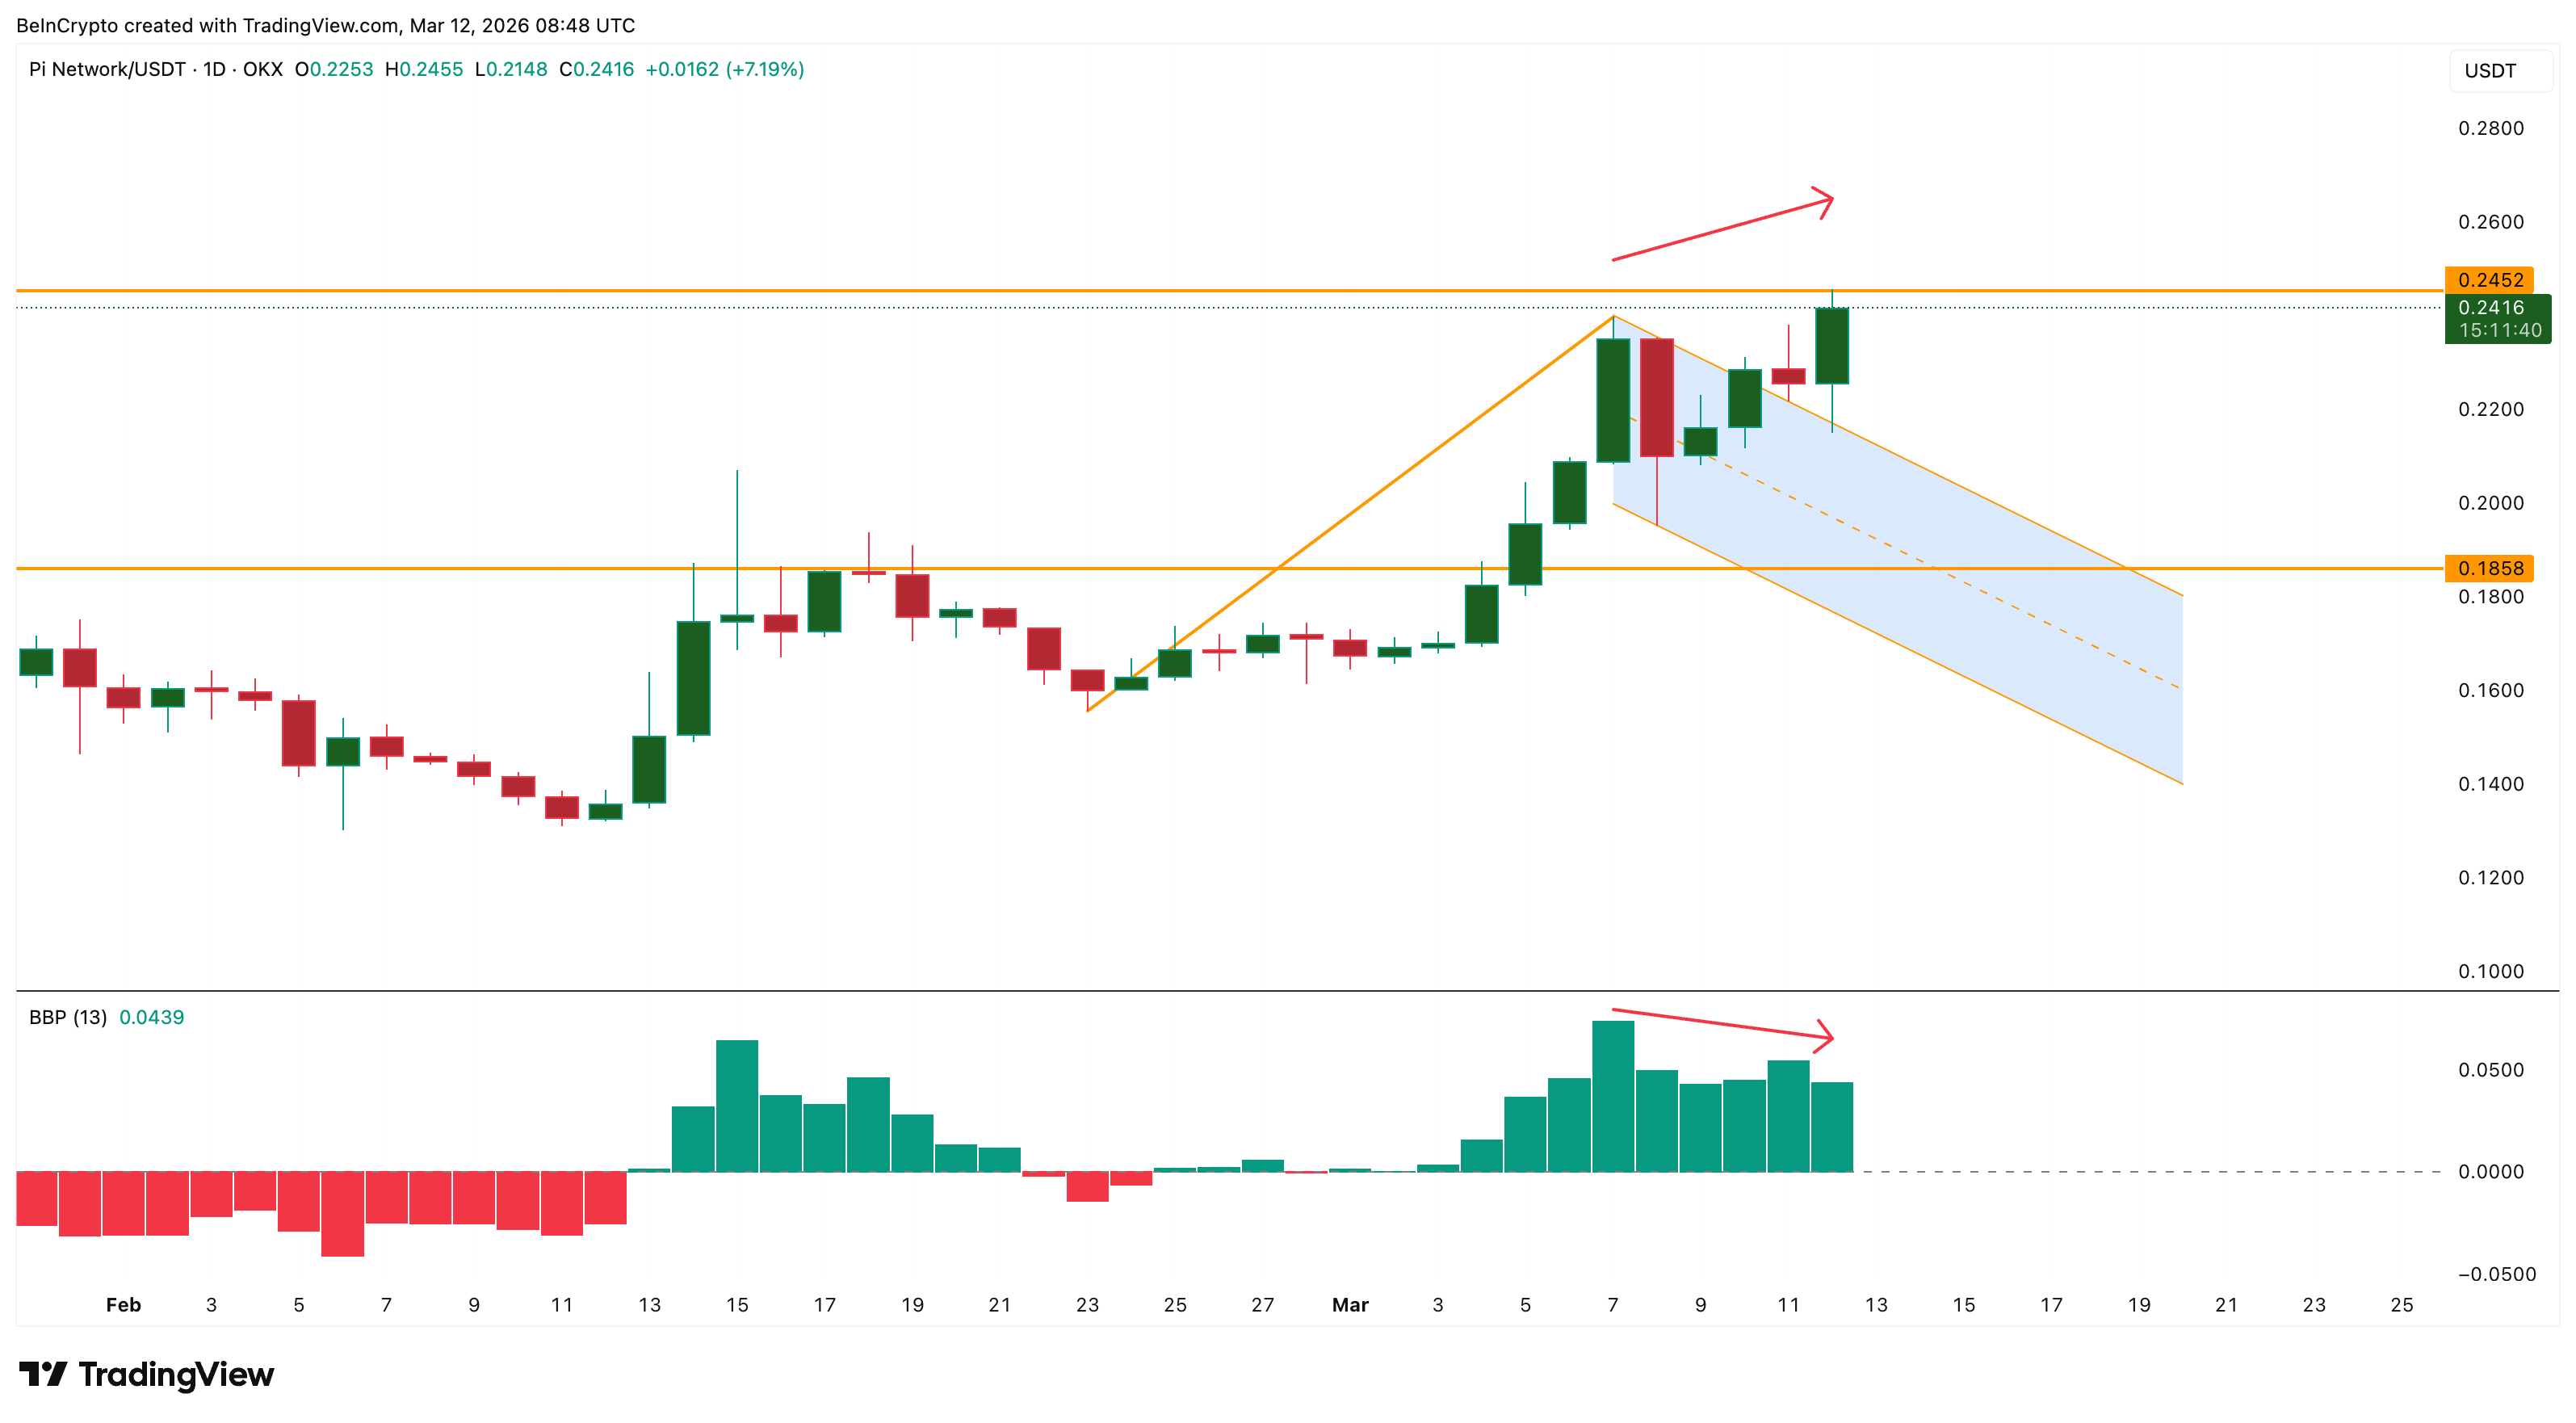
However, one momentum indicator introduces a small caution signal.
The Bull-Bear Power indicator, which measures the strength of buyers compared with sellers by tracking how far prices move above or below average levels, shows that bullish momentum peaked around March 7. Since then, the size of bullish bars has gradually decreased even as the price moved higher, a price vs indicator disagreement. This behavior often appears when buying pressure begins to slow slightly.
 Bulls Losing Grip: TradingView
That does not necessarily end the rally. Yet it can signal that the market may pause or consolidate before attempting another move upward. However, a recent listing rumor can help keep the pullback risks to a minimum.
Pi Coin Price Levels That Are Critical To The Rally
The most important resistance currently sits between $0.245 and $0.247, where PI recently faced selling pressure.
If buyers manage to break above this zone, the next Pi Coin price levels traders could be watching appear near $0.261 and $0.279. The latter represents roughly 15% upside from current prices. It also sits at the 100% Fibonacci extension level of the captured trend.
If momentum strengthens further, the breakout projection suggests the price could eventually extend toward the $0.332 region.
On the downside, several support levels could determine whether the bullish structure remains intact. The first support sits near $0.227, followed by another level around $0.215.
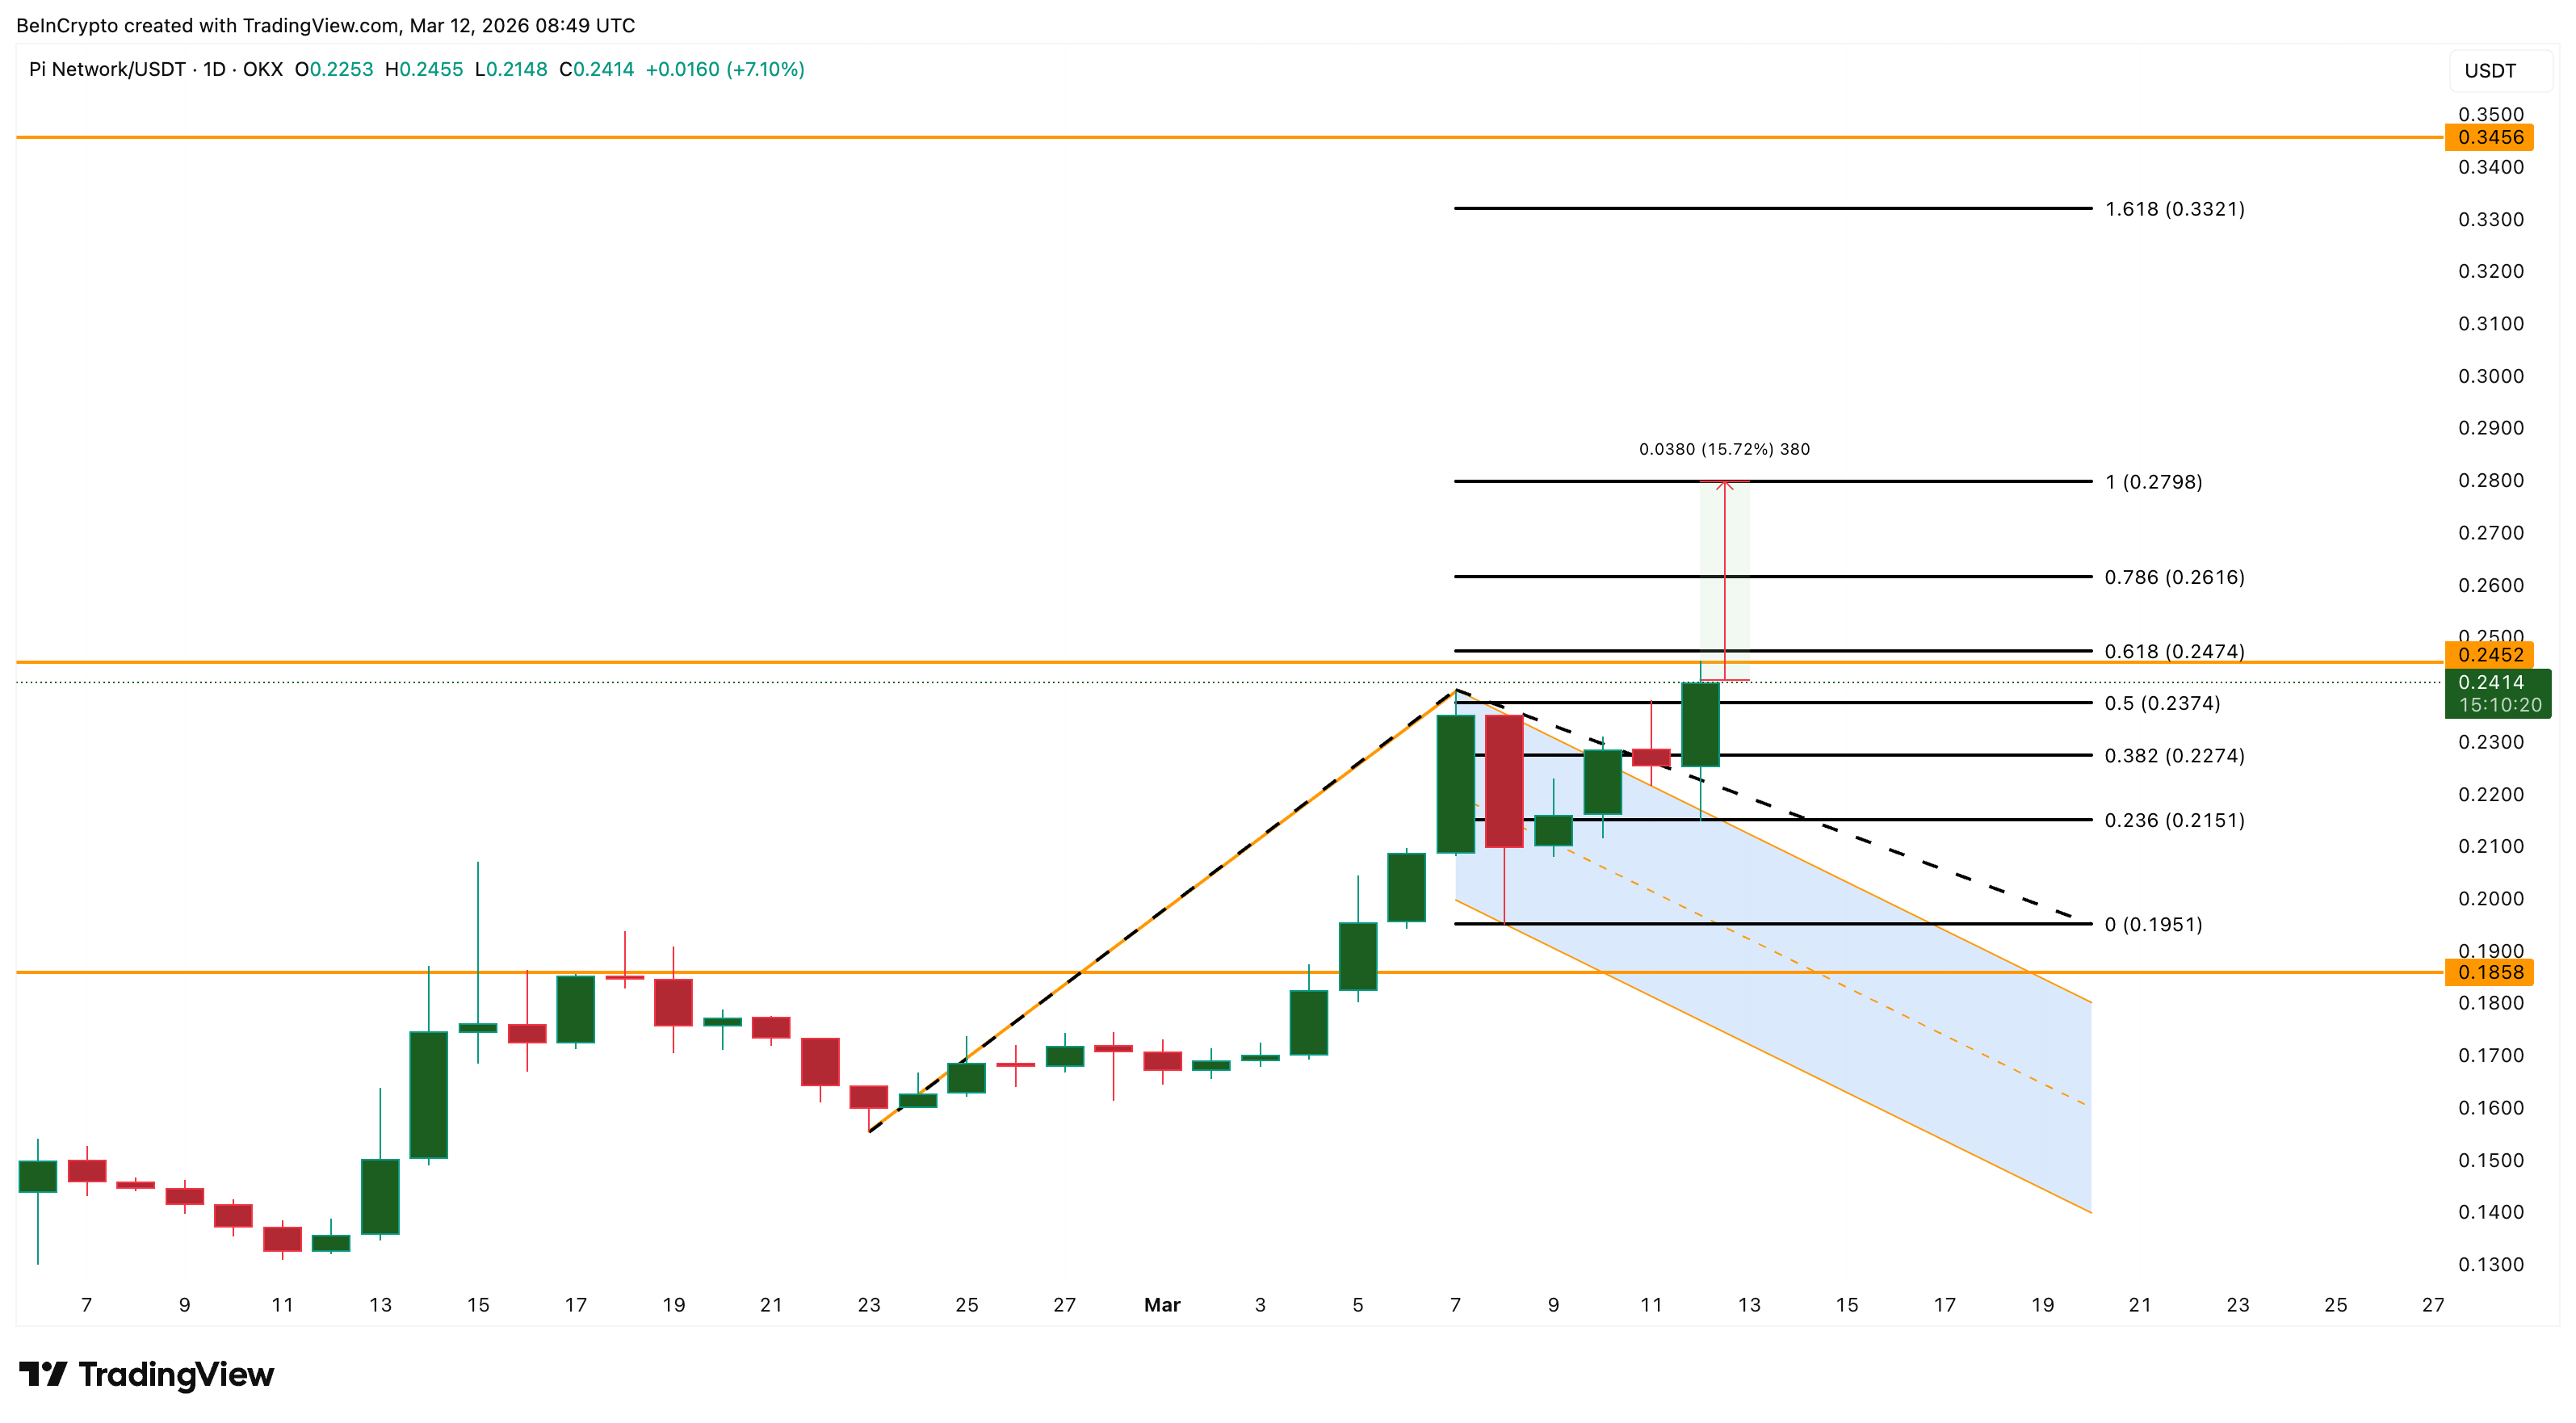 Pi Coin Price Analysis: TradingView
A drop below $0.195 would weaken the breakout pattern and increase the probability of a deeper correction. For now, Pi Coin remains supported by strong momentum, rising capital inflows, and the anticipation surrounding Pi Da. This leaves traders watching closely to see whether the rally can push beyond the $0.245 resistance zone.
Recommended Articles


