

Ripple Price Forecast: XRP trades rangebound amid growing Open Interest, payments expansion in Australia
- XRP trades above the $1.38 daily open, reflecting a broadly steady cryptocurrency market.
- Ripple has secured an Australian Financial Services License to expand payments across the APAC region.
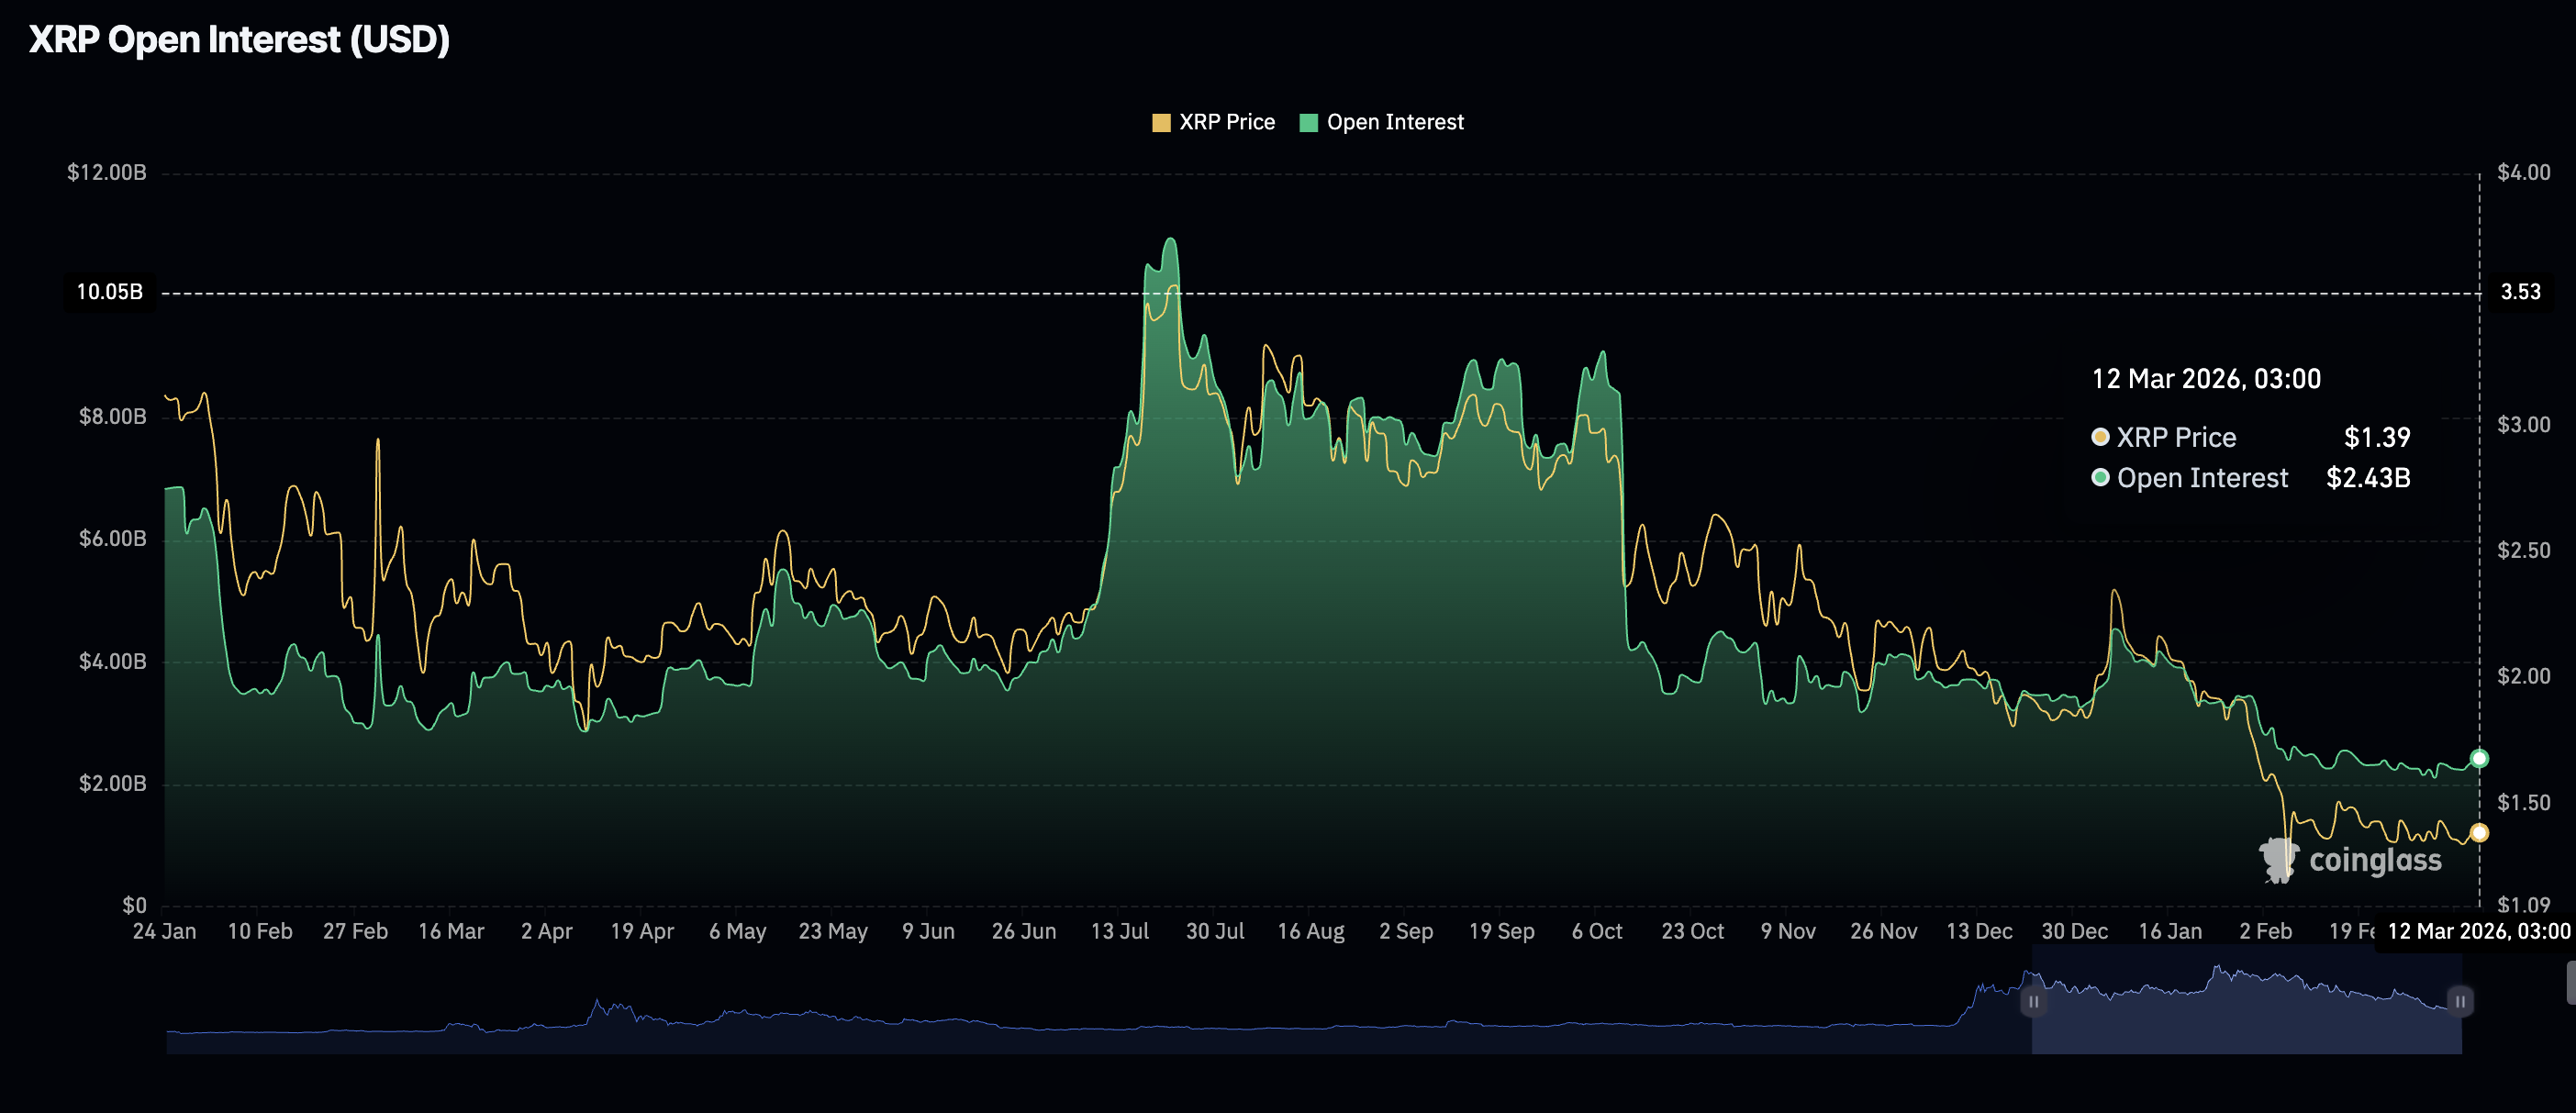
- Retail demand shows early signs of returning, with futures Open Interest rising to $2.43 billion on Thursday.
Ripple (XRP) shows subtle signs of regaining momentum above its daily open of $1.38 as cryptocurrency prices broadly recover. The remittance token hovers at $1.39 at the time of writing on Thursday, supported by a growing retail interest and Ripple’s expansion in the Asia-Pacific (APAC) region.
Ripple secures Australian license to scale payments
Ripple has announced that the company has secured an Australian Financial Services License (AFSL) to expand its regulated footprint in the APAC region.
The license gives Ripple the mandate to expand its payment services in Australia by connecting fintechs and enterprises seeking faster, more efficient and secure cross-border value transfers, all within a regulated framework.
However, before the license is issued, Ripple is expected to finalize the acquisition of BC Payments Australia Pty, a financial services provider.
Retail demand returns amid a potential XRP breakout
Interest in XRP has remained subdued in 2026, as reflected by futures Open Interest (OI) falling to $2.11 billion on March 4 before rising to an average of $2.43 billion on Thursday. The increase in OI mirrors XRP’s growth from the Iran war-triggered crash to $1.27 to the current price of $1.39.
A steady rise in the OI suggests that investor confidence is improving, potentially sustaining bullish momentum.
Technical outlook: XRP challenges broader bearish trend
XRP edges up above $1.39, with the near-term bias remaining cautiously bullish. The remittance token holds below the clustered 50-day, 100-day, and 200-day Exponential Moving Averages (EMAs), which are all trending lower and frame a medium-term downtrend. Moreover, the downward-sloping resistance trend line from the record high of $3.66 continues to cap the broader structure, keeping rallies within a corrective context despite the recent bounce.
Momentum appears subdued rather than capitulative, given that the Moving Average Convergence Divergence (MACD) indicator remains above the signal line but below the neutral line on the daily chart. Modest green histogram bars prompt traders to lean into risk. The Relative Strength Index (RSI) at 46 sits just under the neutral band on the same chart, suggesting only weak buying pressure within a prevailing bearish framework.
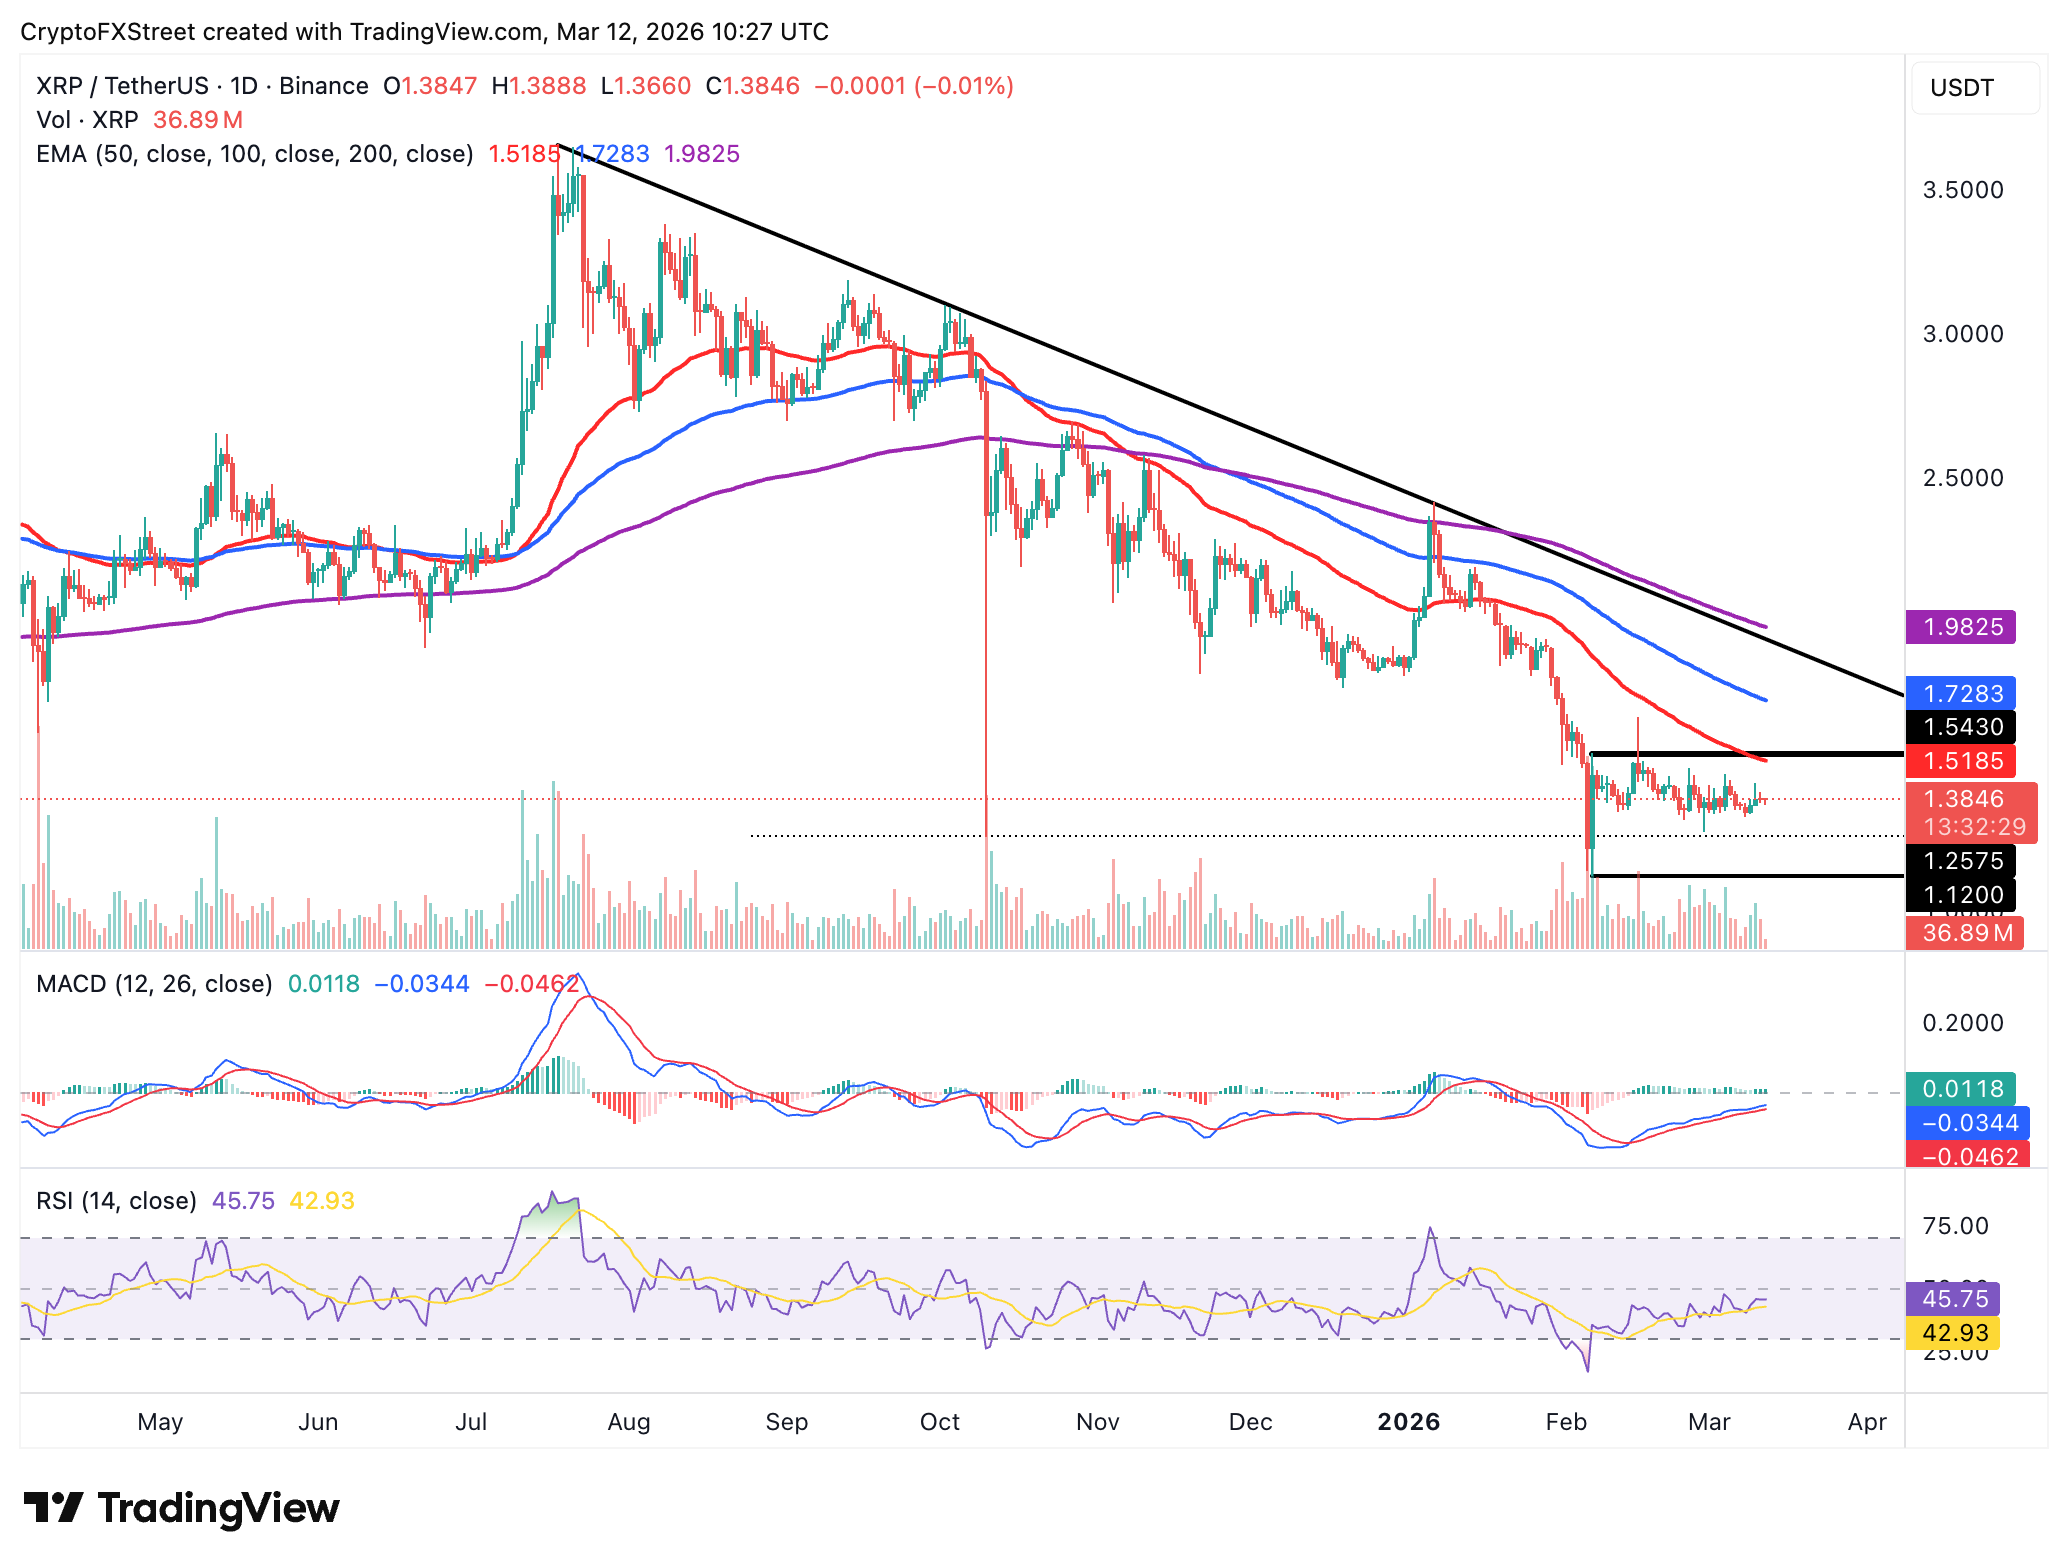
Initial resistance emerges near the recent swing area around $1.41, aligning with Tuesday's high. A break above that threshold exposes XRP to the 50-day EMA at $1.52, where a sustained move through it would be needed to challenge the broader bearish trend as highlighted by the downward sloping 100-day EMA at $1.73 and the 200-day EMA at $1.98.
On the downside, immediate support is seen around the $1.36–$1.35 demand region, with a daily close below this band reinforcing the downtrend and paving the way toward $1.30, then the $1.27 area. As long as price holds below the falling 50-day EMA and the resistance trend line, rallies would be vulnerable to renewed selling into these overhead levels.
Open Interest, funding rate FAQs
Higher Open Interest is associated with higher liquidity and new capital inflow to the market. This is considered the equivalent of increase in efficiency and the ongoing trend continues. When Open Interest decreases, it is considered a sign of liquidation in the market, investors are leaving and the overall demand for an asset is on a decline, fueling a bearish sentiment among investors.
Funding fees bridge the difference between spot prices and prices of futures contracts of an asset by increasing liquidation risks faced by traders. A consistently high and positive funding rate implies there is a bullish sentiment among market participants and there is an expectation of a price hike. A consistently negative funding rate for an asset implies a bearish sentiment, indicating that traders expect the cryptocurrency’s price to fall and a bearish trend reversal is likely to occur.
(The technical analysis of this story was written with the help of an AI tool.)
Recommended Articles


