

Prediction Markets Bet Bearish on BTC, ETH, and Stocks — But Do The Charts Agree?
Prediction markets have become the largest real-time, money-backed sentiment gauge across both crypto and traditional finance. And right now, from Bitcoin to Ethereum to the Fed to NVIDIA, the signal is overwhelmingly bearish.
Here’s what the boldest bets say — and whether the charts agree.
Prediction Market Volume Is Surging Even as Prices Fall
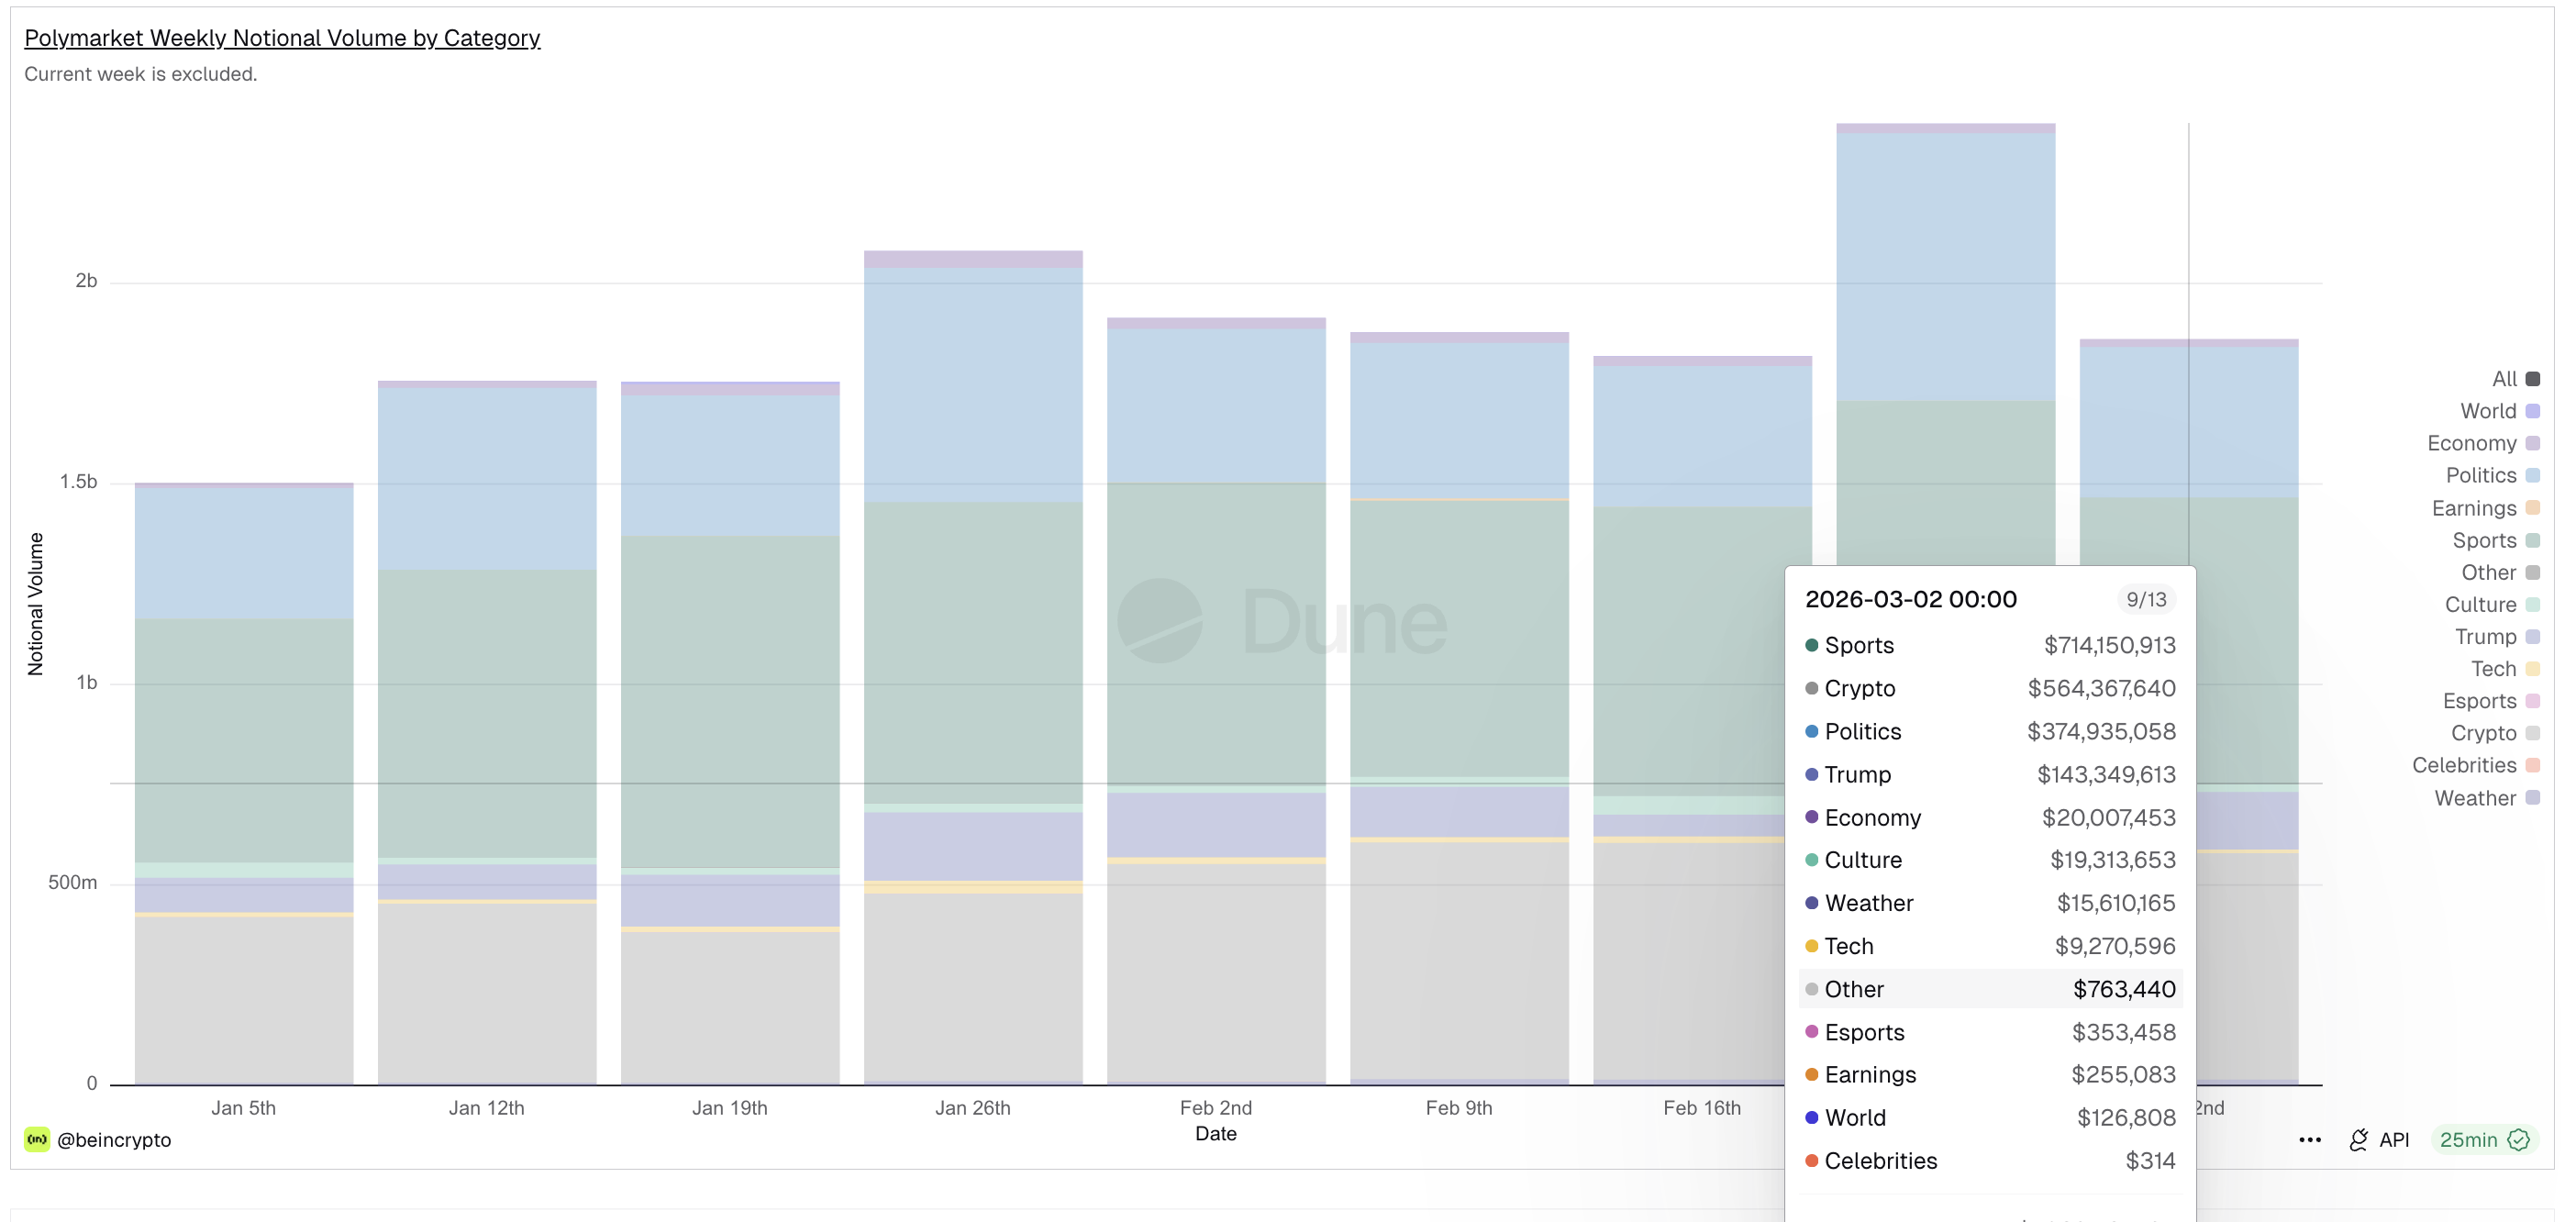
Since the start of 2026, prediction market volume has climbed sharply across platforms and categories. On Polymarket, weekly crypto notional volume rose from $413 million (week ending January 5) to $564 million (week ending March 2).
 Polymarket Volume: Dune
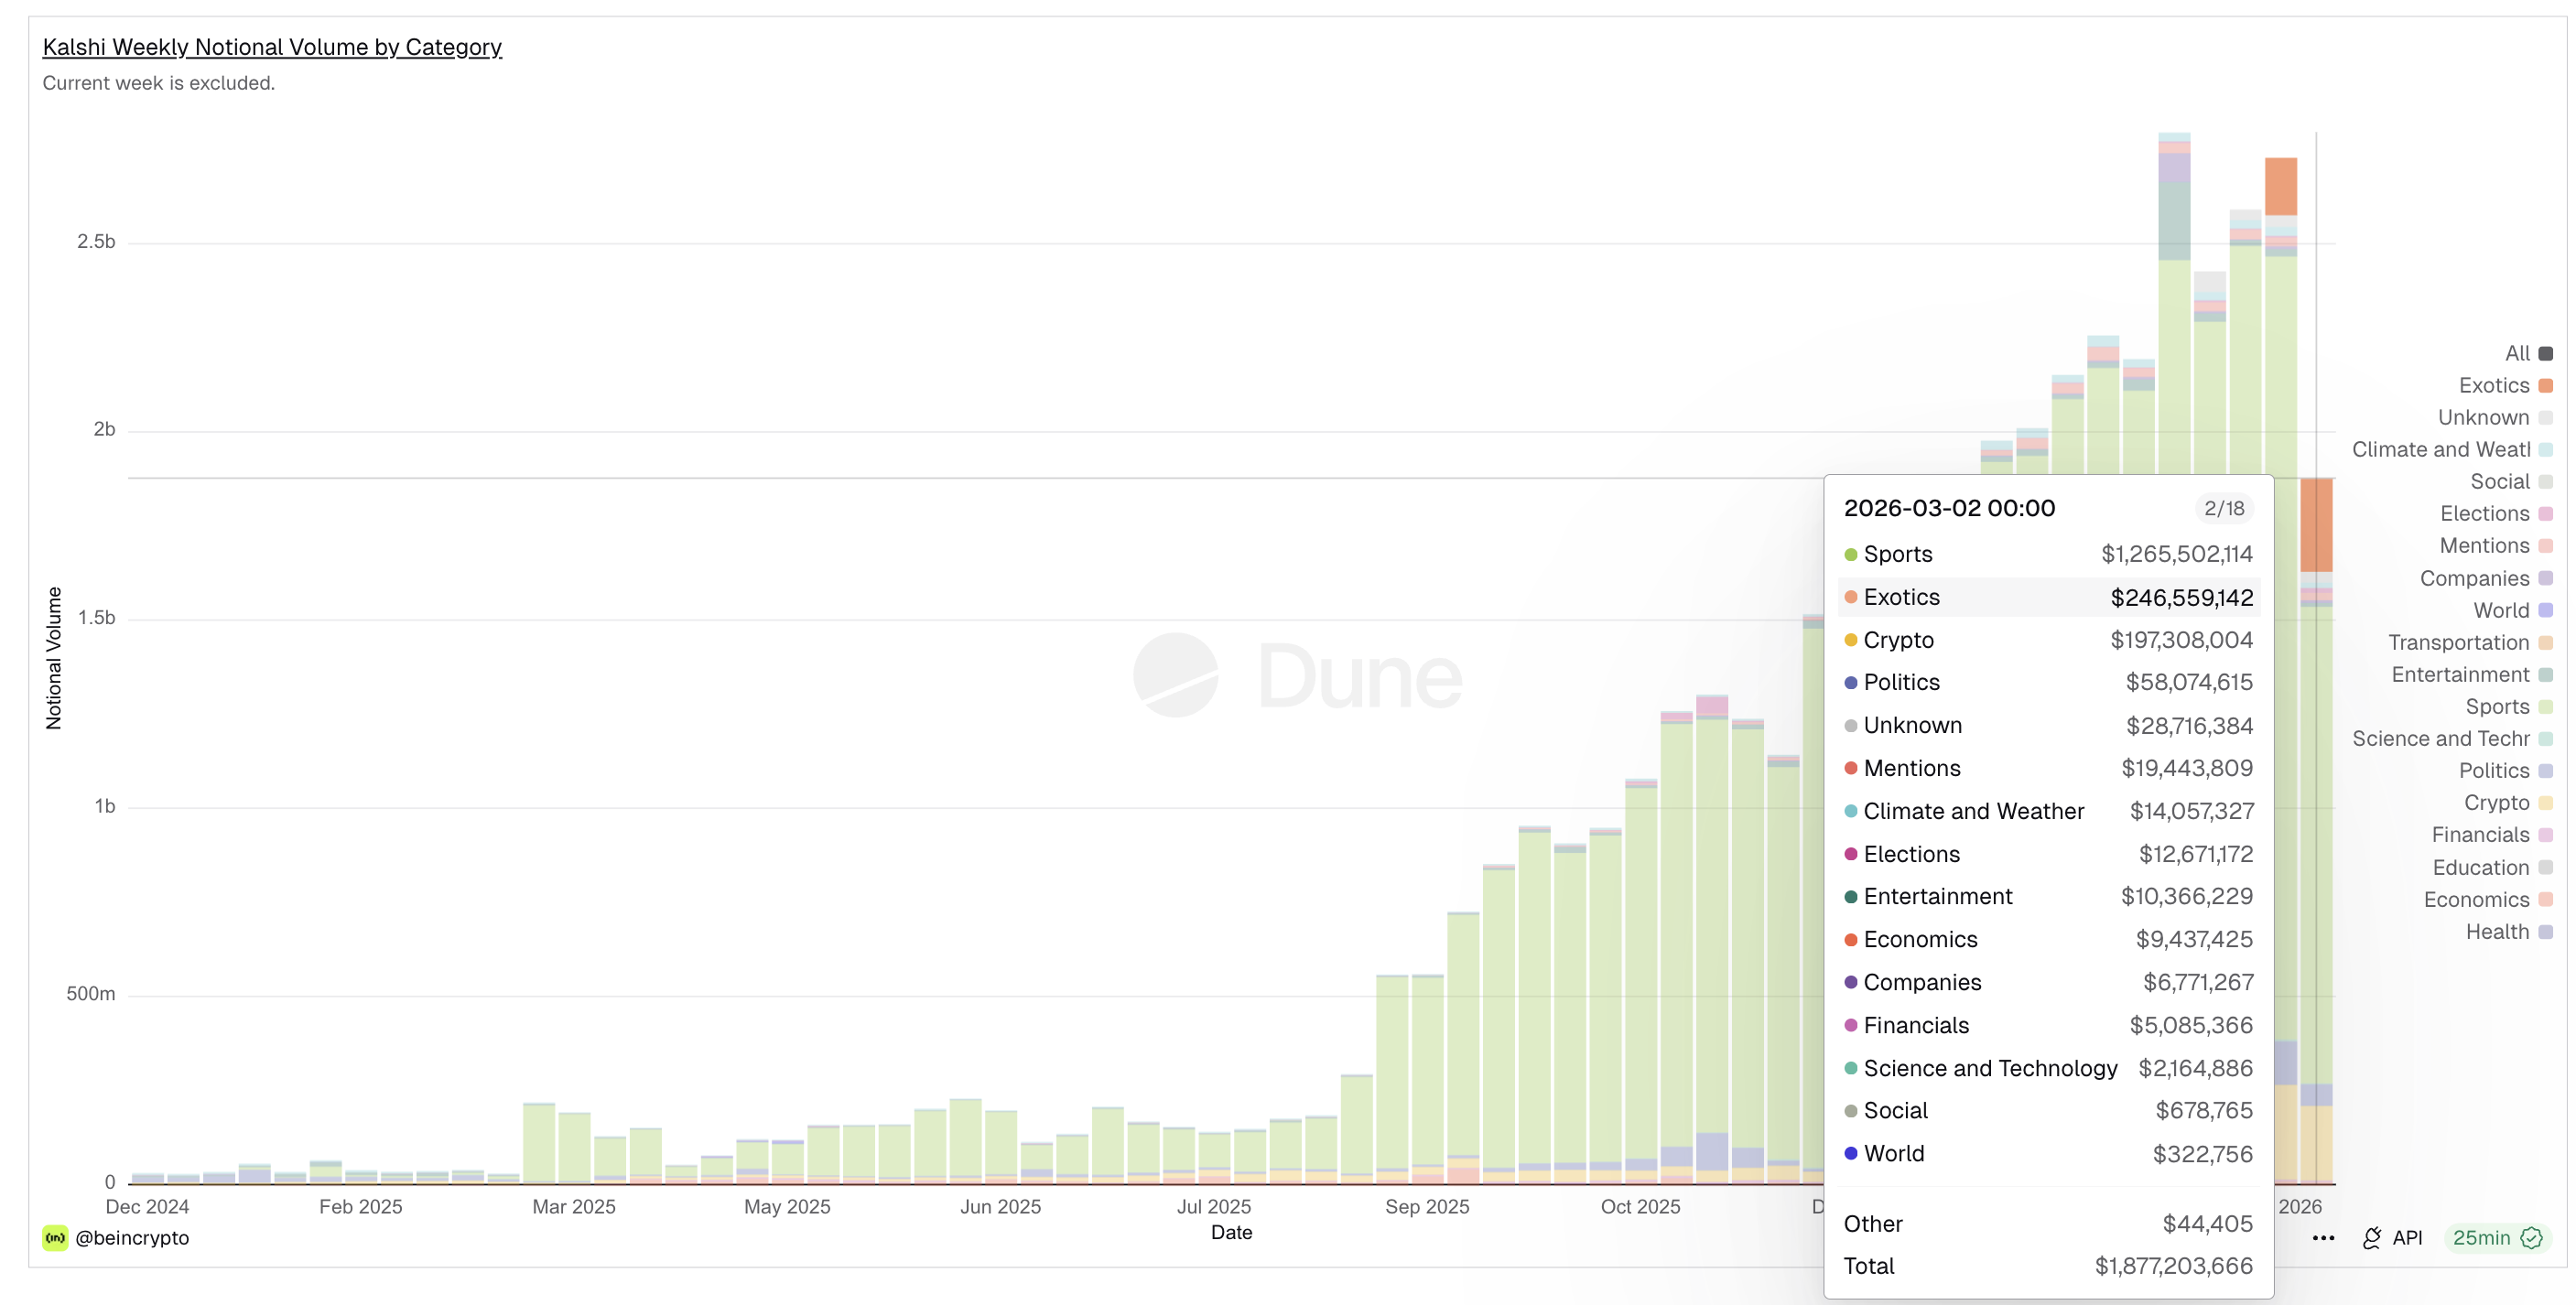
On Kalshi, crypto volume grew over three times in the same period, from roughly $58 million to $197 million.
 Kalshi Volume: Dune
Even Polymarket’s Economy category, covering macro bets like recession odds and Fed decisions, climbed from $13 million to $20 million. Crypto remains the highest non-sports category by notional volume on Polymarket.
What’s notable is that this volume surge came during a period of sharp drawdowns.
Traders aren’t sitting on the sidelines. They’re actively pricing in more downside with real capital. And within that growing volume, a few specific bets stand out — ones that align with key technical and on-chain levels across both crypto and traditional markets.
Bitcoin Under $55,000 — The Realized Price Floor
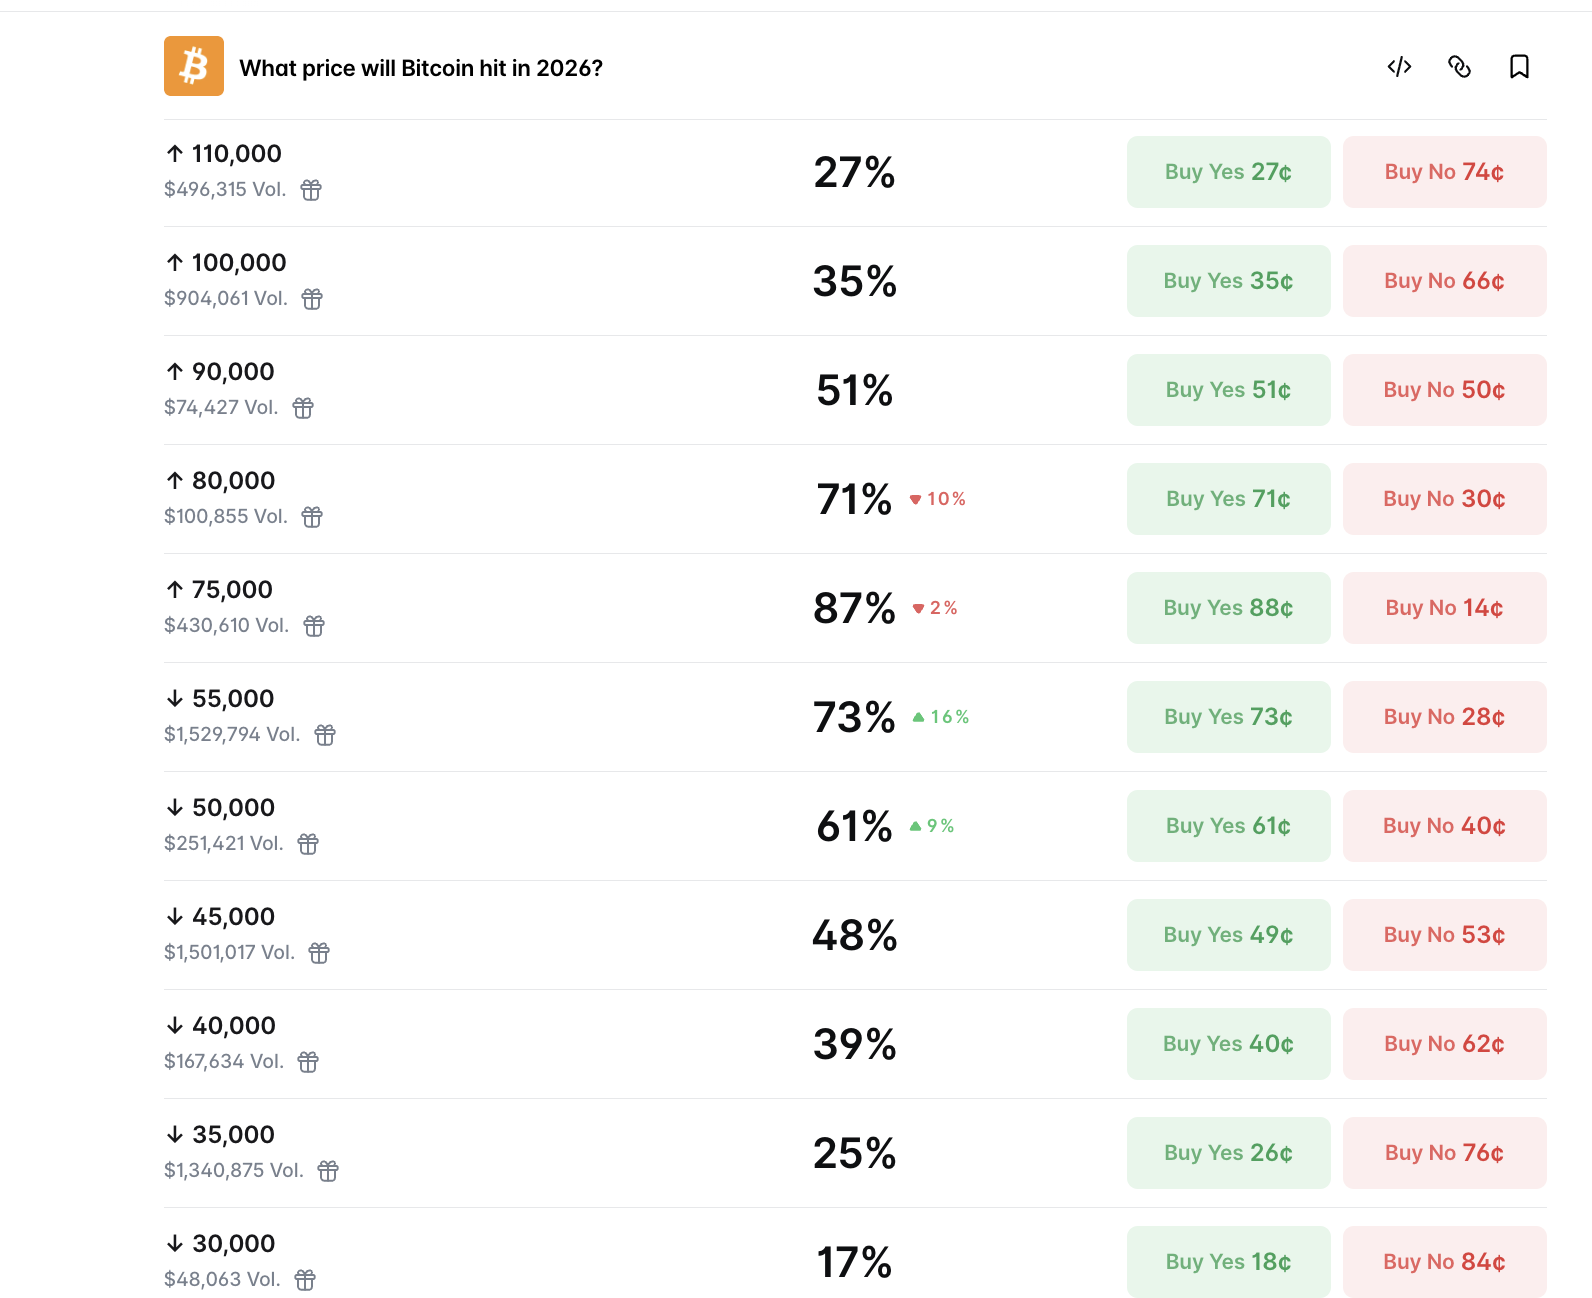
On Polymarket’s “What price will Bitcoin hit in 2026?” market — with $22.5 million in total volume — the above $75,000 outcome leads at 87%. But the momentum is on the bearish side. The fastest-growing outcome is under $55,000, now at 73% (up 16 points). The under $50,000 level sits at 61% (up 9 points).
 BTC Prediction: Polymarket
The on-chain data shows why bettors are clustering around that $55,000 zone.
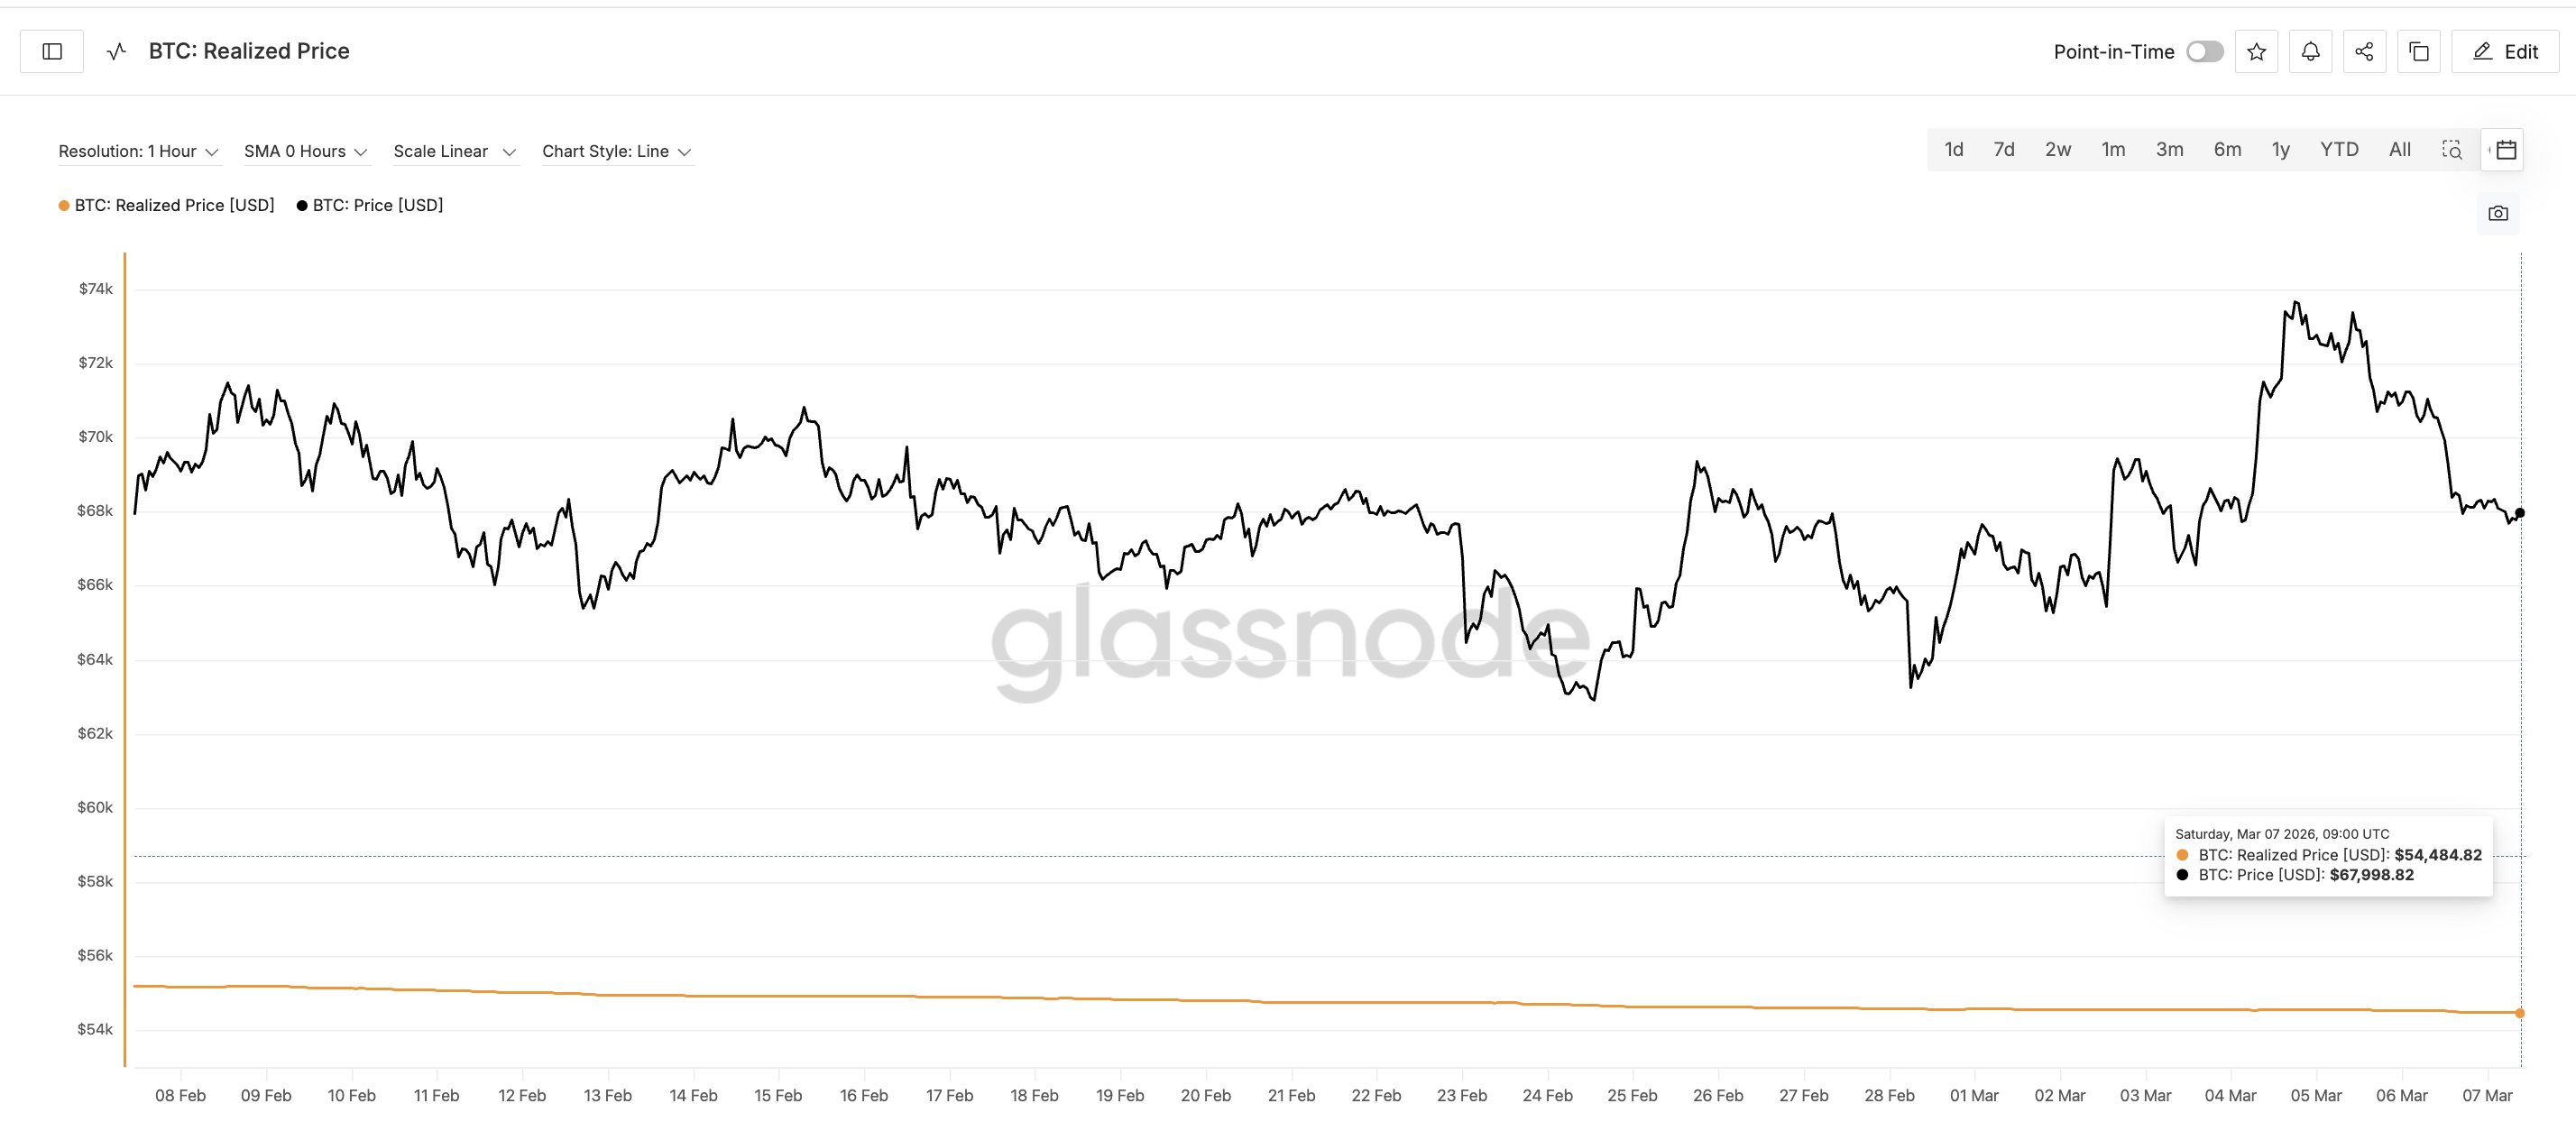
According to Glassnode, Bitcoin’s realized price currently stands at around $54,400. This metric represents the average cost basis of all coins on the network and has historically served as the most reliable cycle floor. In every previous bear market, BTC has either wicked toward or briefly dipped below its realized price before staging a recovery.
Want more token insights like this? Sign up for Editor Harsh Notariya’s Daily Crypto Newsletter here.
 Realized Price Floor: Glassnode
At current prices around $68,000, BTC trades roughly 25% above the realized price. That buffer is meaningful — but narrowing. If the Iran conflict keeps oil prices elevated and delays Fed rate cuts, the $54,000–$55,000 zone becomes the gravitational pull the market can’t ignore. The prediction market crowd isn’t making random calls. They’re pricing in a test of Bitcoin’s most structurally significant support level.
But it’s not just the original cryptocurrency facing bearish positioning. The largest altcoin tells an even more alarming story.
Ethereum Below $1,500? A Bear Flag That Could Break Everything
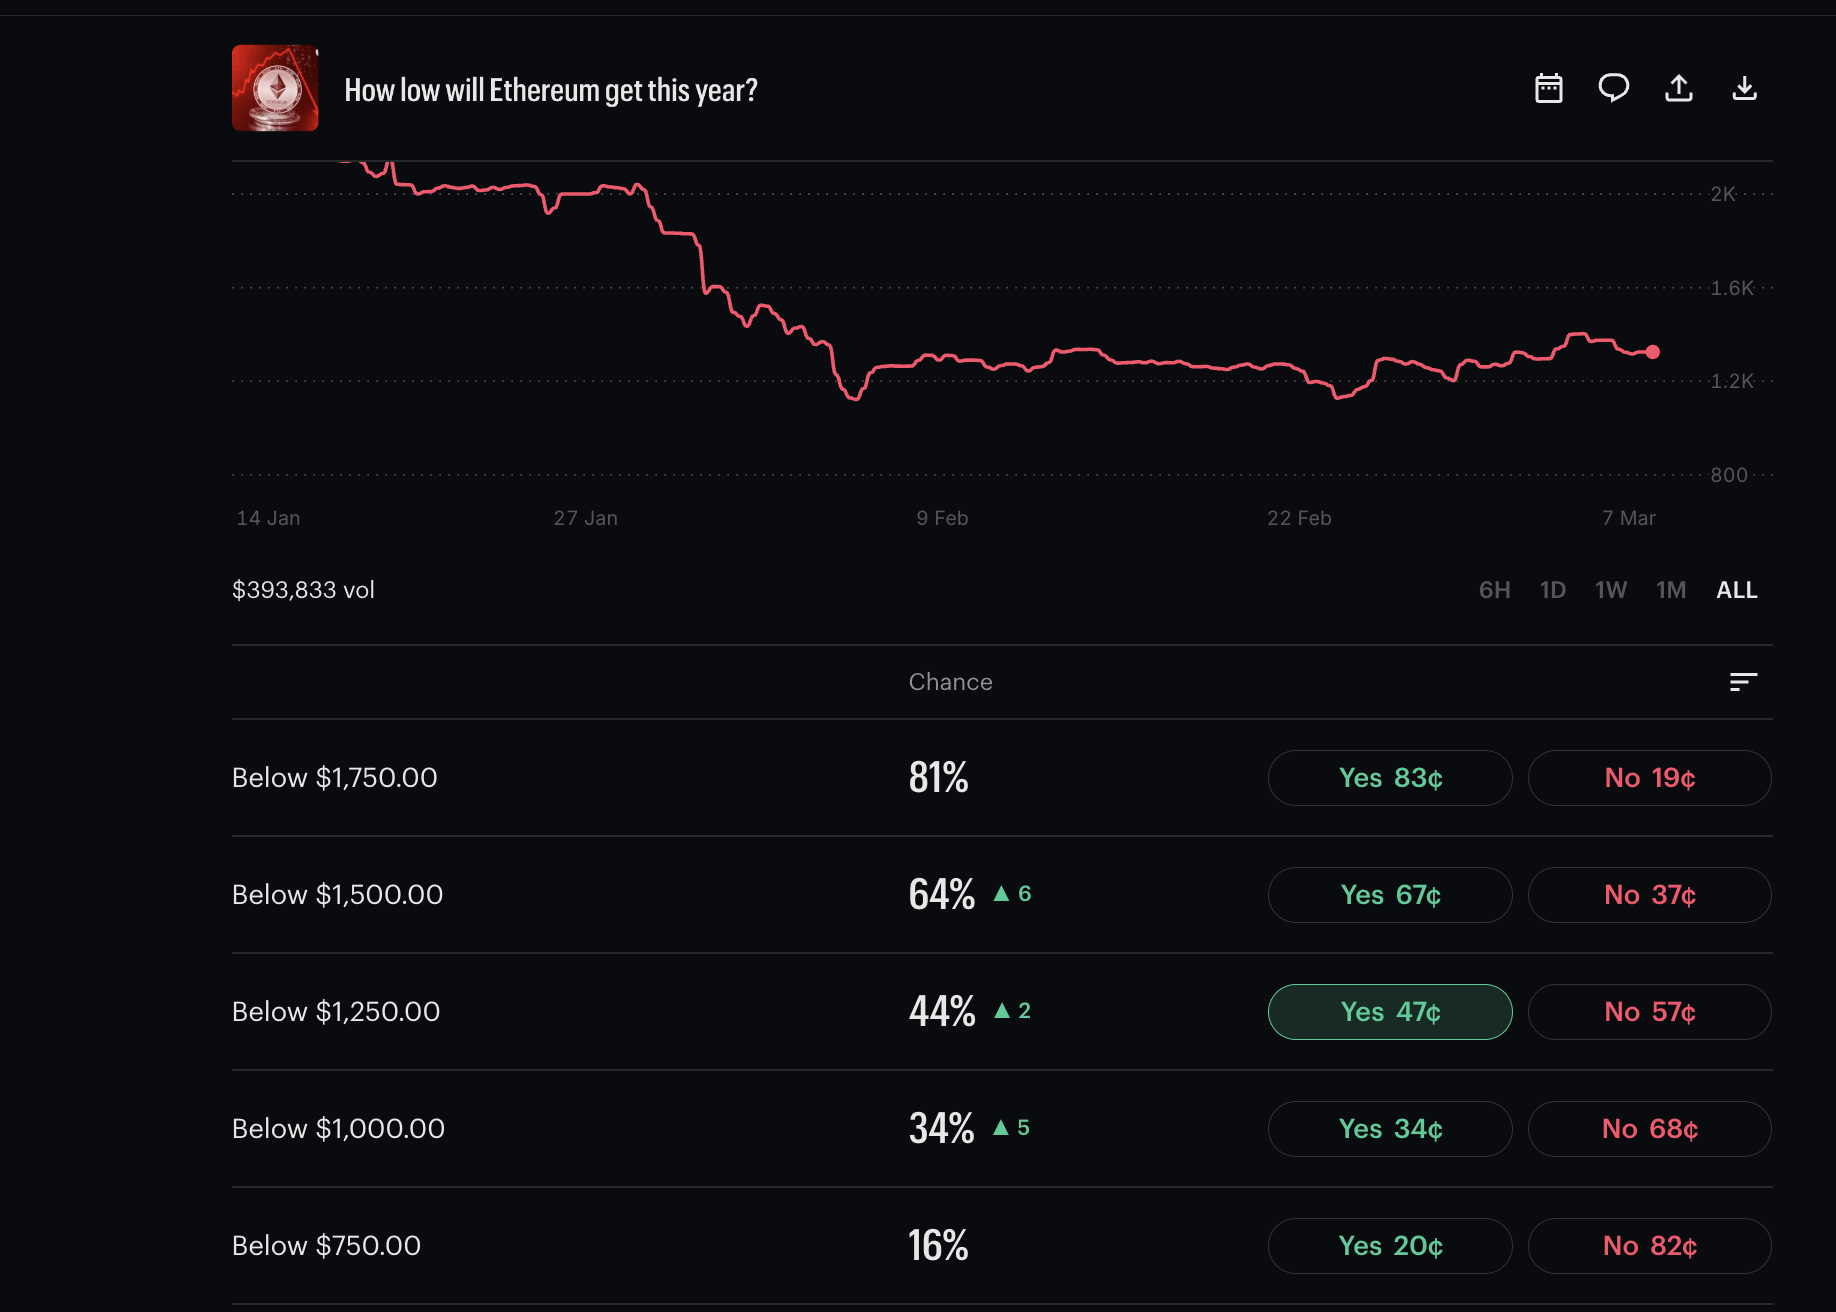
On Kalshi’s “How low will Ethereum get this year?” market, the numbers are stark. Below $1,750 sits at 81%. Below $1,500 is at 64% and climbing (up 6 points). Even below $1,000 is growing at 34% (up 5 points). The Kalshi forecast line has been in freefall since mid-January, currently projecting around $1,330.
 ETH Prediction: Kalshi
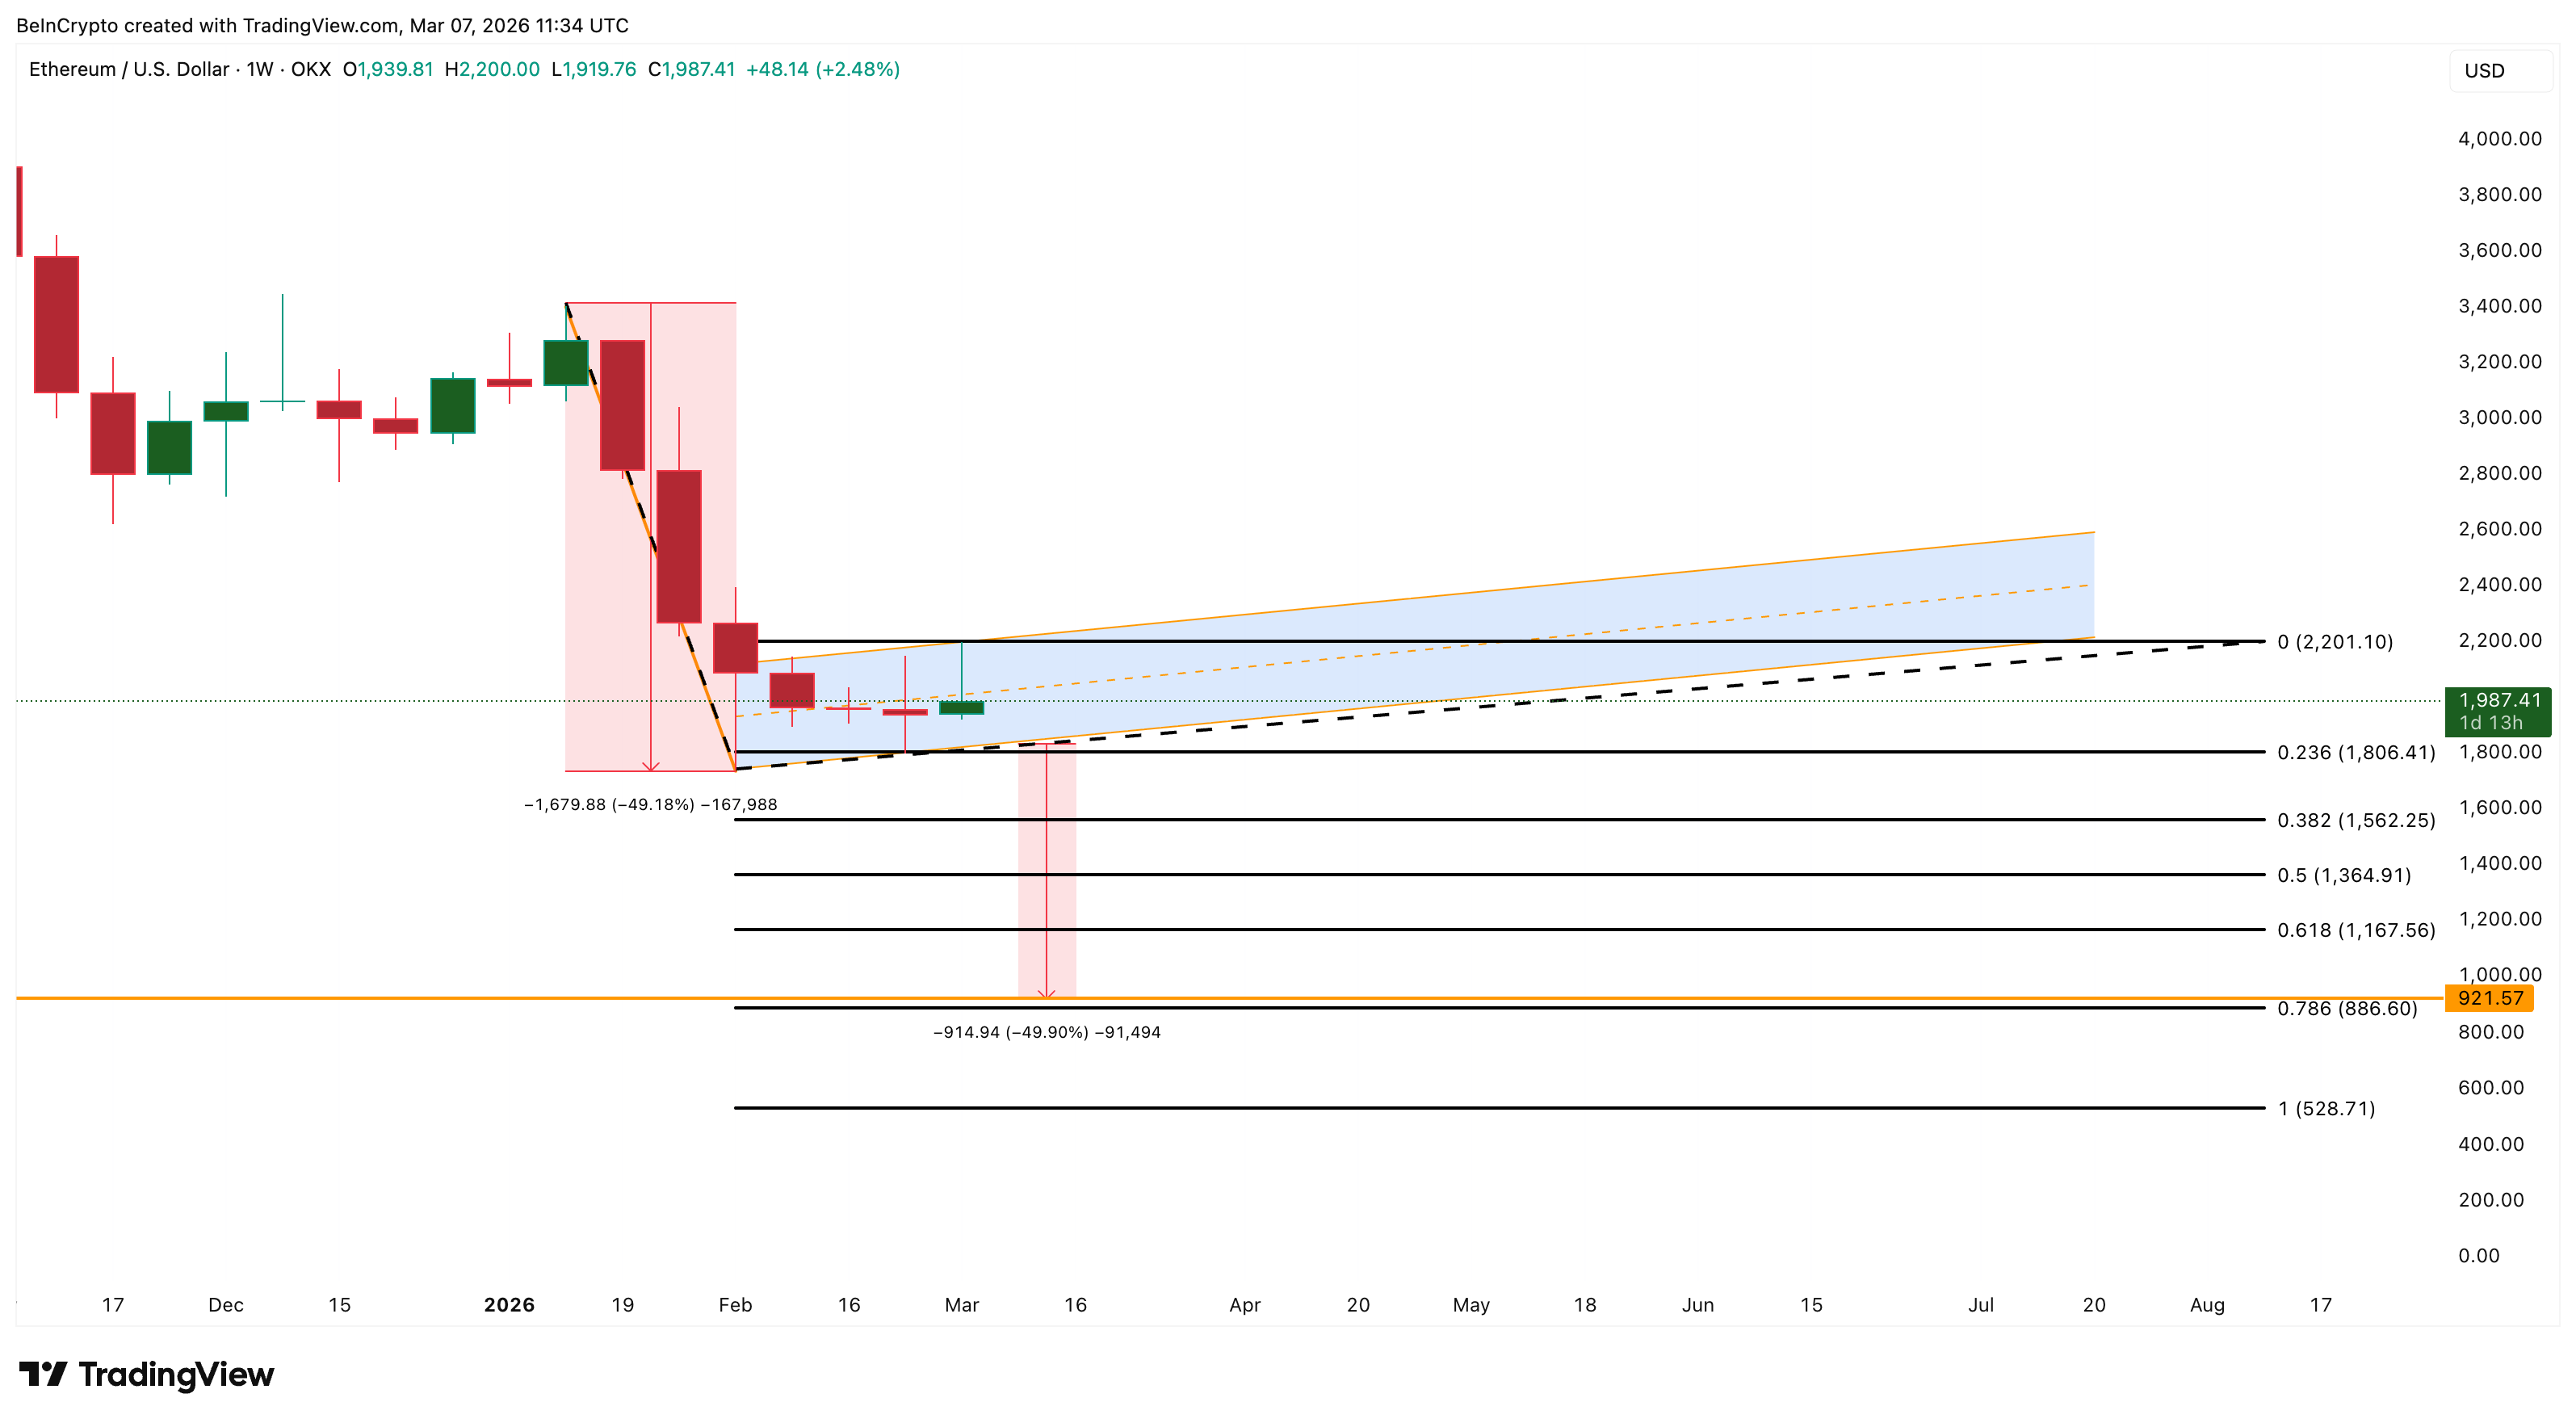
The weekly ETH/USD chart explains the conviction. Since early January, ETH has been forming a clear bear flag — a continuation pattern that typically resolves to the downside. The critical level is the 0.236 Fibonacci retracement at $1,800. A weekly close below this zone would confirm the breakdown, with the immediate target at the 0.382 Fib near $1,560.
 ETH Price Analysis: TradingView
That $1,560 target lines up almost perfectly with the under-$1,500 bet gaining traction on Kalshi. Beyond that, the 0.5 Fib sits at $1,360, which also validates the under-$1,500 bet. The 0.618 Fib level at $1,160 explains why the below-$1250 tier keeps rising. The full measured move of the bear flag projects as low as $920 and validates the rise of the below-$1,000 tier.
One Fed Rate Cut and NVIDIA’s March Outlook: TradFi Joins the Bearish Chorus
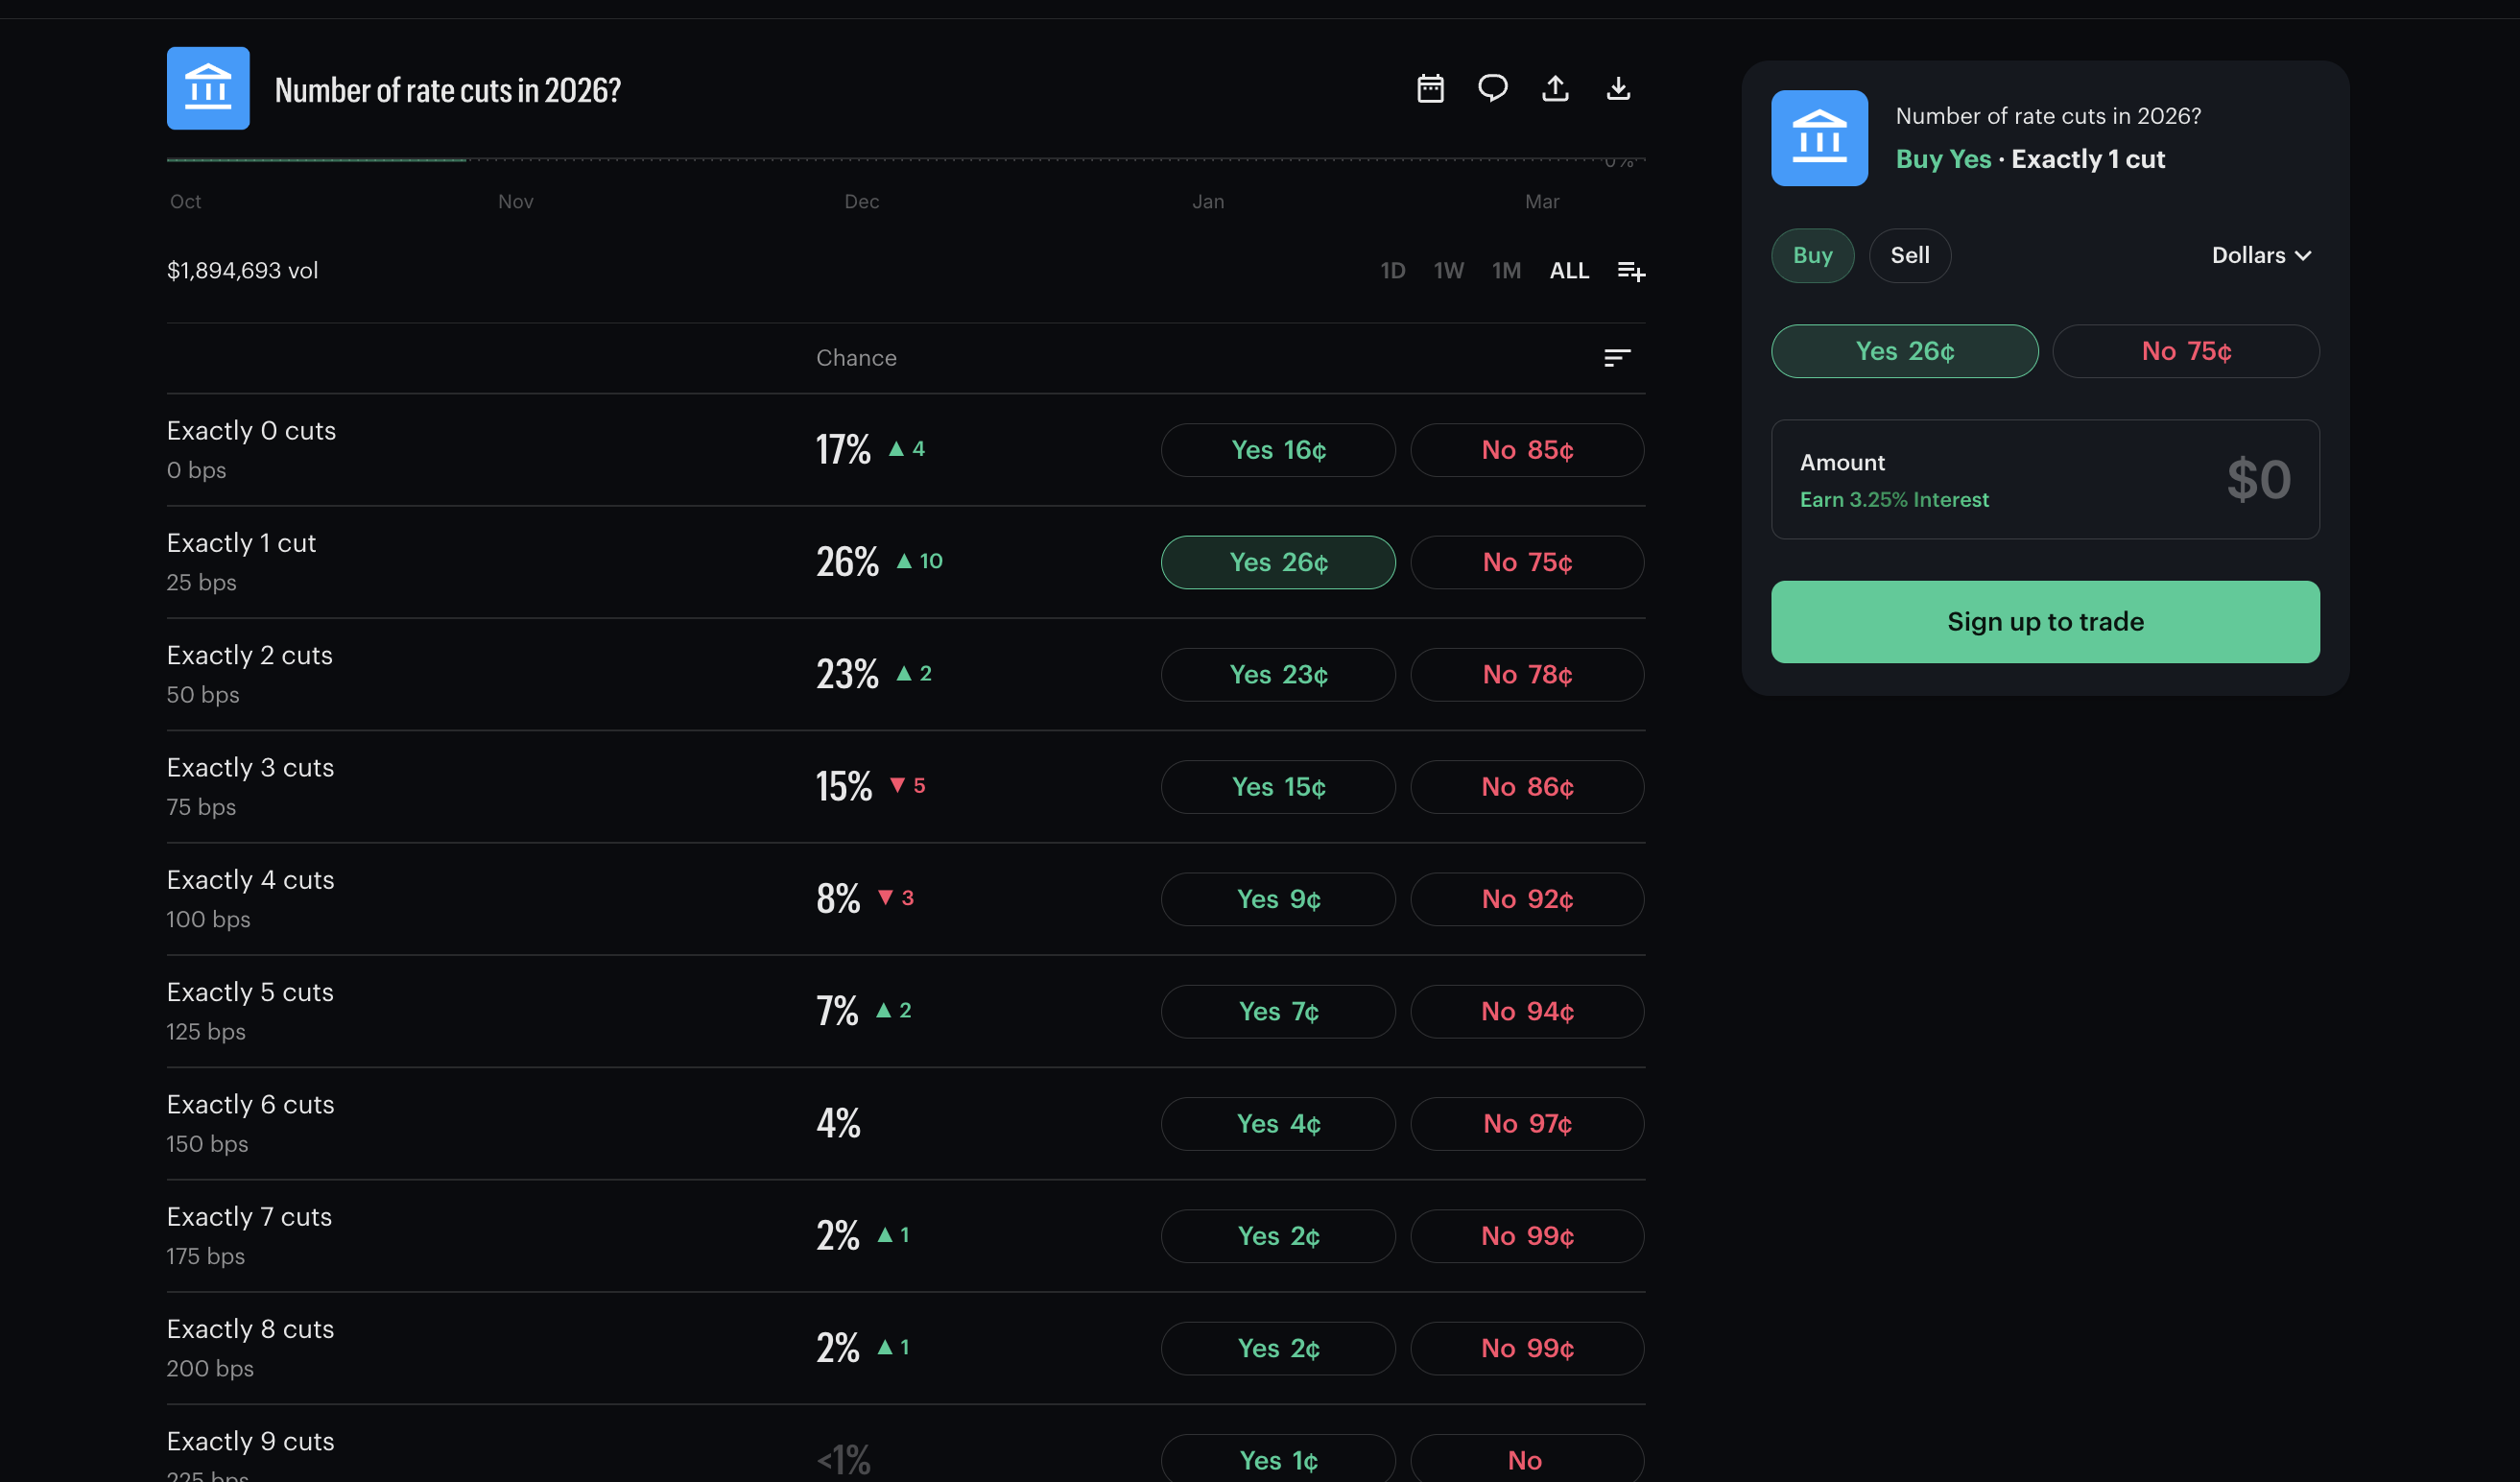
Prediction markets aren’t just bearish on crypto. On Kalshi’s “Number of rate cuts in 2026?” market ($1.89 million in volume), exactly one cut leads at 26% — the biggest gainer, up 10 points. Zero cuts sit at 17% and rising.
 Rate Cuts: Kalshi
The Fed is caught in a stagflation trap. The February jobs report showed the economy unexpectedly lost 92,000 jobs, pushing unemployment to 4.4%, which normally calls for rate cuts.
But oil has surged to $88–90 per barrel after the Iran conflict disrupted shipping through the Strait of Hormuz. Rising energy prices push inflation expectations higher, making rate cuts risky.
One cut is the prediction market’s way of saying: maybe the Fed squeezes in a single move if oil cools.
This macro backdrop spills directly into equities.
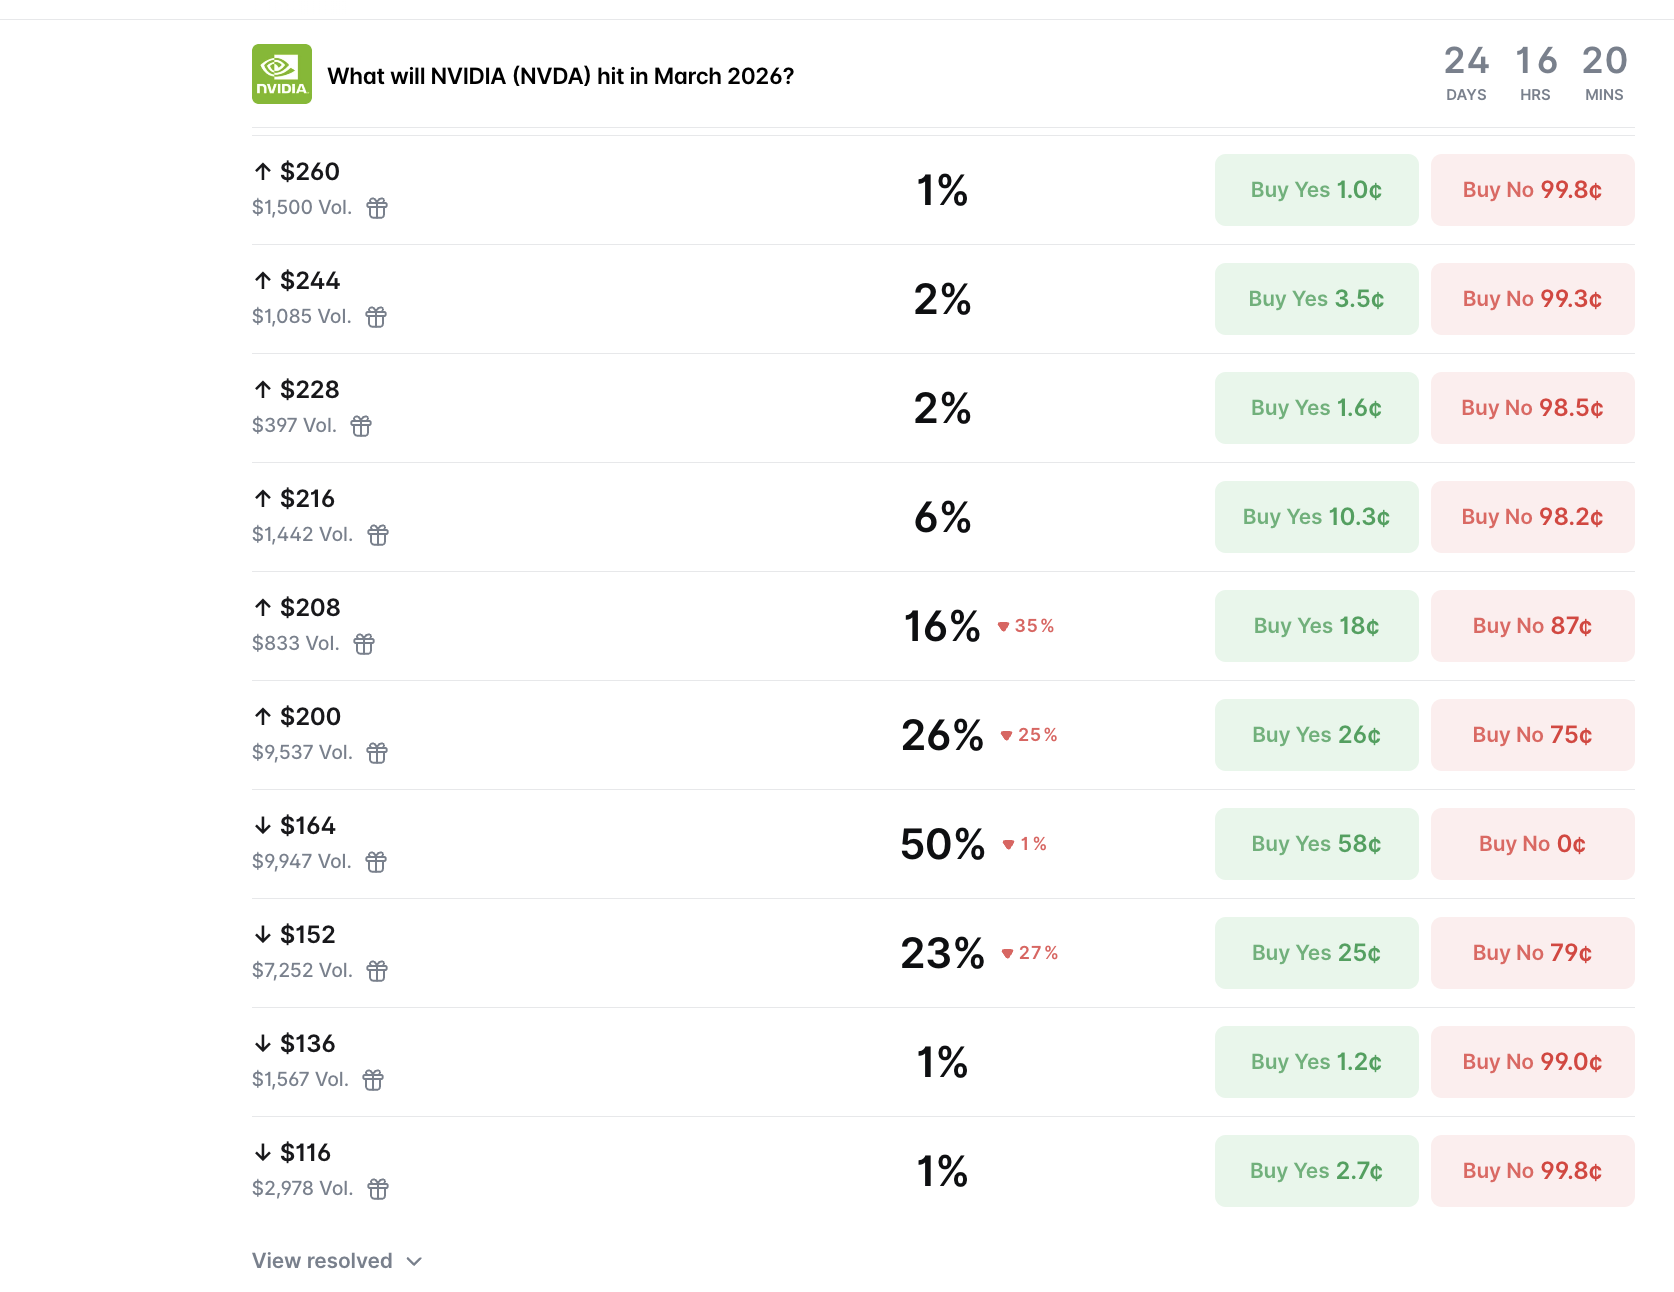
On Polymarket’s “What will NVIDIA hit in March 2026?” market, the majority outcome is under $164 at 50%. NVDA trades around $177 per Friday’s US stock market close.
 Prediction Markets And NVIDIA: Polymarket
The technical chart adds weight to the bearish positioning.
Since early February, NVIDIA’s daily price action has been forming a textbook head and shoulders pattern. The neckline aligns closely with the 0.618 Fibonacci level at $169. A daily close below that level would confirm the pattern breakdown, opening targets at $164 (the 0.786 Fib) and $159, which explains why the under $164 outcome leads on Polymarket at 50%.
On the flip side, if NVIDIA holds above the 0.382 Fib at $175 and reclaims $178-184, the pattern gets invalidated, and the bulls retake control.
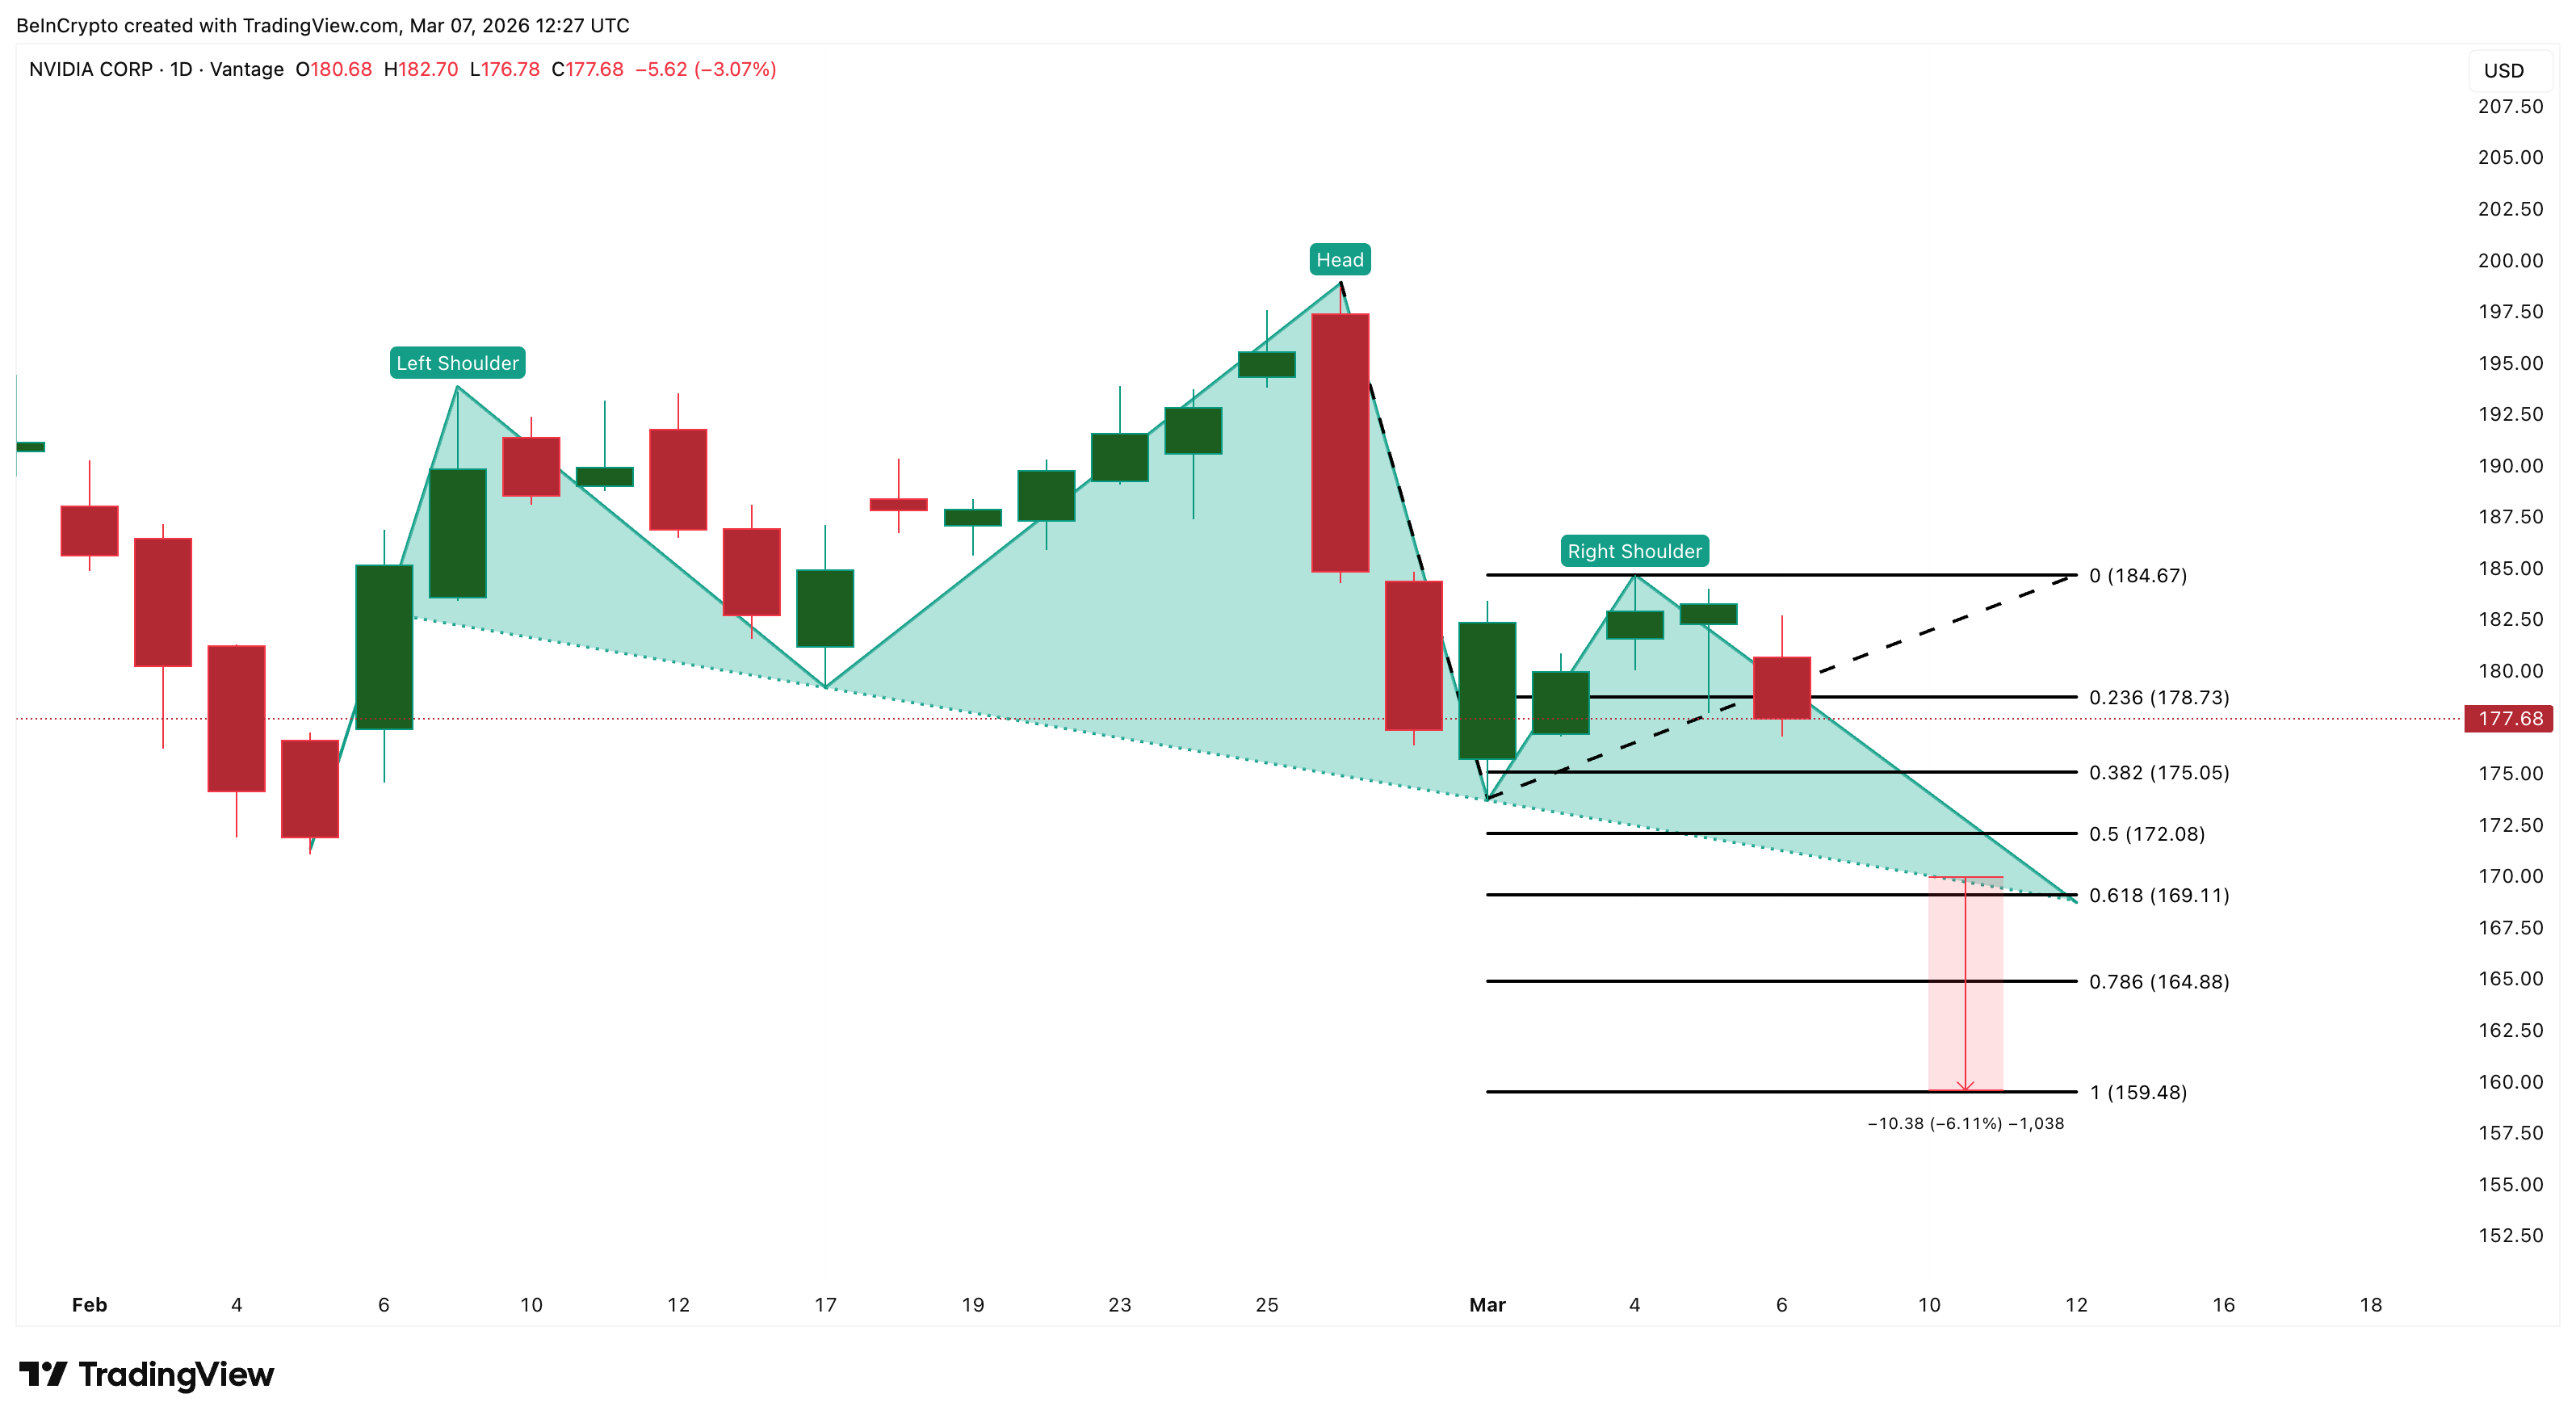 NVIDIA Price Analysis: TradingView
Each of these prediction market bets carries its own invalidation level. But prediction markets have become a real force in gauging where sentiment leans, which currently leans bearish.
Recommended Articles


