

Why Pi Coin Price Needs ‘Cupping Therapy’ to Extend Its Rally by 30%
Pi Coin price has been quietly gaining strength in recent weeks. The token is up roughly 25% over the past month and nearly 7% today, showing renewed momentum after a sluggish phase.
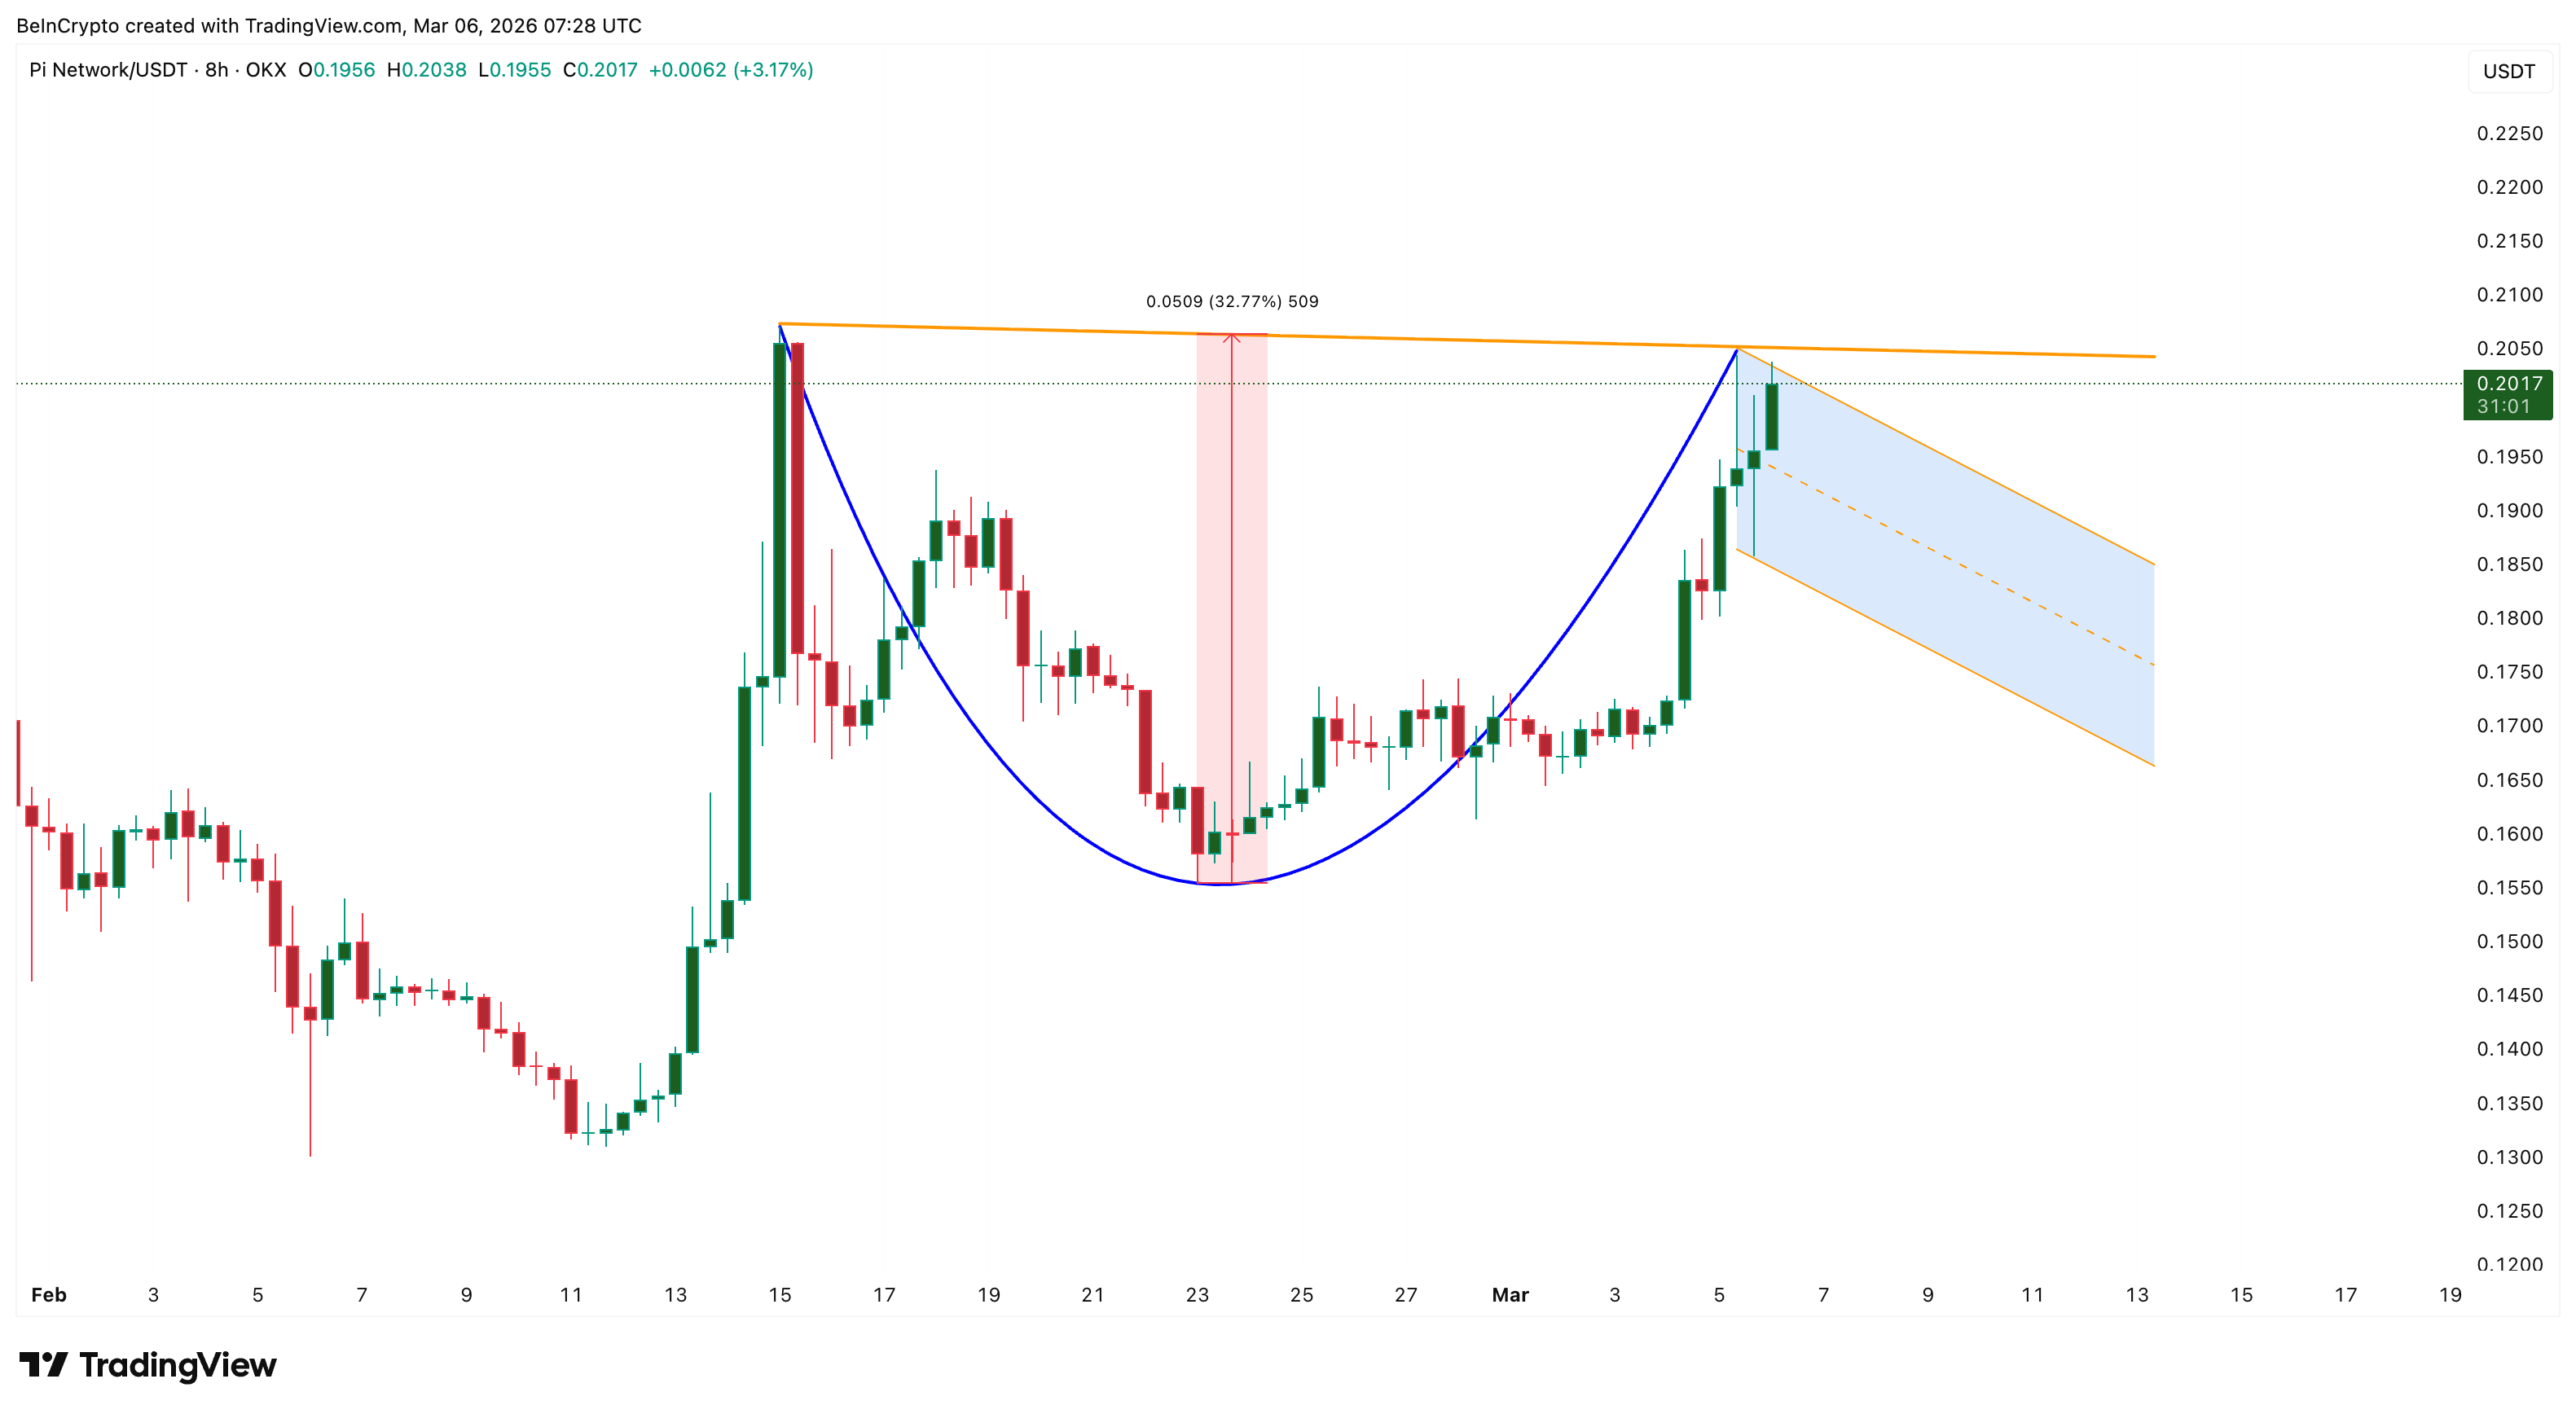
Now, a technical setup on the 8-hour chart suggests the rally may not be over. Pi Coin appears to be forming a cup-and-handle pattern, a bullish continuation structure that often precedes a strong breakout.
But before that breakout happens, the pattern may require some “cupping therapy” — a completed cup followed by a stable handle consolidation. If the setup confirms, Pi Coin could extend its ongoing rally by roughly 30%. Yet, risks remain.
Cup-and-Handle Pattern Signals Potential 30% Rally
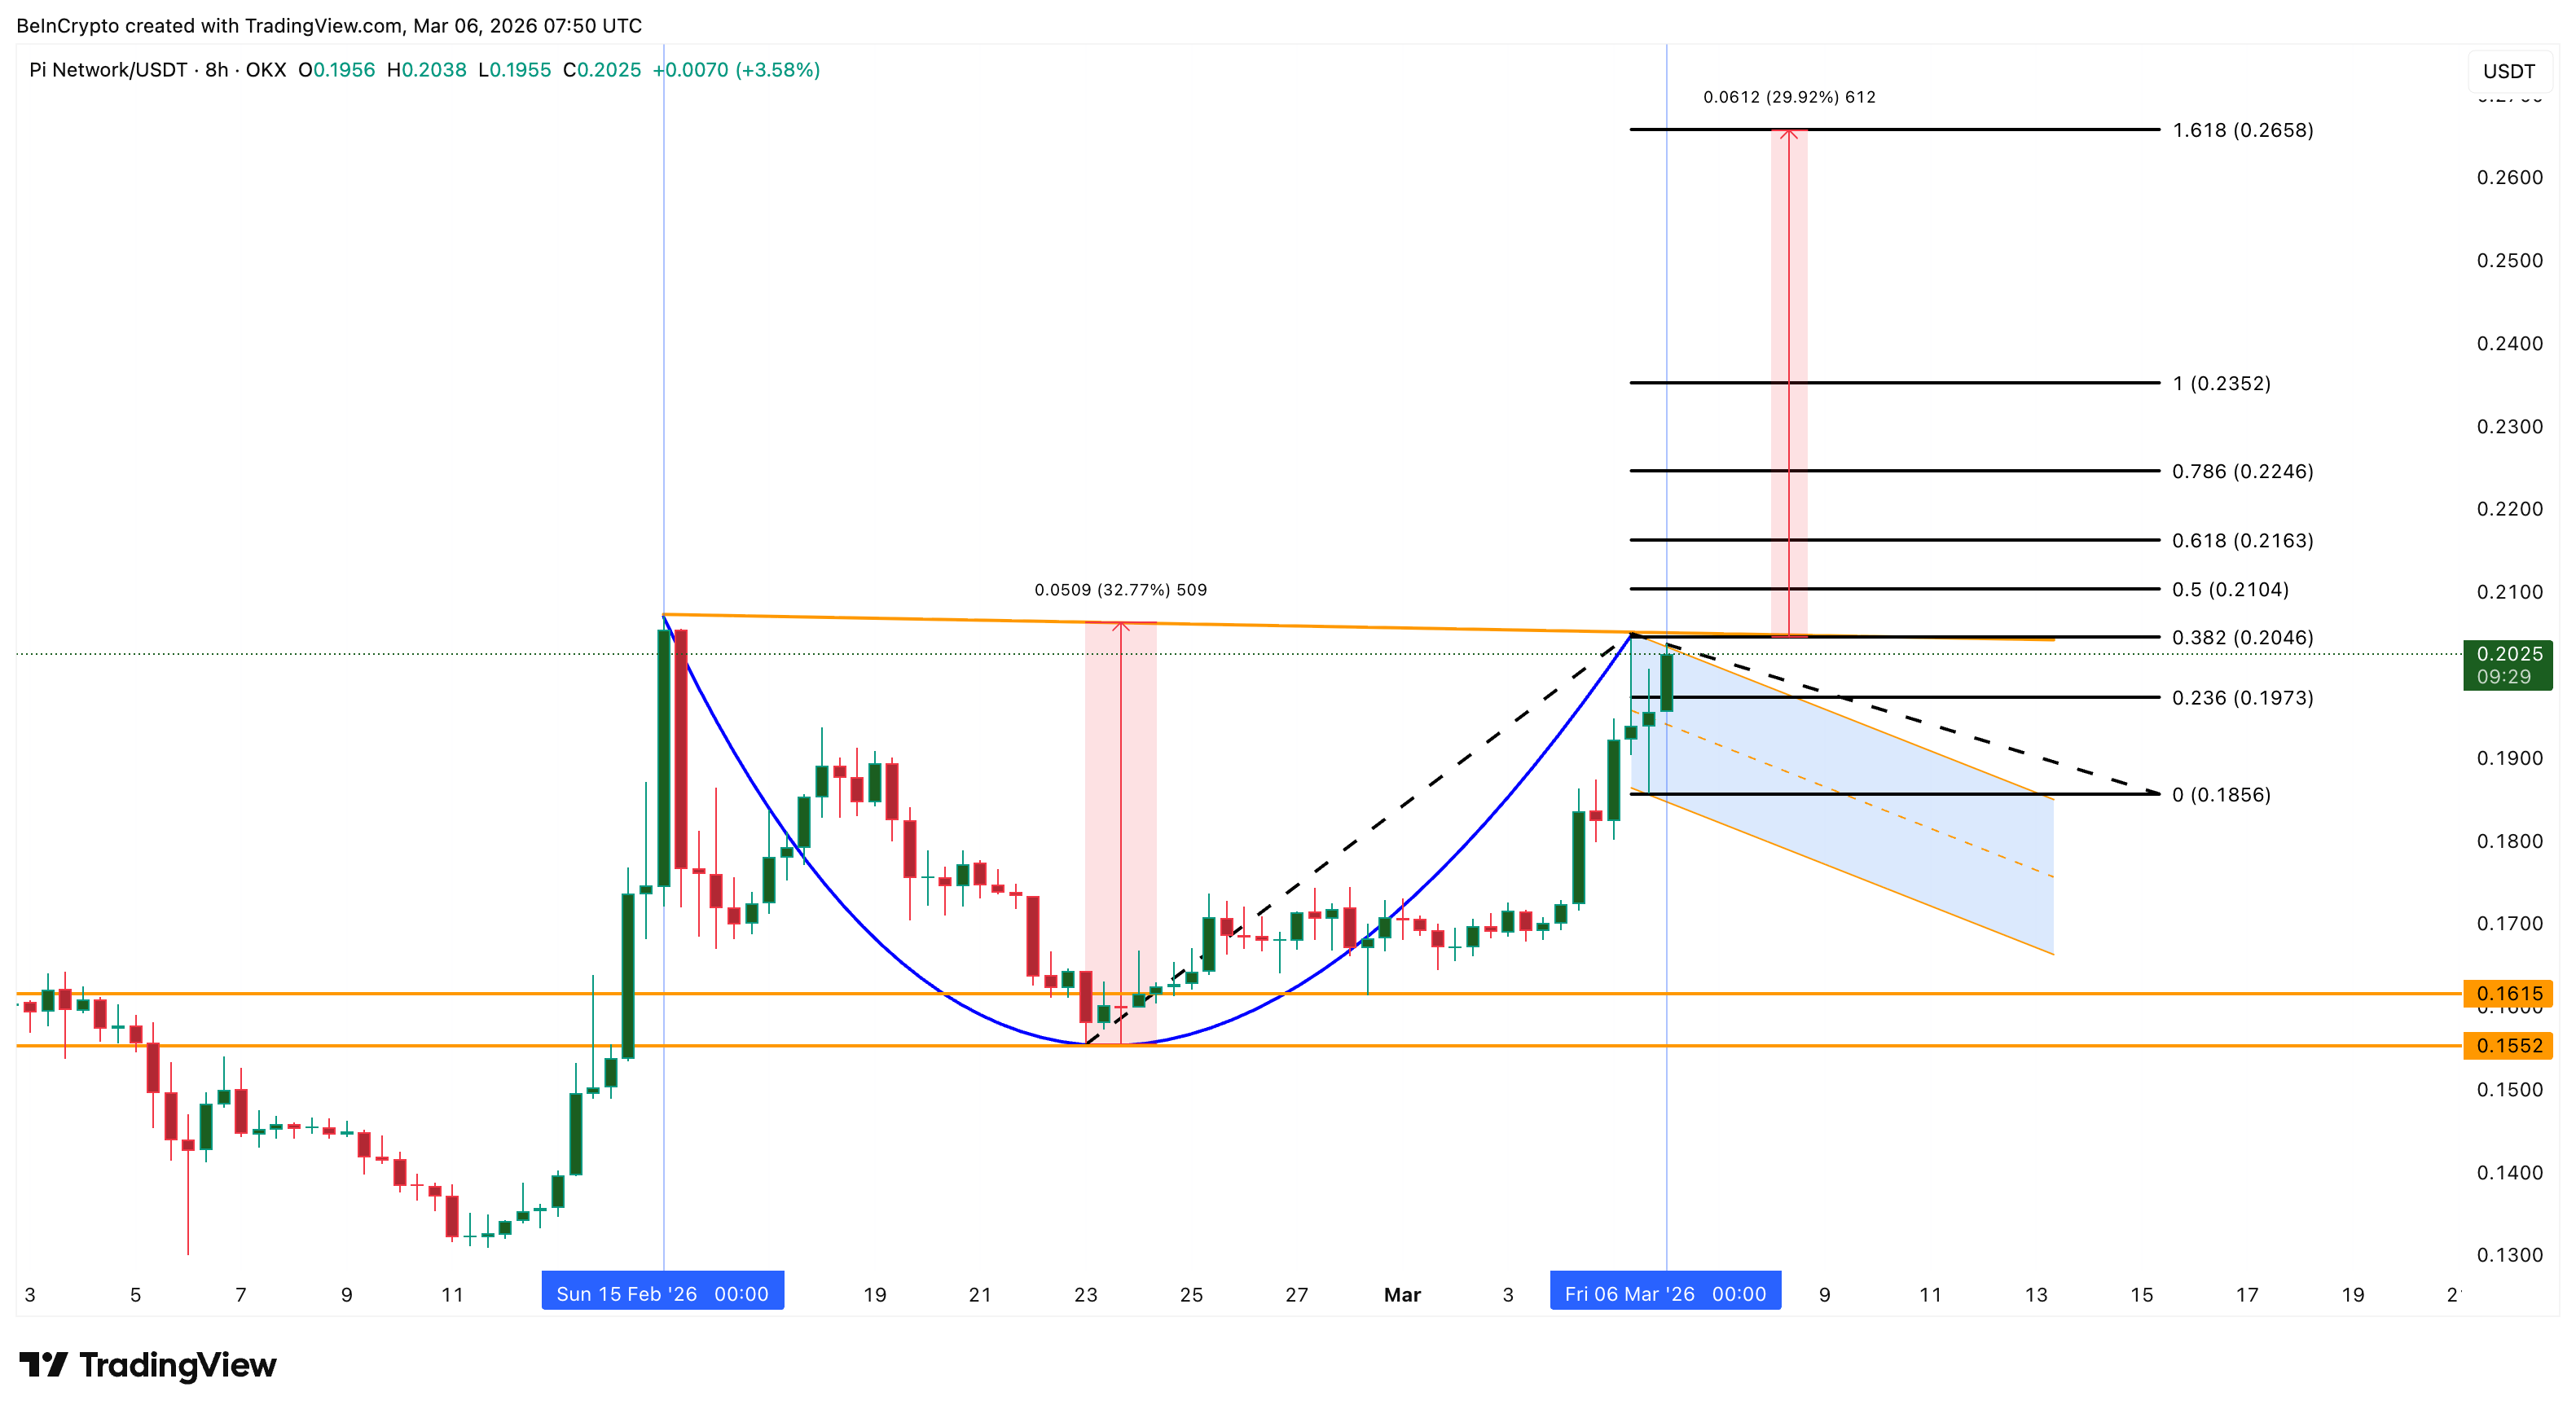
On the 8-hour chart, Pi Coin appears to be forming a clear cup-and-handle structure. The cup started forming after Pi Coin reached a local high around February 15. From there, the PI price gradually curved downward before recovering again in early March, creating the rounded base typical of the pattern. The cup developed cleanly between February 15 and March 5.
 Pi Coin Price Structure: TradingView
The current pullback appears to be shaping the handle, which usually acts as the final consolidation phase before a breakout. If Pi Coin secures an 8-hour close above the neckline, it can surge by per the pattern’s measured move.
That would represent roughly a 30% move higher from current levels, extending the token’s ongoing rally. However, price structure alone does not confirm the move. Money-flow indicators provide additional clues.
Big Money Divergence Shows Capital Flowing Into Pi Coin
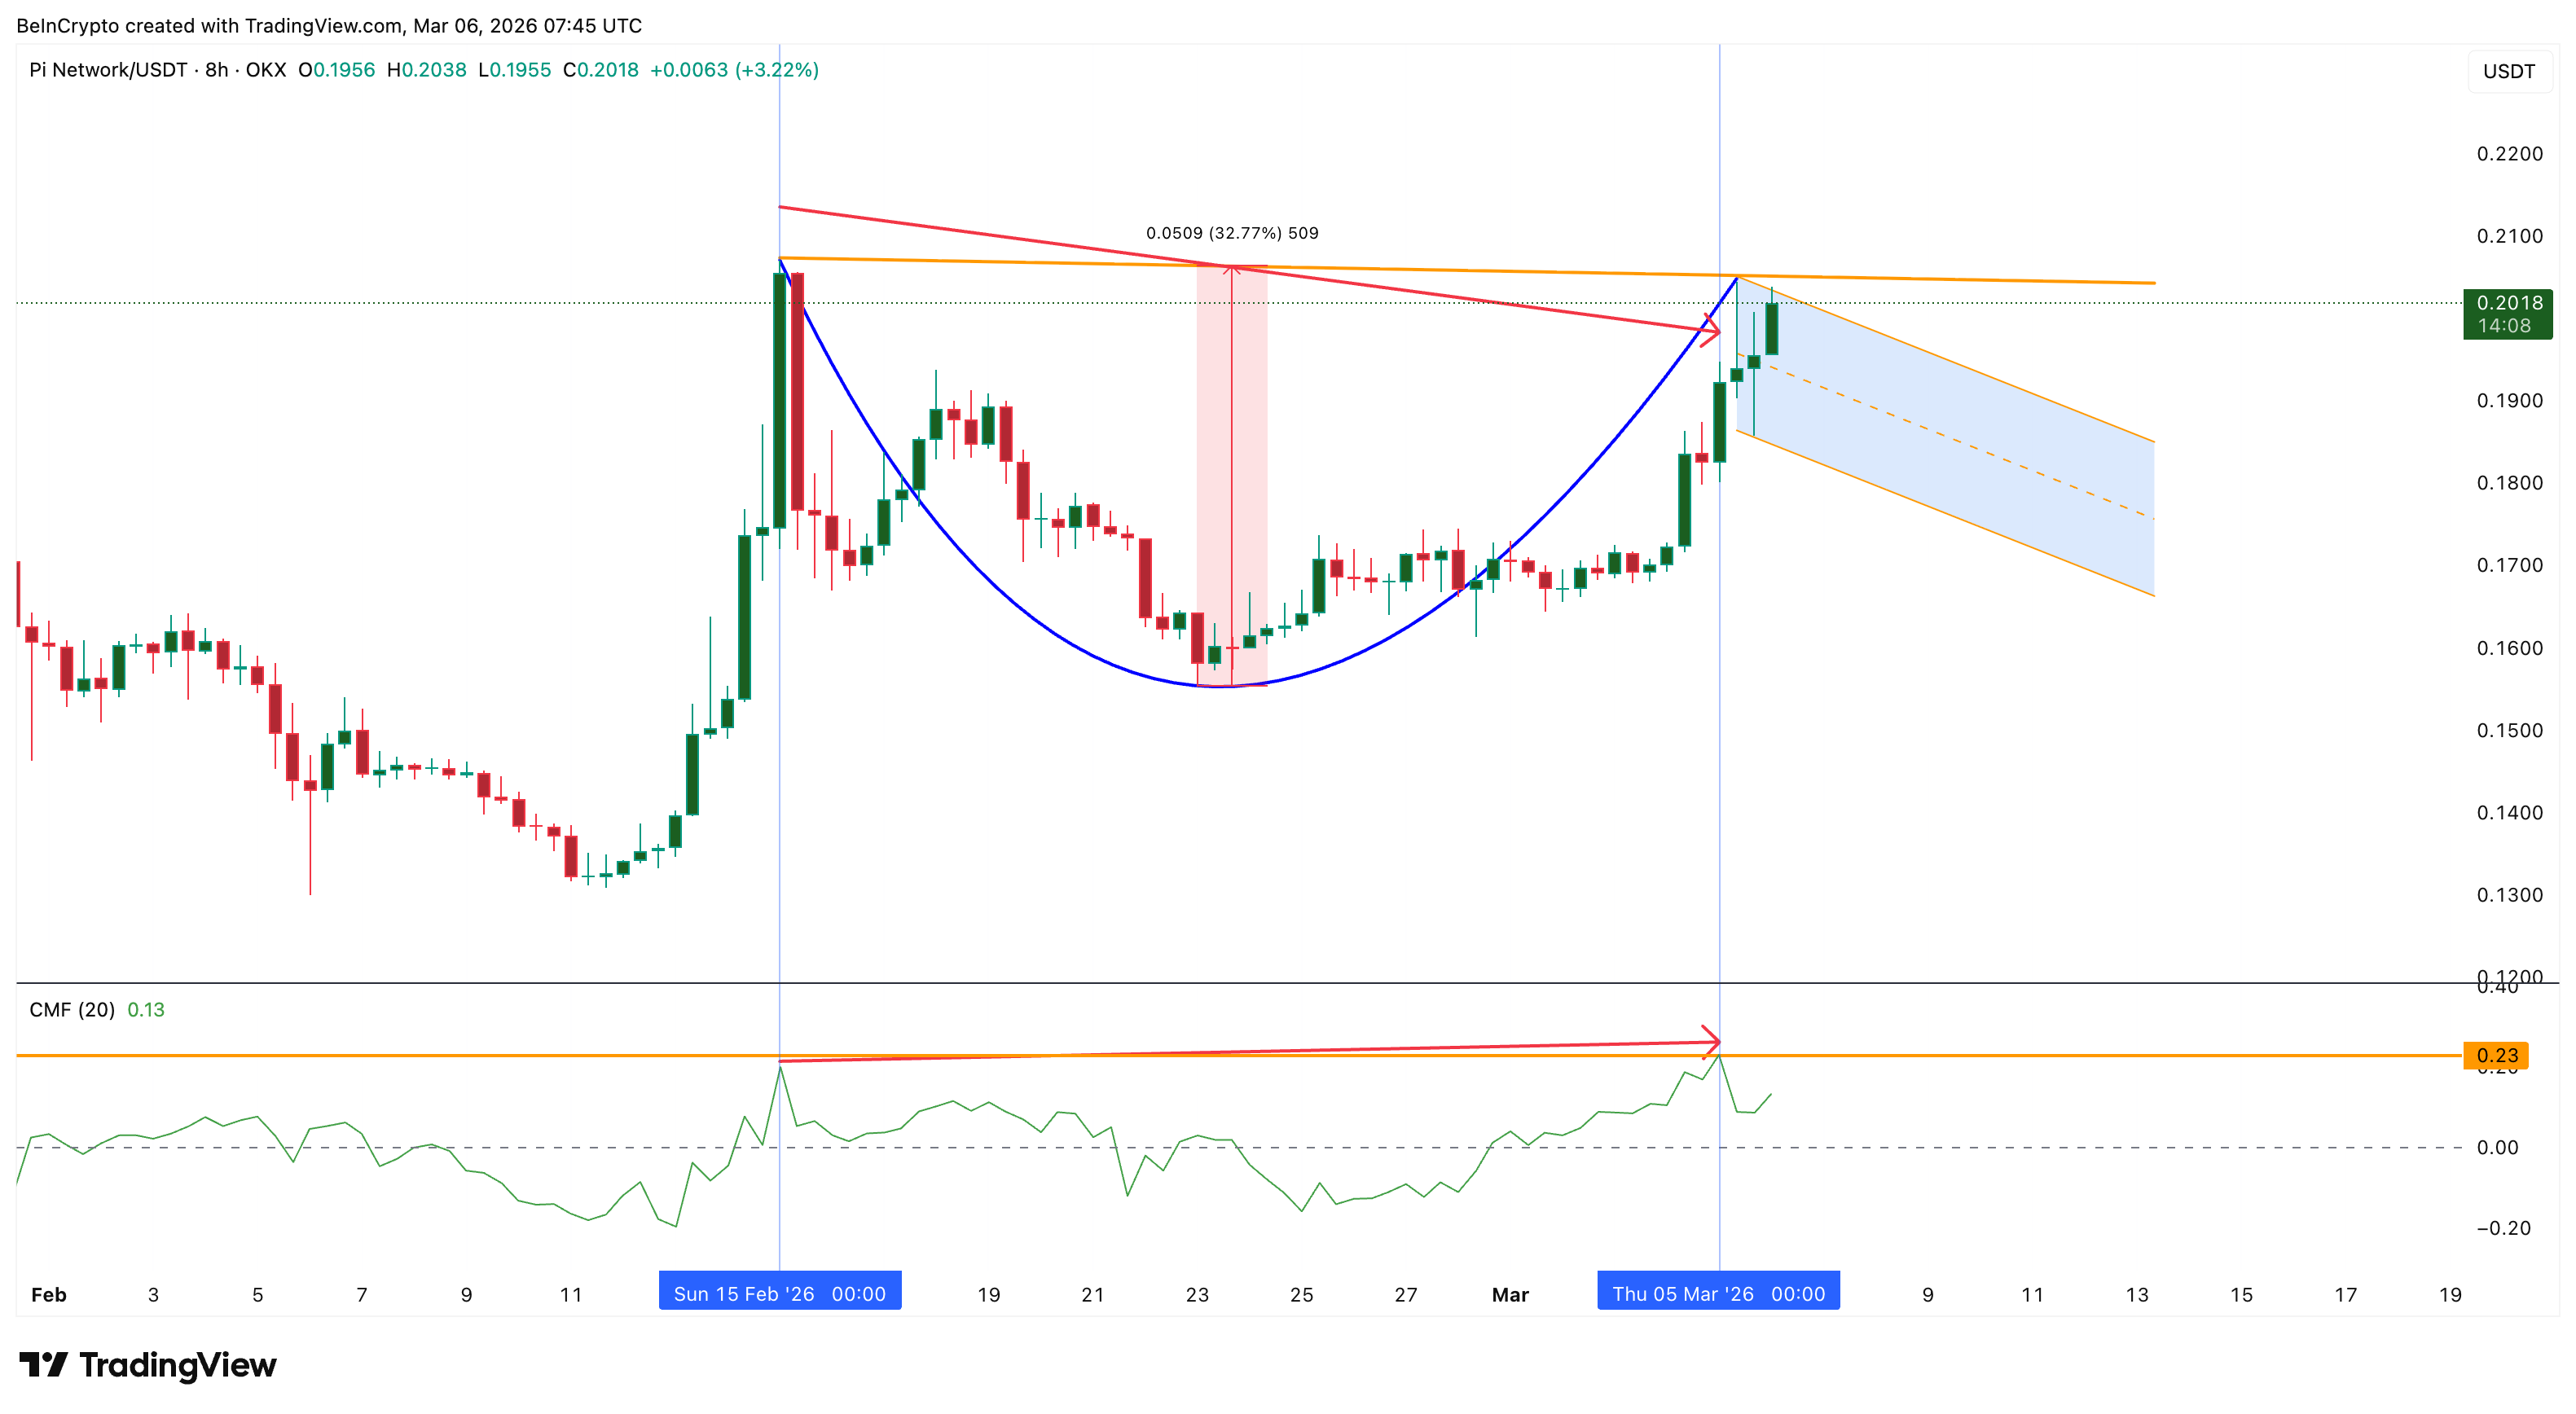
During the same period, when the cup was developing between February 15 and March 5, the Chaikin Money Flow (CMF) indicator began trending higher. The Pi Coin price, on the other hand, trended slightly lower during that time, as validated by the downsloping pattern neckline.
CMF measures big capital flows by combining price and trading volume. While Pi Coin’s price trended lower, the CMF indicator continued rising. This divergence suggests that capital has been entering the asset even while price momentum slowed.
 CMF Rises: TradingView
Currently, CMF sits near 0.12. If the indicator rises above 0.23, it would mark a new local high and strengthen the probability of a breakout above the cup neckline. Interestingly, sentiment data suggests traders are already becoming more optimistic about the asset.
Sentiment Surge and Retail Participation Send Mixed Signals
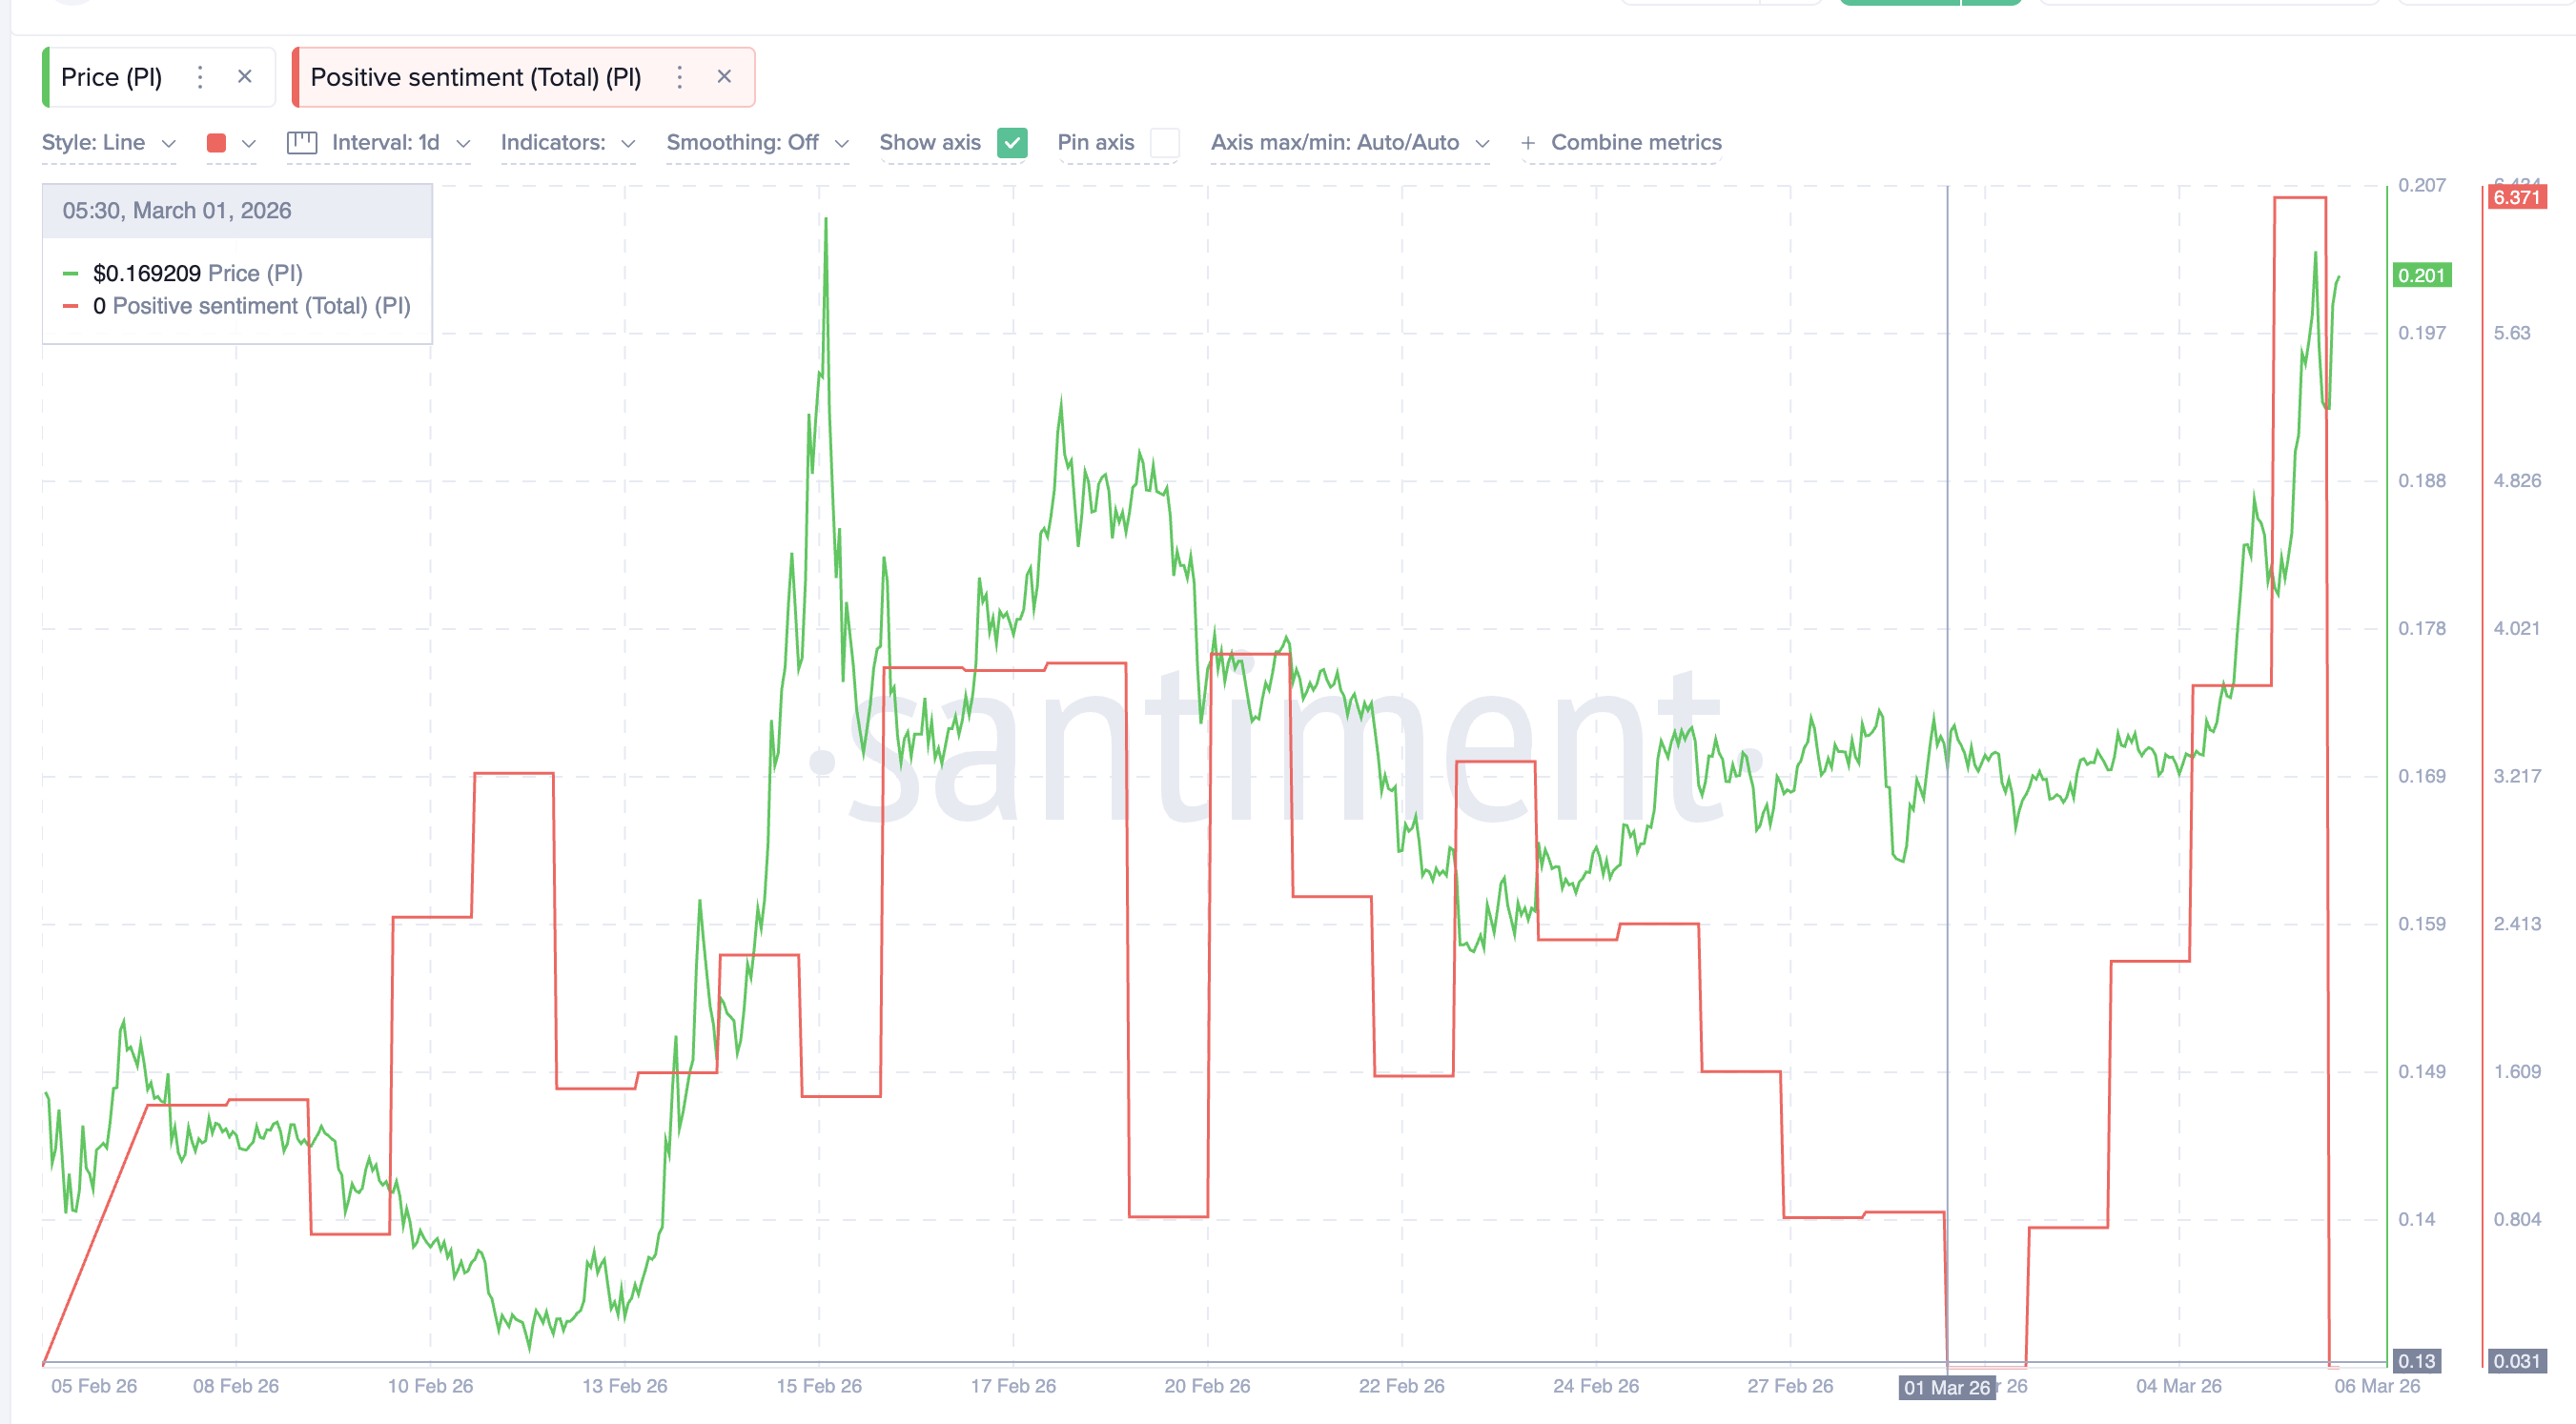
Positive sentiment around Pi Coin has increased sharply in recent days. The sentiment score climbed to roughly 6.37 on March 5, after sitting near zero earlier in the month.
 Pi Network Sentiment: Santiment
This rise coincides with growing discussion around the upcoming V20.2 upgrade, which has renewed interest in the network.
This surge in optimism aligns with the CMF divergence, suggesting improving market confidence and stronger capital inflows. However, On-Balance Volume (OBV) tells a slightly different story.
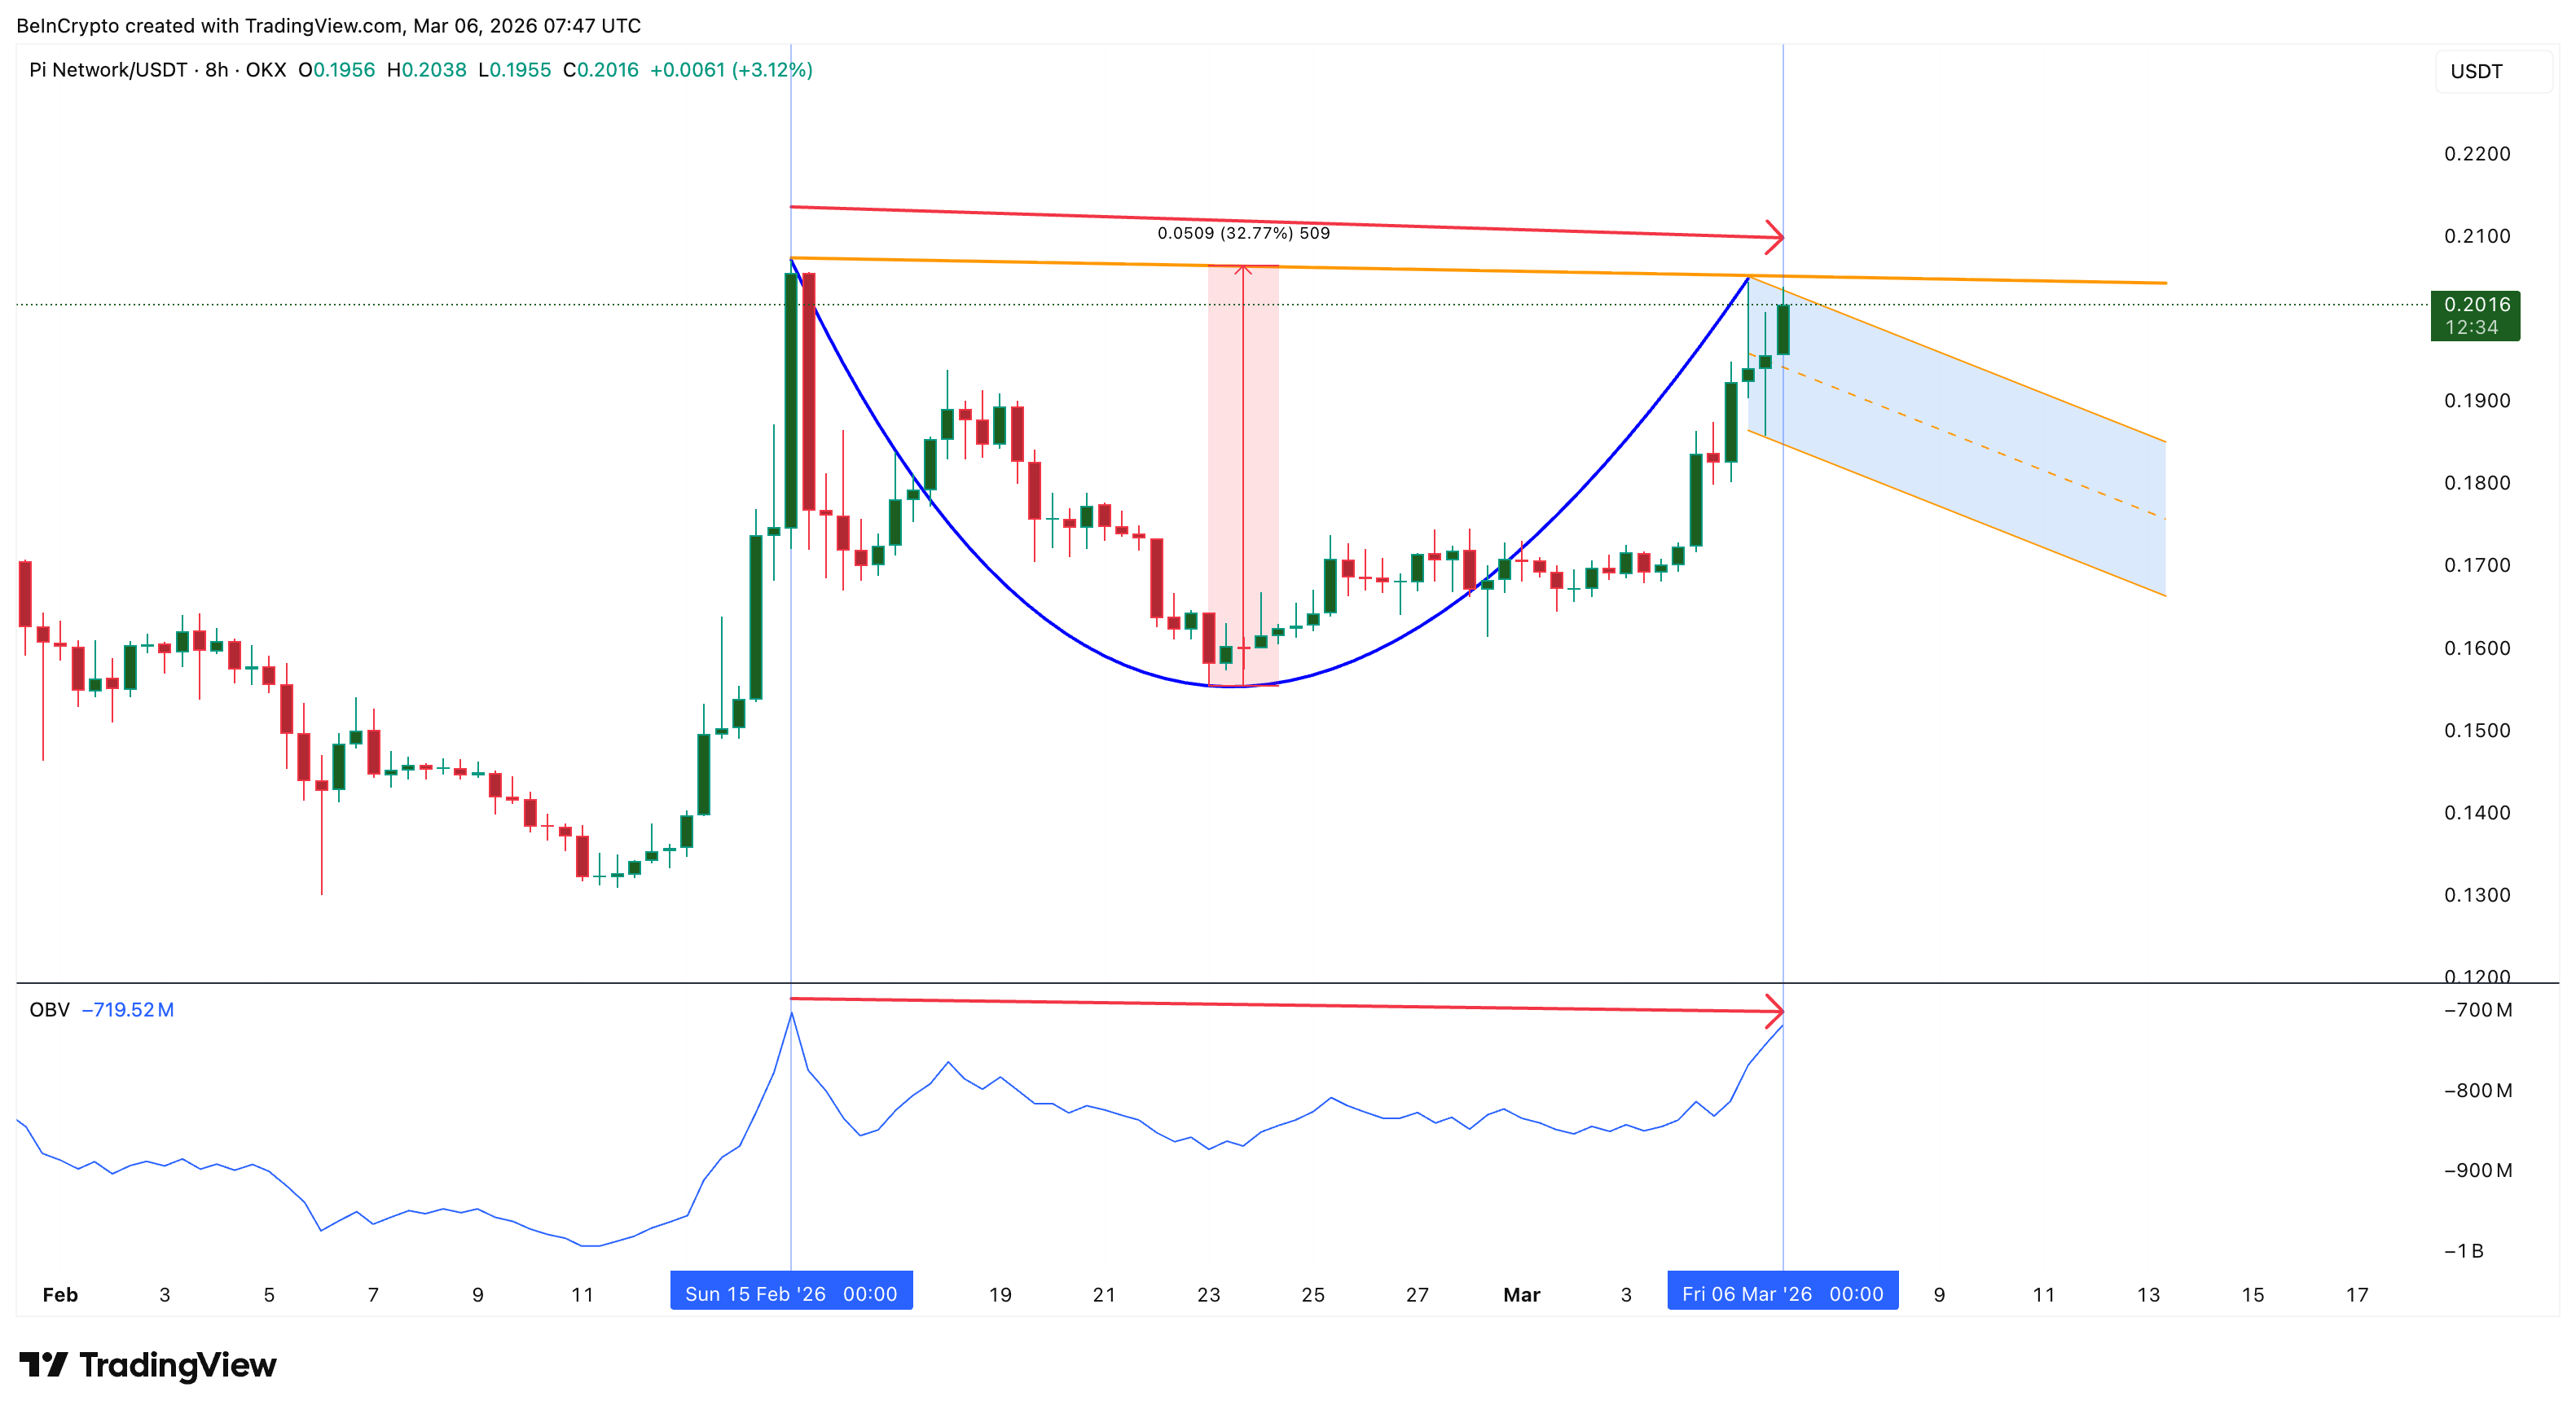
OBV, which tracks cumulative trading volume and often reflects retail participation, has trended mildly lower between February 15 and March 6 (at press time), aligning with the lower price movement.
 Pi Coin Retail Isn’t Bullish: TradingView
That suggests retail traders may not yet be fully participating in the rally, which could extend the handle consolidation phase before a breakout occurs.
Bitcoin Correlation and Key Pi Coin Price Levels to Track
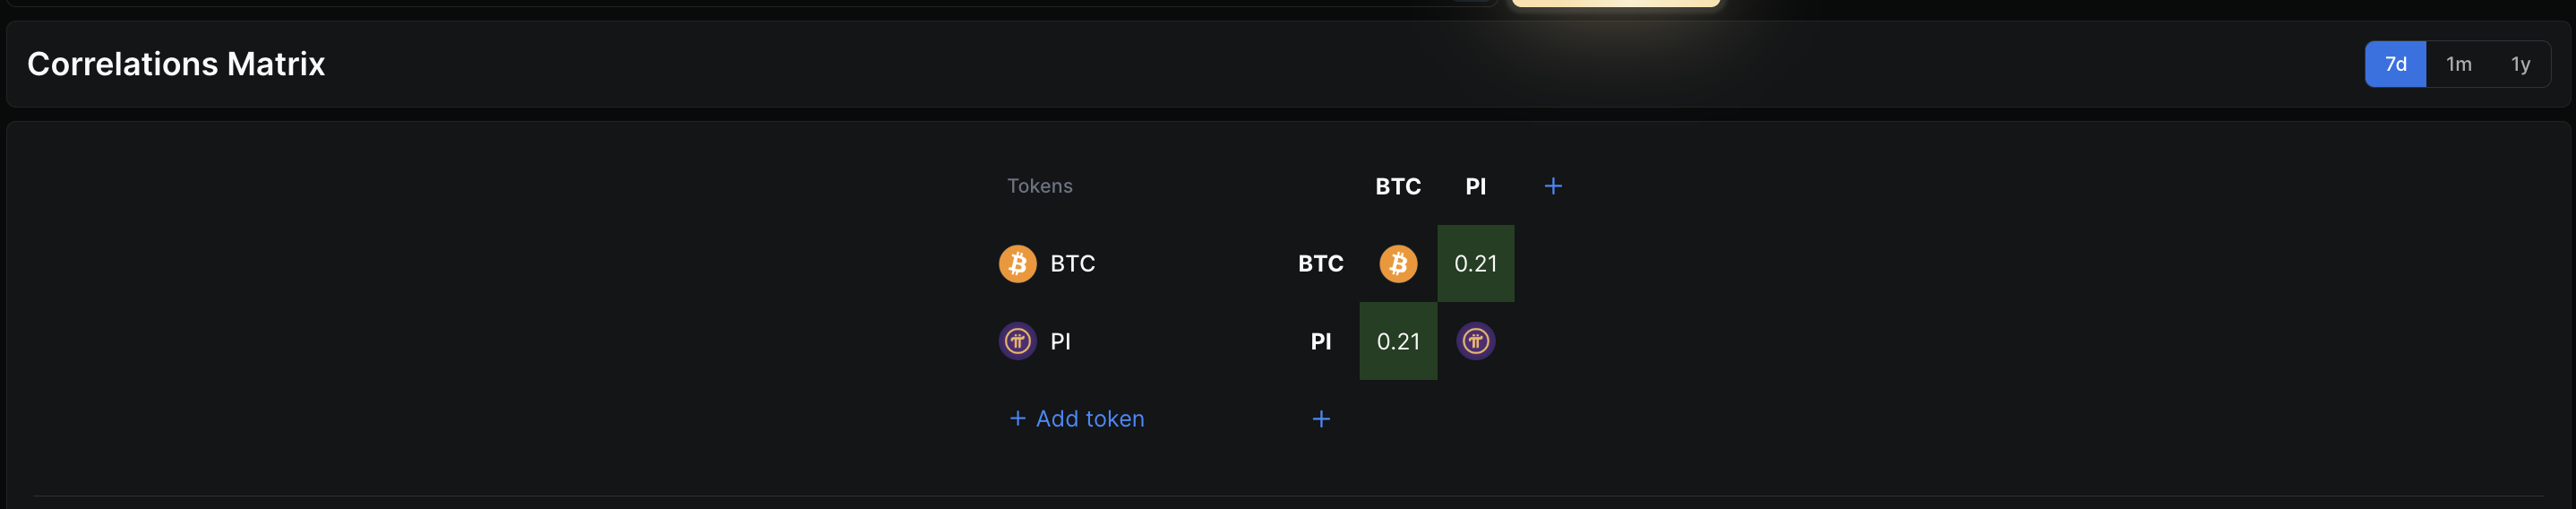
Another interesting factor shaping Pi Coin’s outlook is its relationship with Bitcoin. A 7-day correlation matrix shows Pi Coin’s correlation with Bitcoin is only around 0.21, indicating the asset has been moving largely independently from BTC.
This relatively weak correlation means Pi Coin could continue its rally even if Bitcoin experiences short-term weakness, provided other discussed indicators play their part.
 PI-BTC Correlation: DeFillama
For the bullish scenario to play out, Pi Coin needs an 8-hour close above $0.204 (neckline level), confirming the cup-and-handle breakout.
If that happens, the measured move target sits near $0.265, representing a potential 30% extension of the rally.
 Pi Coin Price Analysis: TradingView
On the downside, losing $0.197 could weaken momentum, while a deeper drop toward $0.161 would damage the pattern structure. A break below $0.155 would invalidate the bullish setup entirely.
Recommended Articles


