

Oil Price War Premium Hits Reality Check at $82 — Just the Beginning or the Blow-Off Top?
The oil price surged sharply this week after conflict in the Middle East pushed Brent crude futures (ICEEUR:BRN1!) to $82, marking its biggest shock in months. Brent is the global oil benchmark, widely used to price international crude, which makes it the clearest measure of the oil price reaction to geopolitical risk.
The breakout is tracked on the CFD (Contract for Difference) charts, which reflect price structure but not actual positions. However, futures data from ICE Futures Europe confirmed real traders entered the market, validating the oil price surge as both a geopolitical and positioning-driven move.
Oil Price Surge and Rising Dollar Create Early Stress at $82
The oil price jumped from around $72 to $82 after US-Israeli strikes on Iran. The retaliation raised fears of supply disruption through the Strait of Hormuz, a critical route carrying nearly one-fifth of global oil flows. This sudden repricing added a war premium, meaning traders pushed the oil price higher due to expected supply risk rather than immediate shortages.
This shock triggered a gap-up opening in Brent crude oil. Such moves often face early stress because markets tend to retest part of the jump before continuing higher.
That stress appeared near $82, as Brent crude oil corrected to $79.
The latest candle closed red with elevated volume. Volume in red indicates more trading occurred as the oil price corrected post-gap-up, indicating active selling pressure.
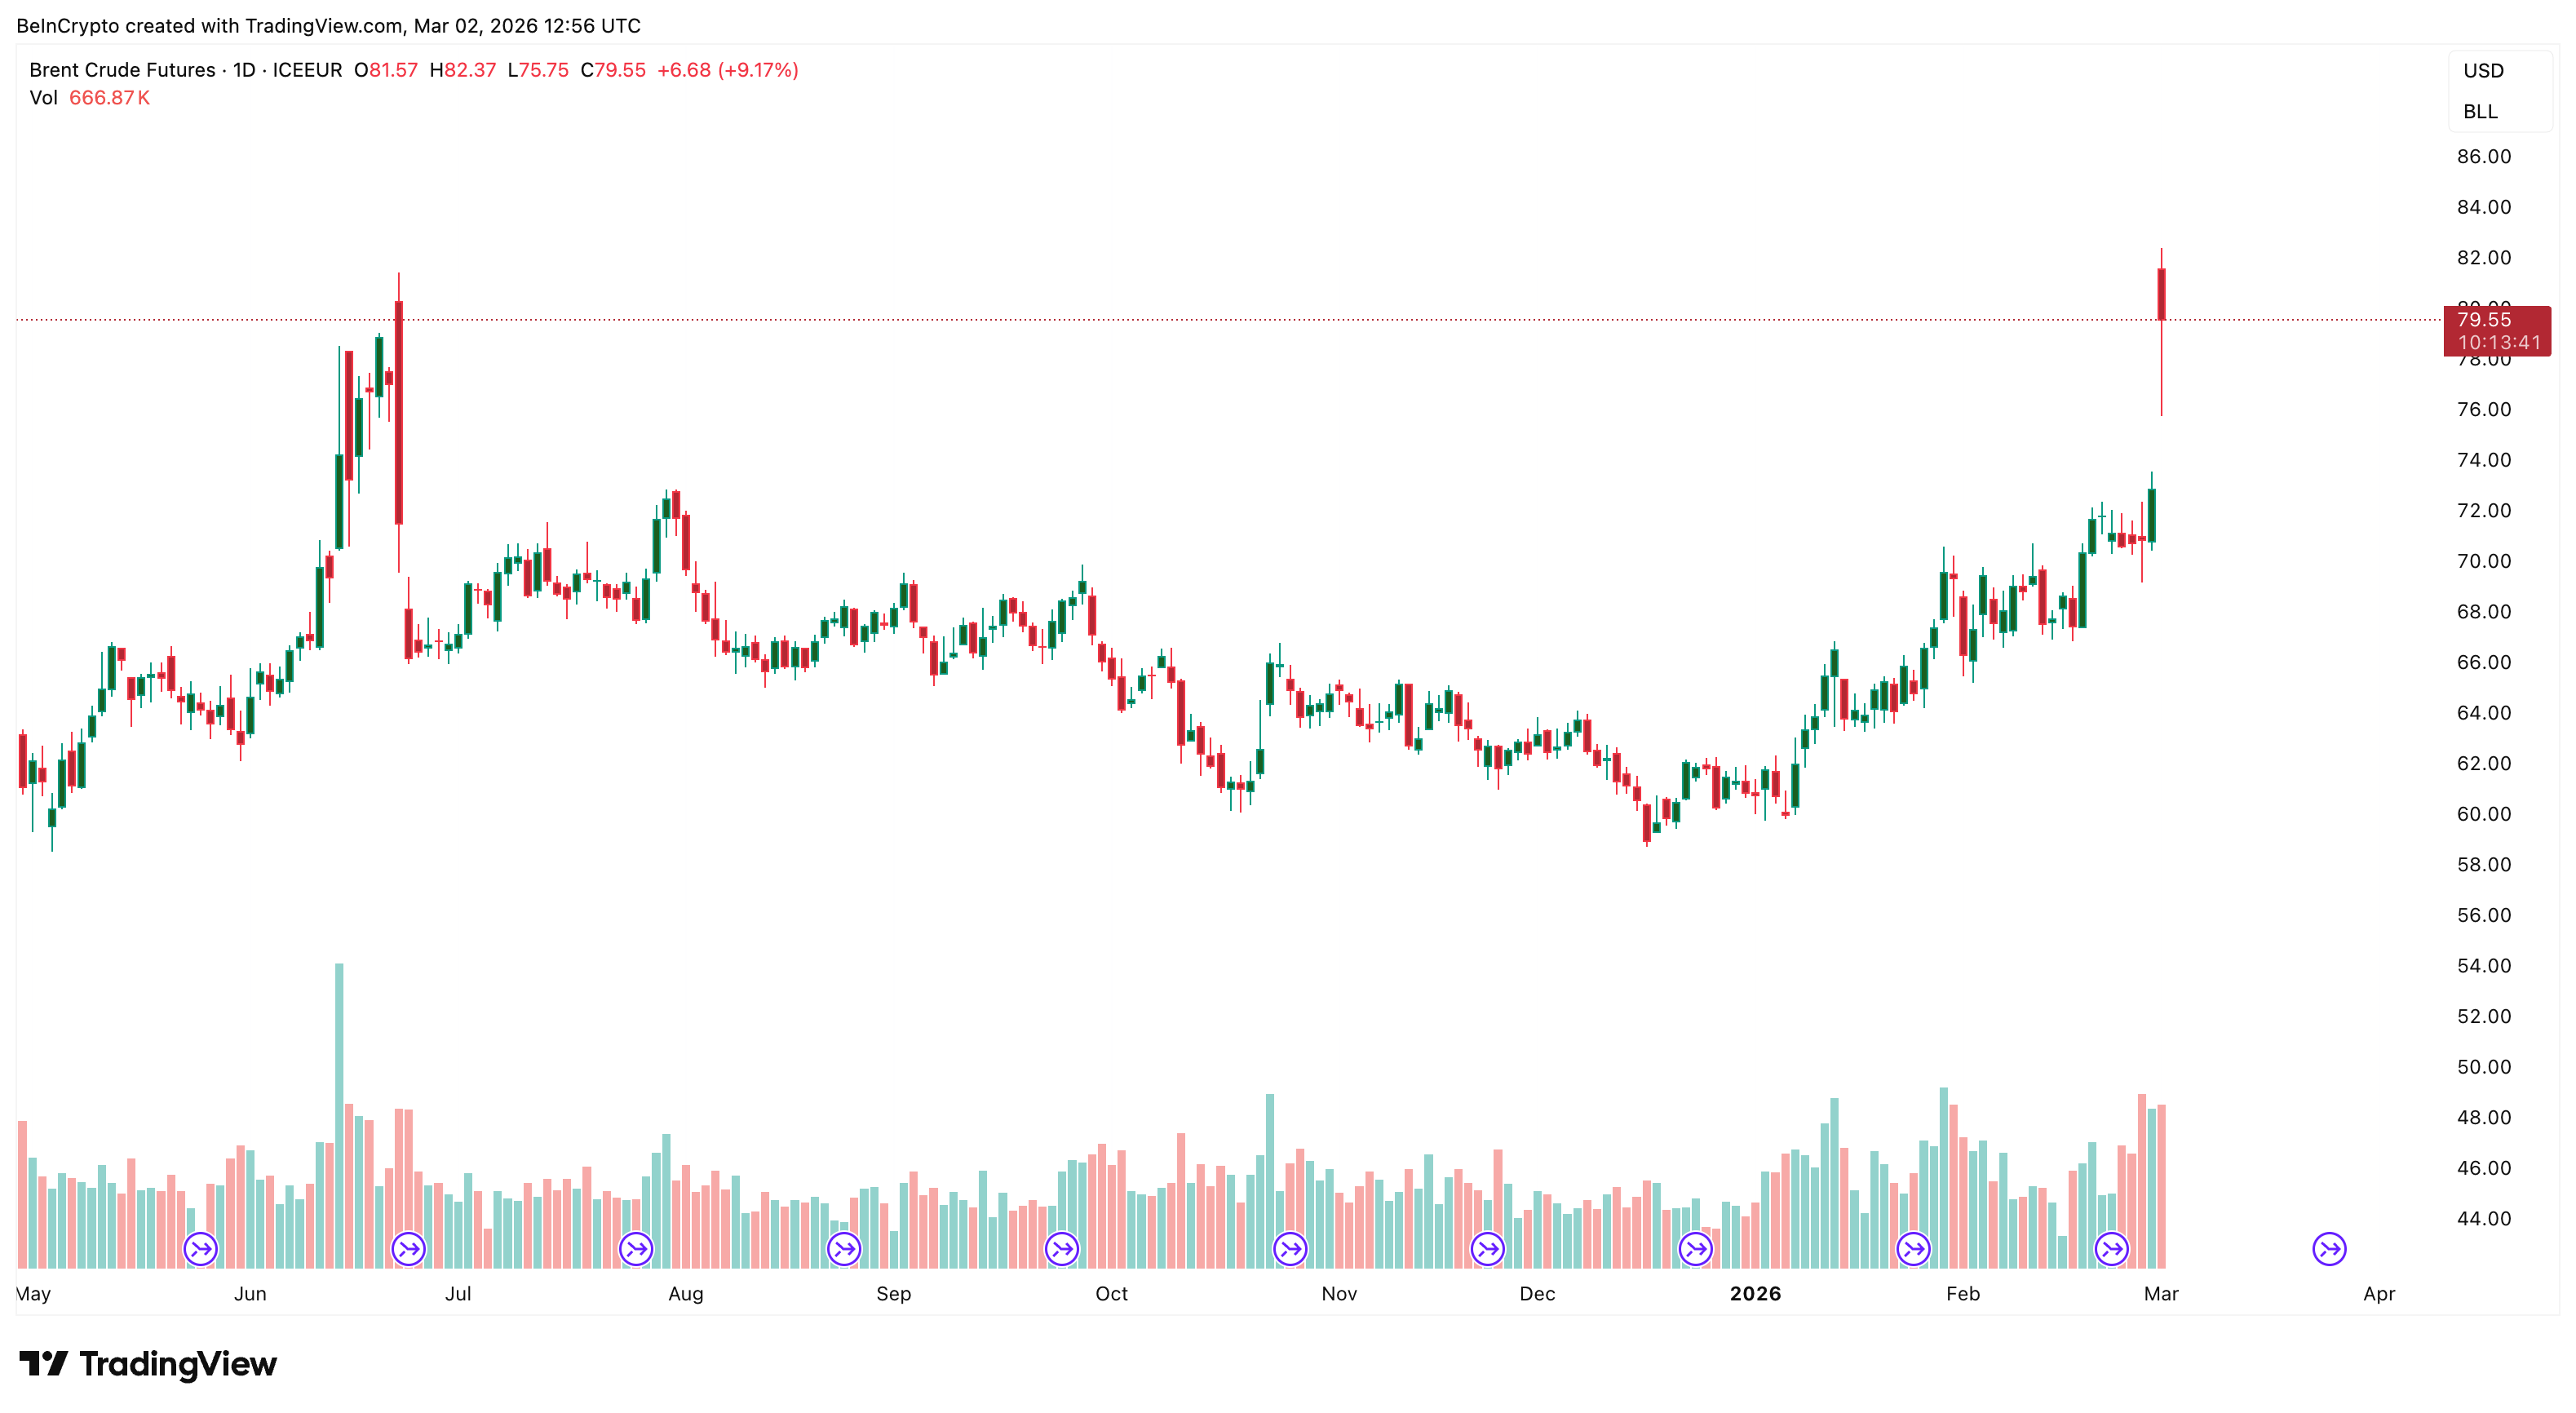 High Volume: TradingView
At the same time, the US Dollar Index (DXY), which tracks dollar strength against major currencies, has also been rising. Since oil trades globally in dollars, a stronger dollar makes oil more expensive for international buyers. A bearish sign.
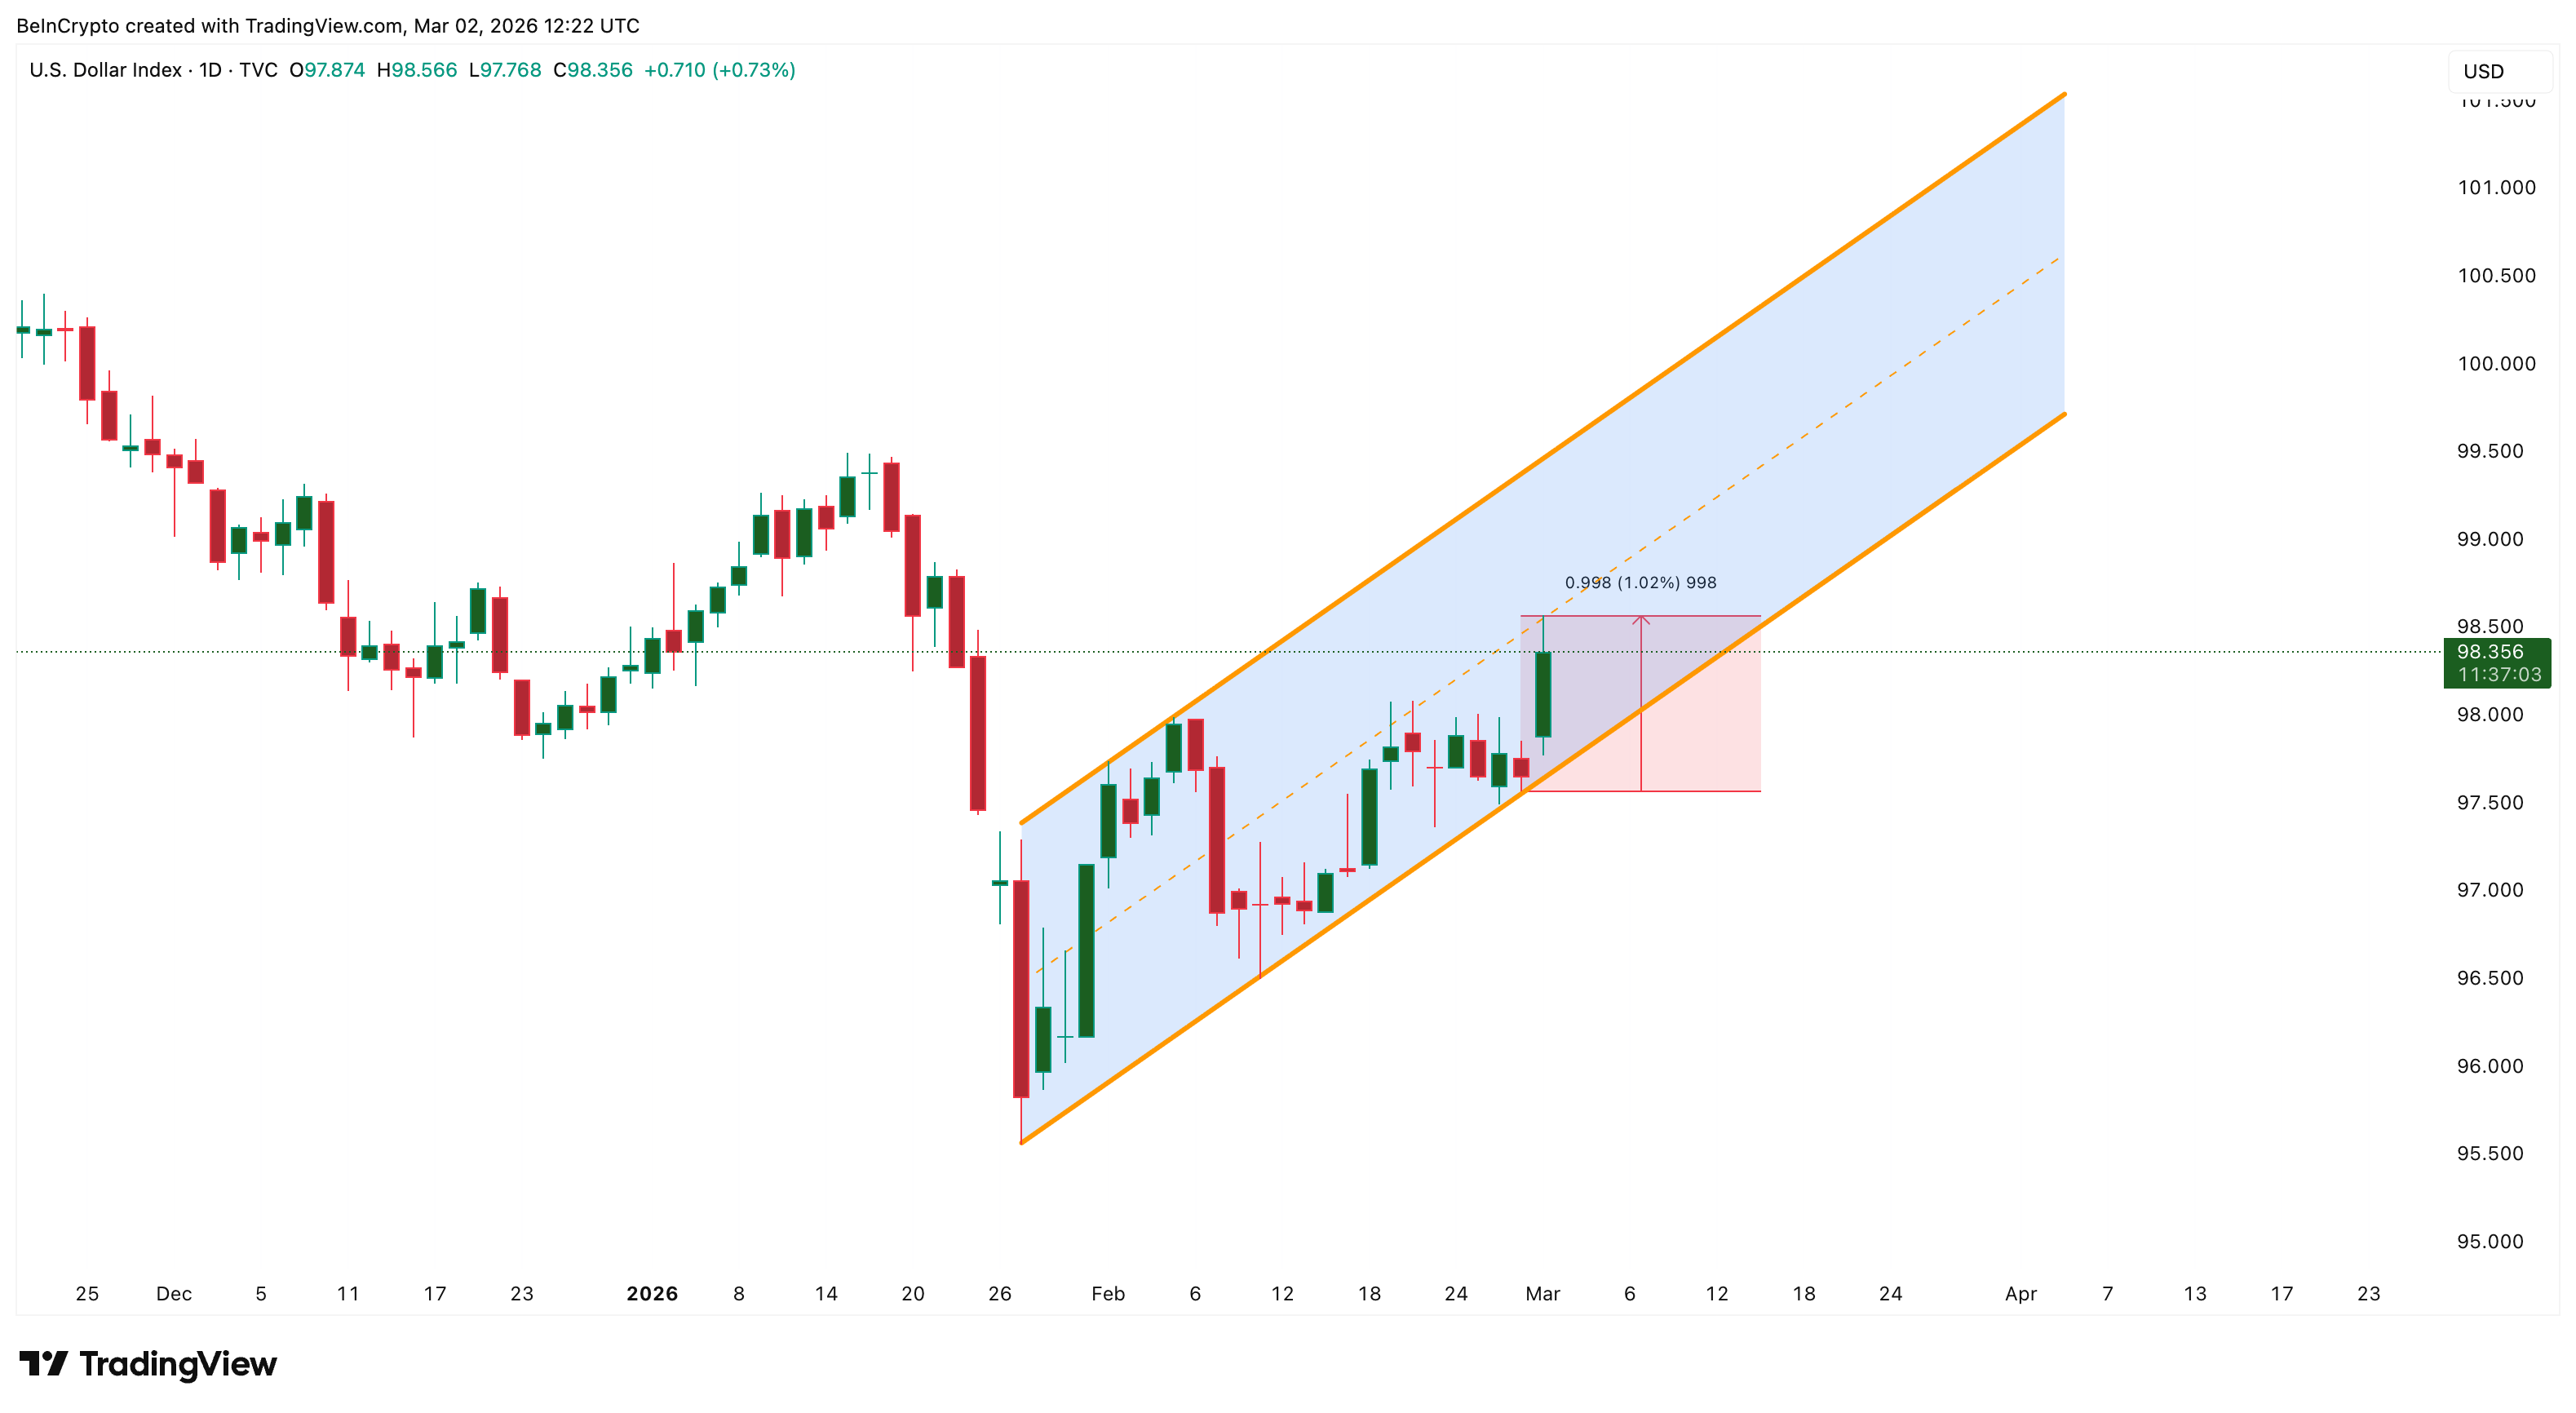 DXY Rising: TradingView
But another key indicator shows the full picture. Open interest, often called OI, has risen sharply on Brent futures (ICEEUR:BRN1!). Rising open interest means new traders are entering the market rather than closing positions. This validates the short-term bullish bias.
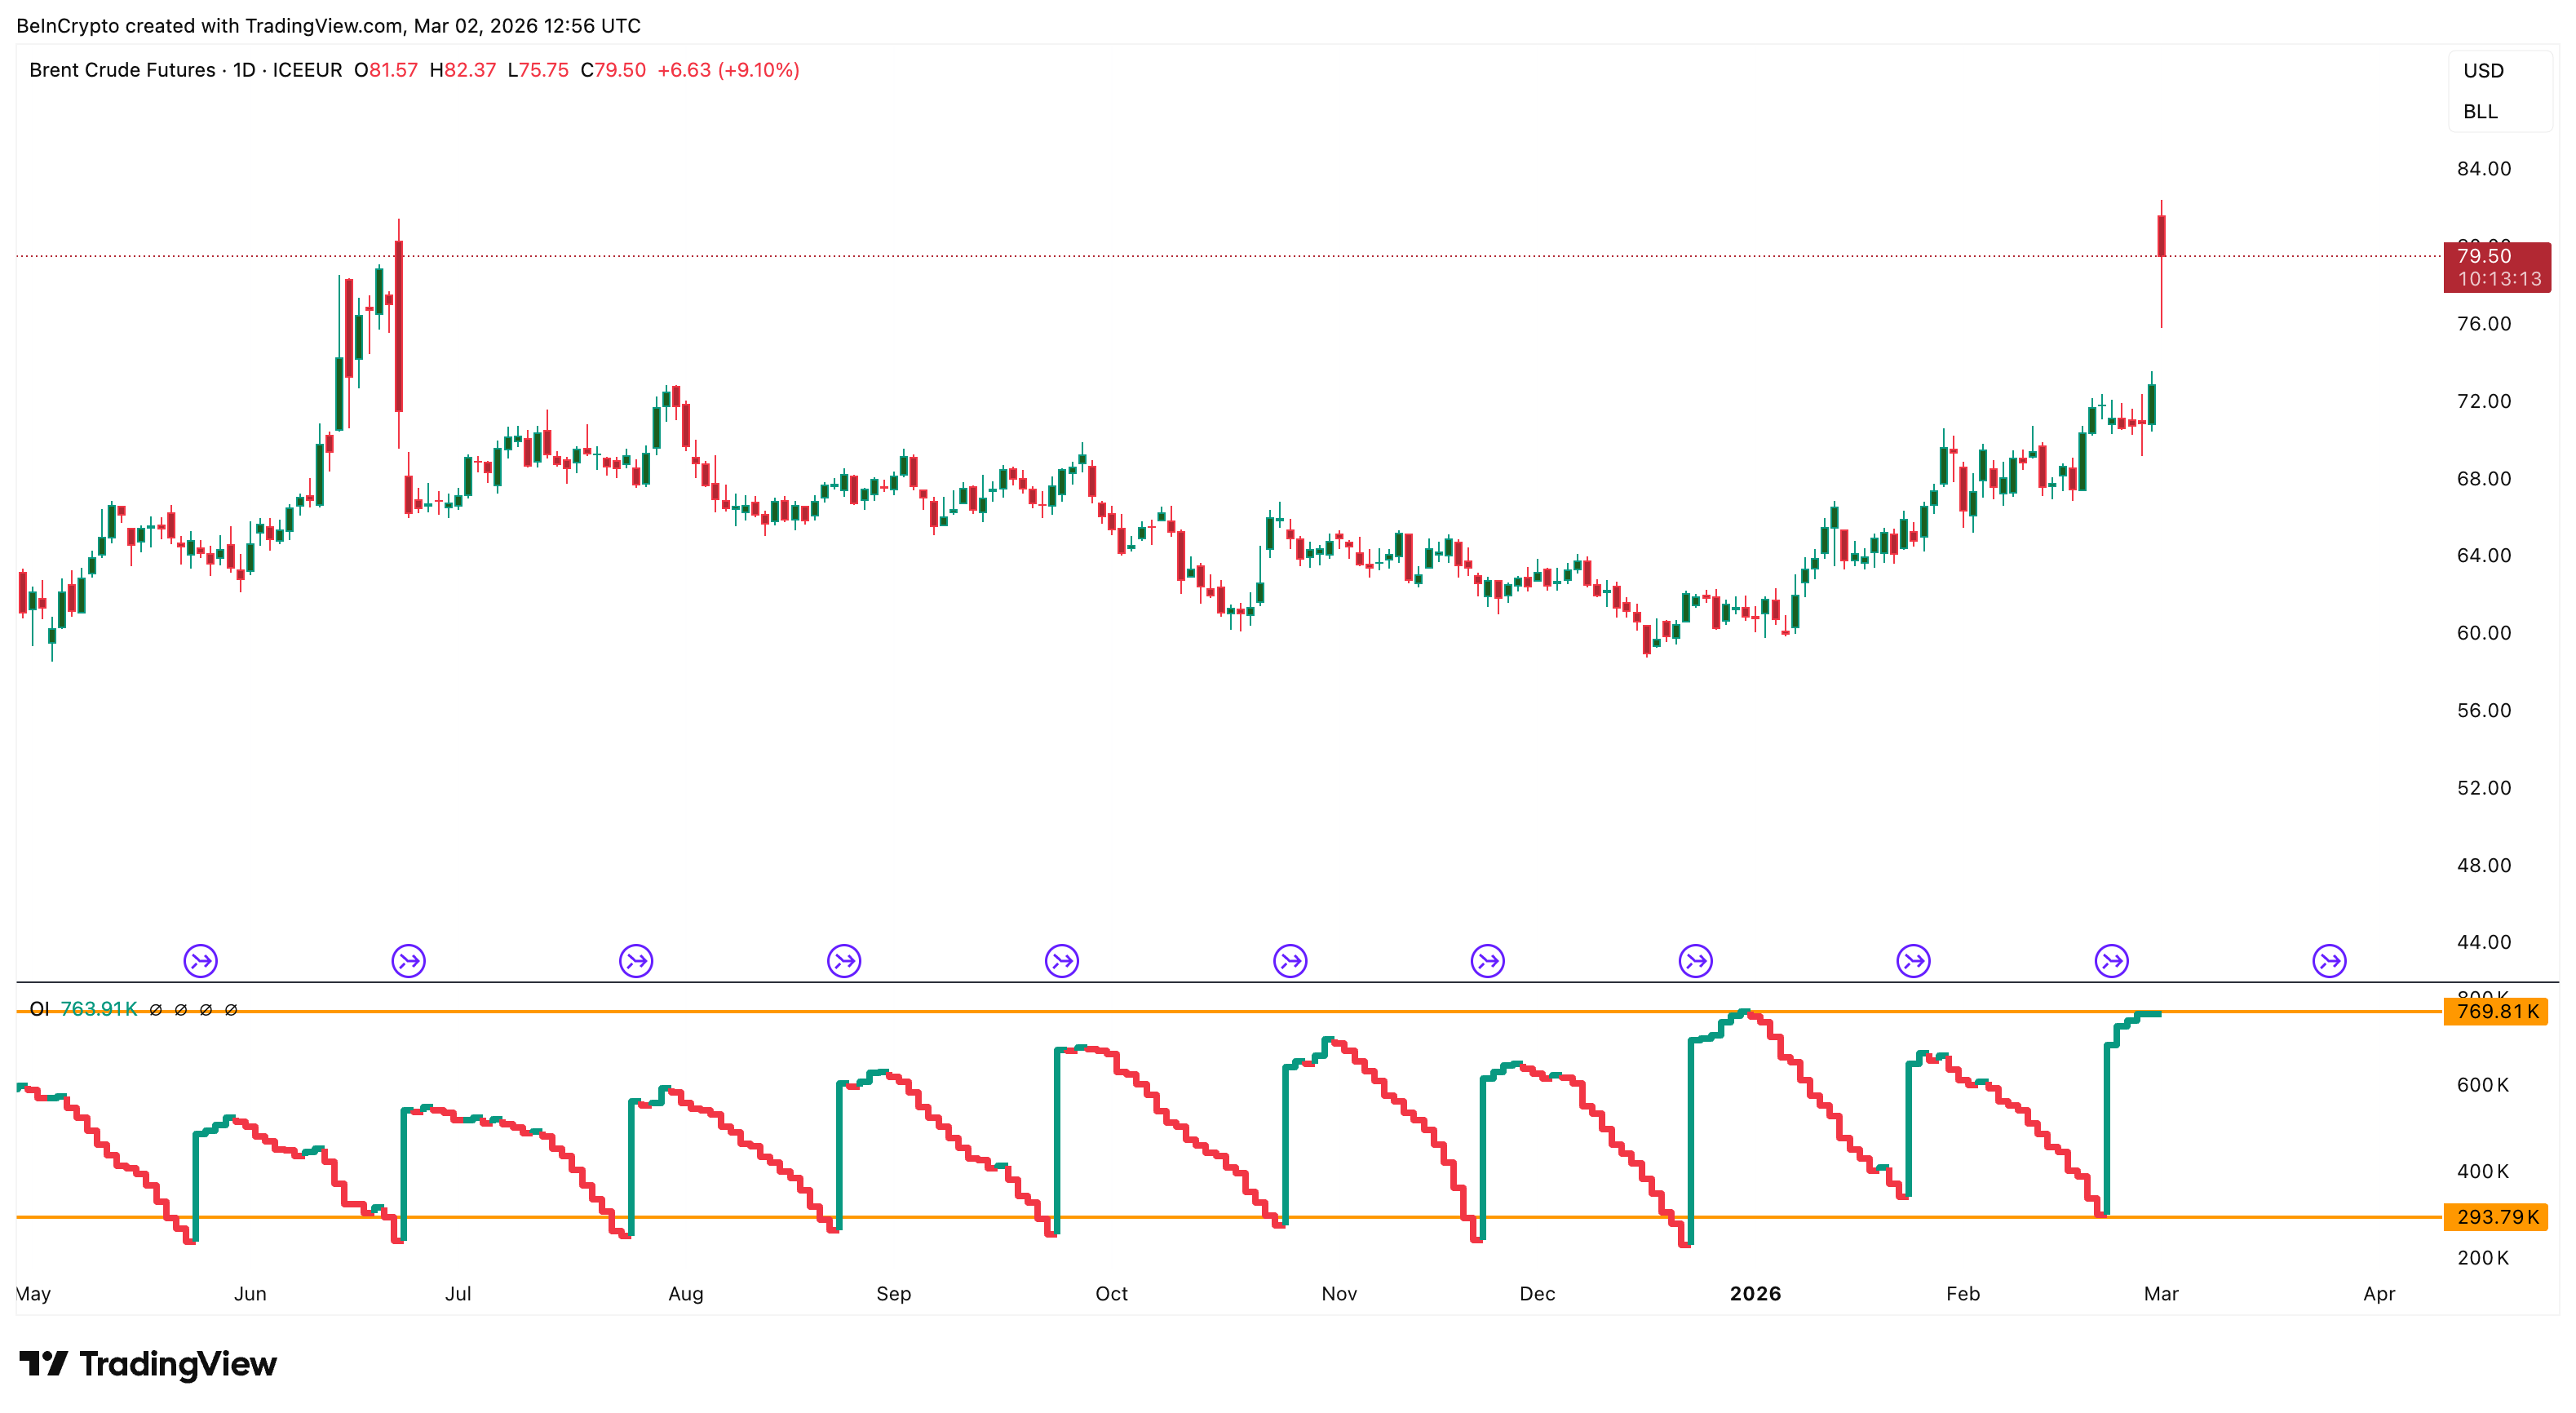 Oil Price And Open Interest: TradingView
This shows the oil price is not falling due to a lack of interest. Instead, the market is absorbing selling while new positions continue building. However, traders need to keep an eye out for the flattening open interest.
Price rising while open interest is flat means the move is likely driven by short covering, not new buying, so the trend is weaker and may not sustain.
OPEC Supply Increase Adds Future Risk Even as War Drives Current Price
At the same time, OPEC, the Organization of the Petroleum Exporting Countries, announced it would increase production by 206,000 barrels per day starting in April. OPEC is a group of major oil-producing nations that control a large share of global supply.
Normally, a higher supply reduces the oil price because more oil becomes available.
However, the oil price continued rising because war risk affects supply immediately, while OPEC’s production increase happens later. This creates a conflict between short-term supply fears and longer-term supply growth.
The Strait of Hormuz remains central to this risk. Even the possibility of disruption is enough to keep traders cautious and maintain upward pressure on the oil price. This also explains why open interest has started to flatline and why selling pressure emerged after the gap-up opening, as traders remain cautious about chasing the oil price higher while the risk of sudden supply and macro shifts remains elevated.
Futures Positioning Shows Market Is Preparing for a Larger Oil Price Move
Futures positioning shows the oil price breakout is attracting strong participation. The sharp rise in open interest on Brent crude oil futures (ICEEUR: BRN1!), seen earlier, confirms that traders are actively opening new positions as volatility increases.
This positioning trend is spreading beyond traditional markets. Platforms like Aster, a crypto-based derivatives exchange, have launched oil perpetual futures.
The rise in oil trading on crypto platforms shows how widespread the positioning has become. It reflects broad positioning across financial markets.
Key oil price levels are tracked using the Brent crude CFD, while the Brent crude oil Futures are used to track volume and open interest.
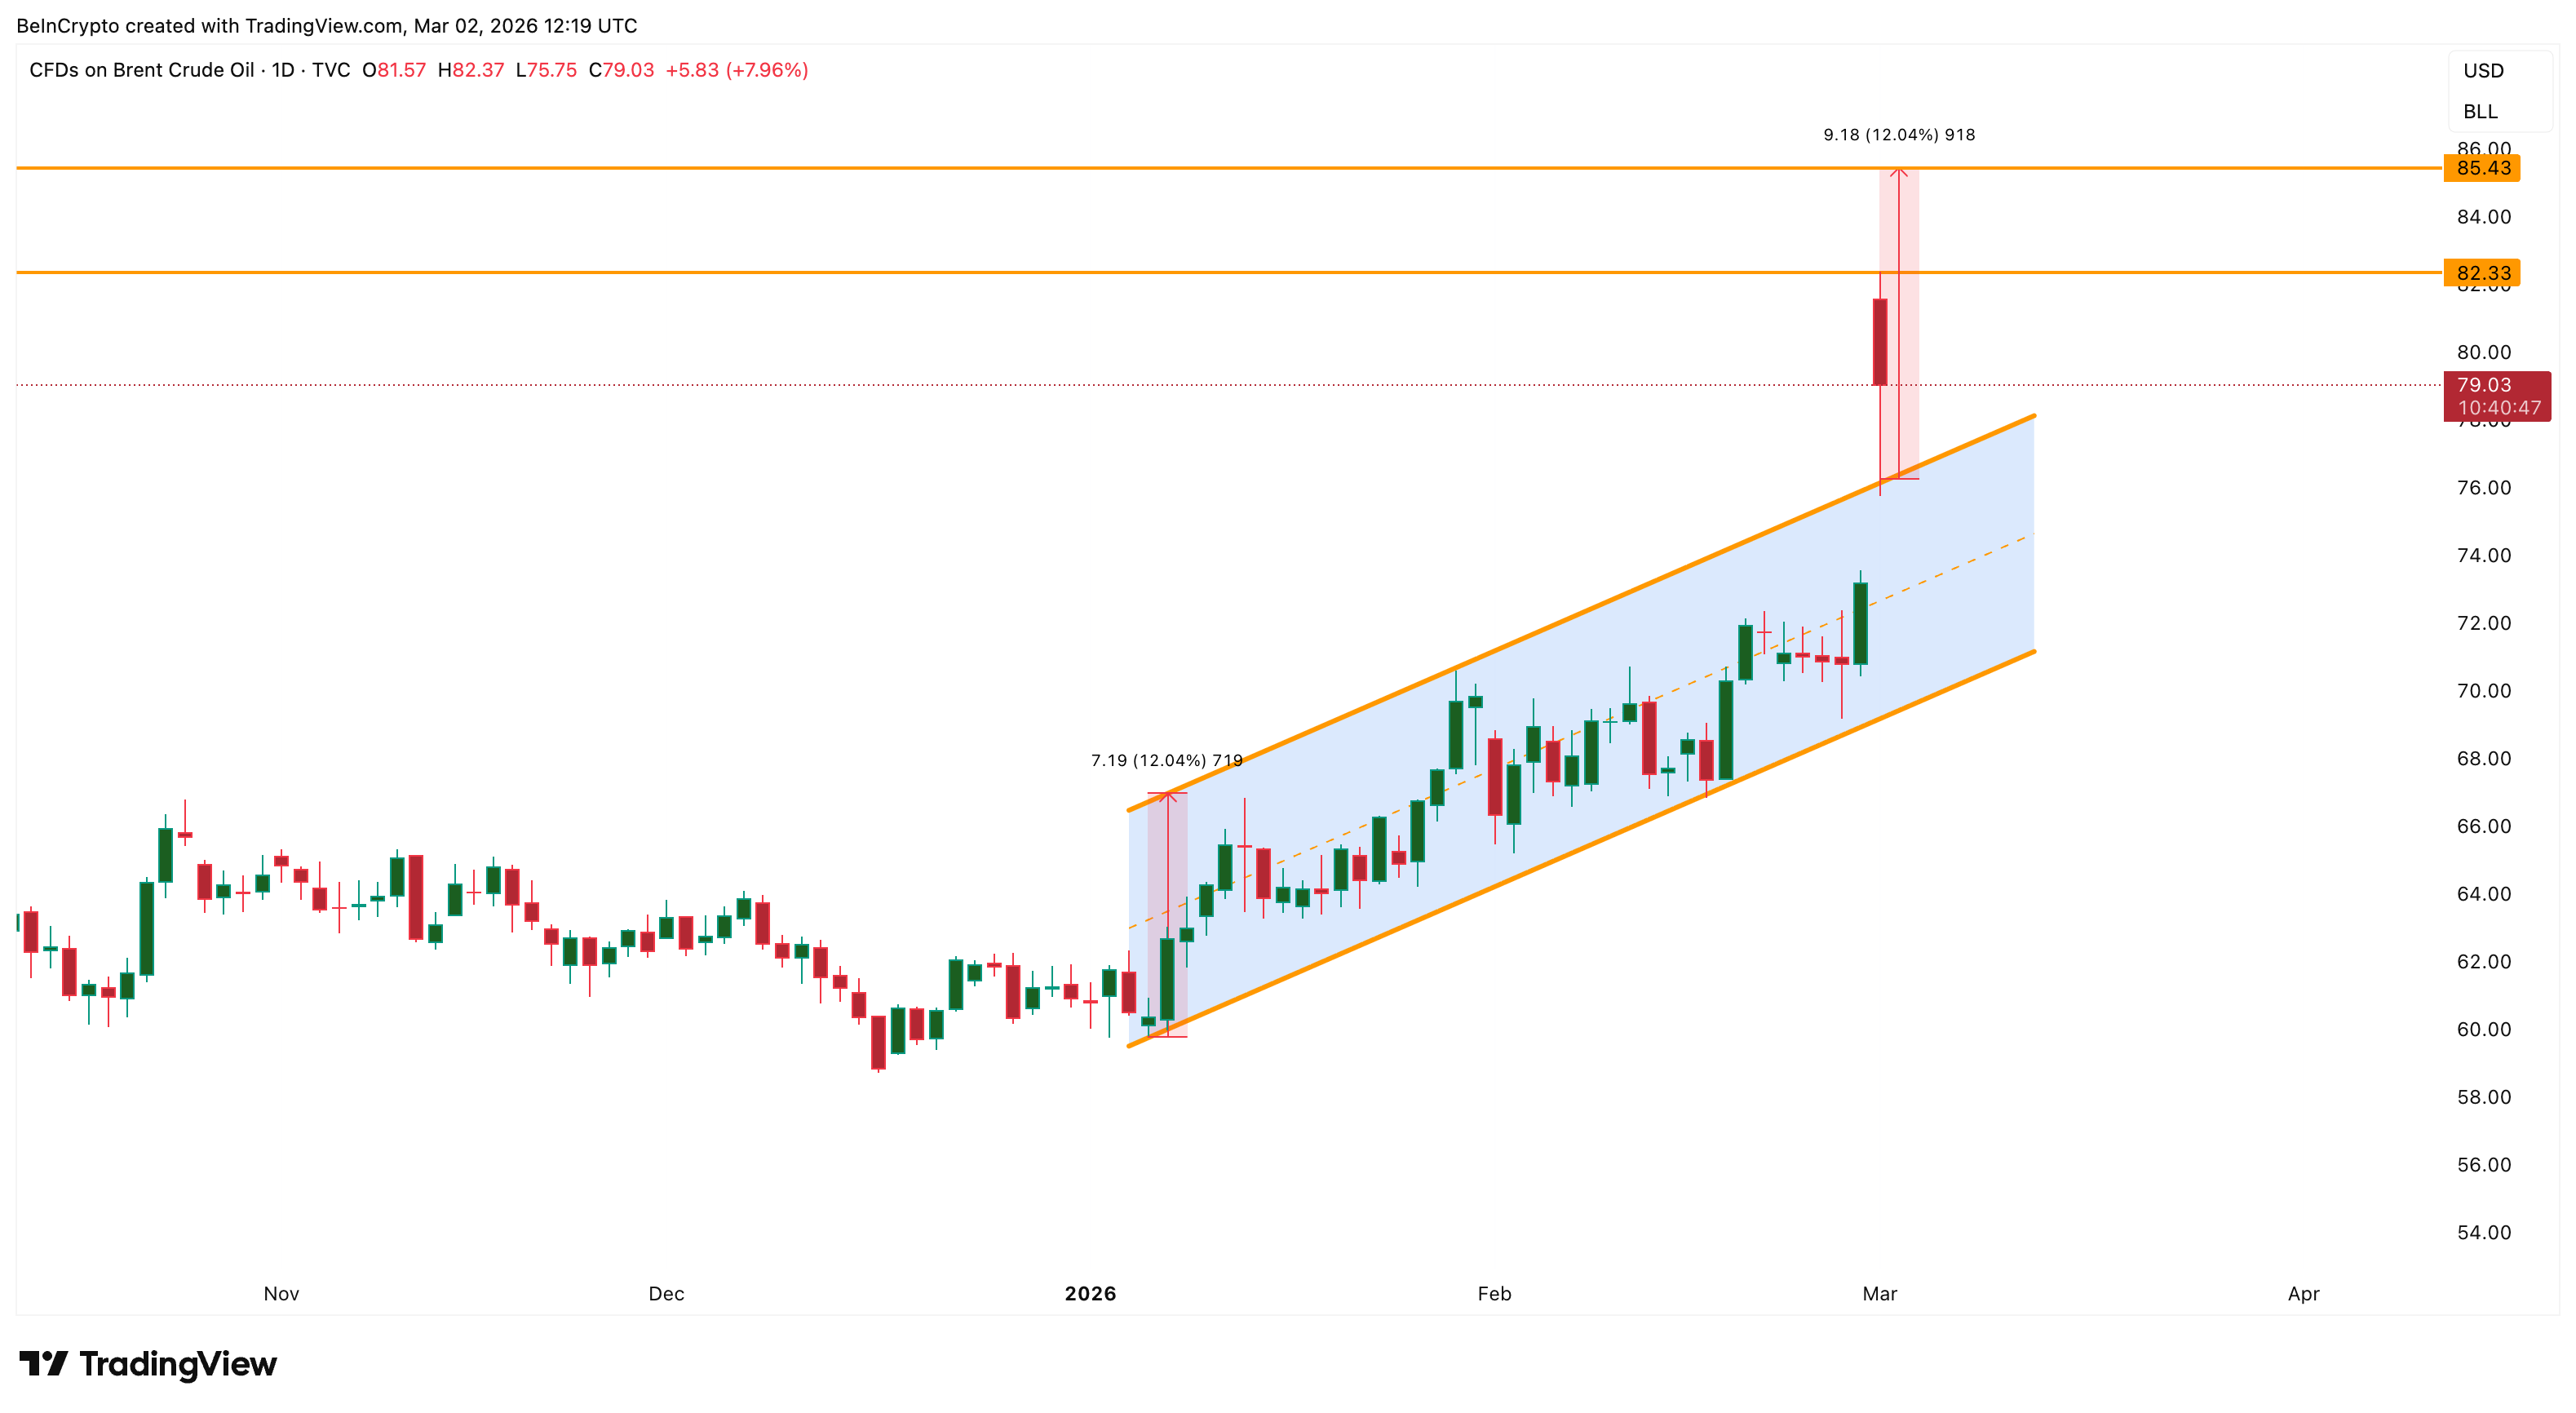 Key Resistance: TradingView
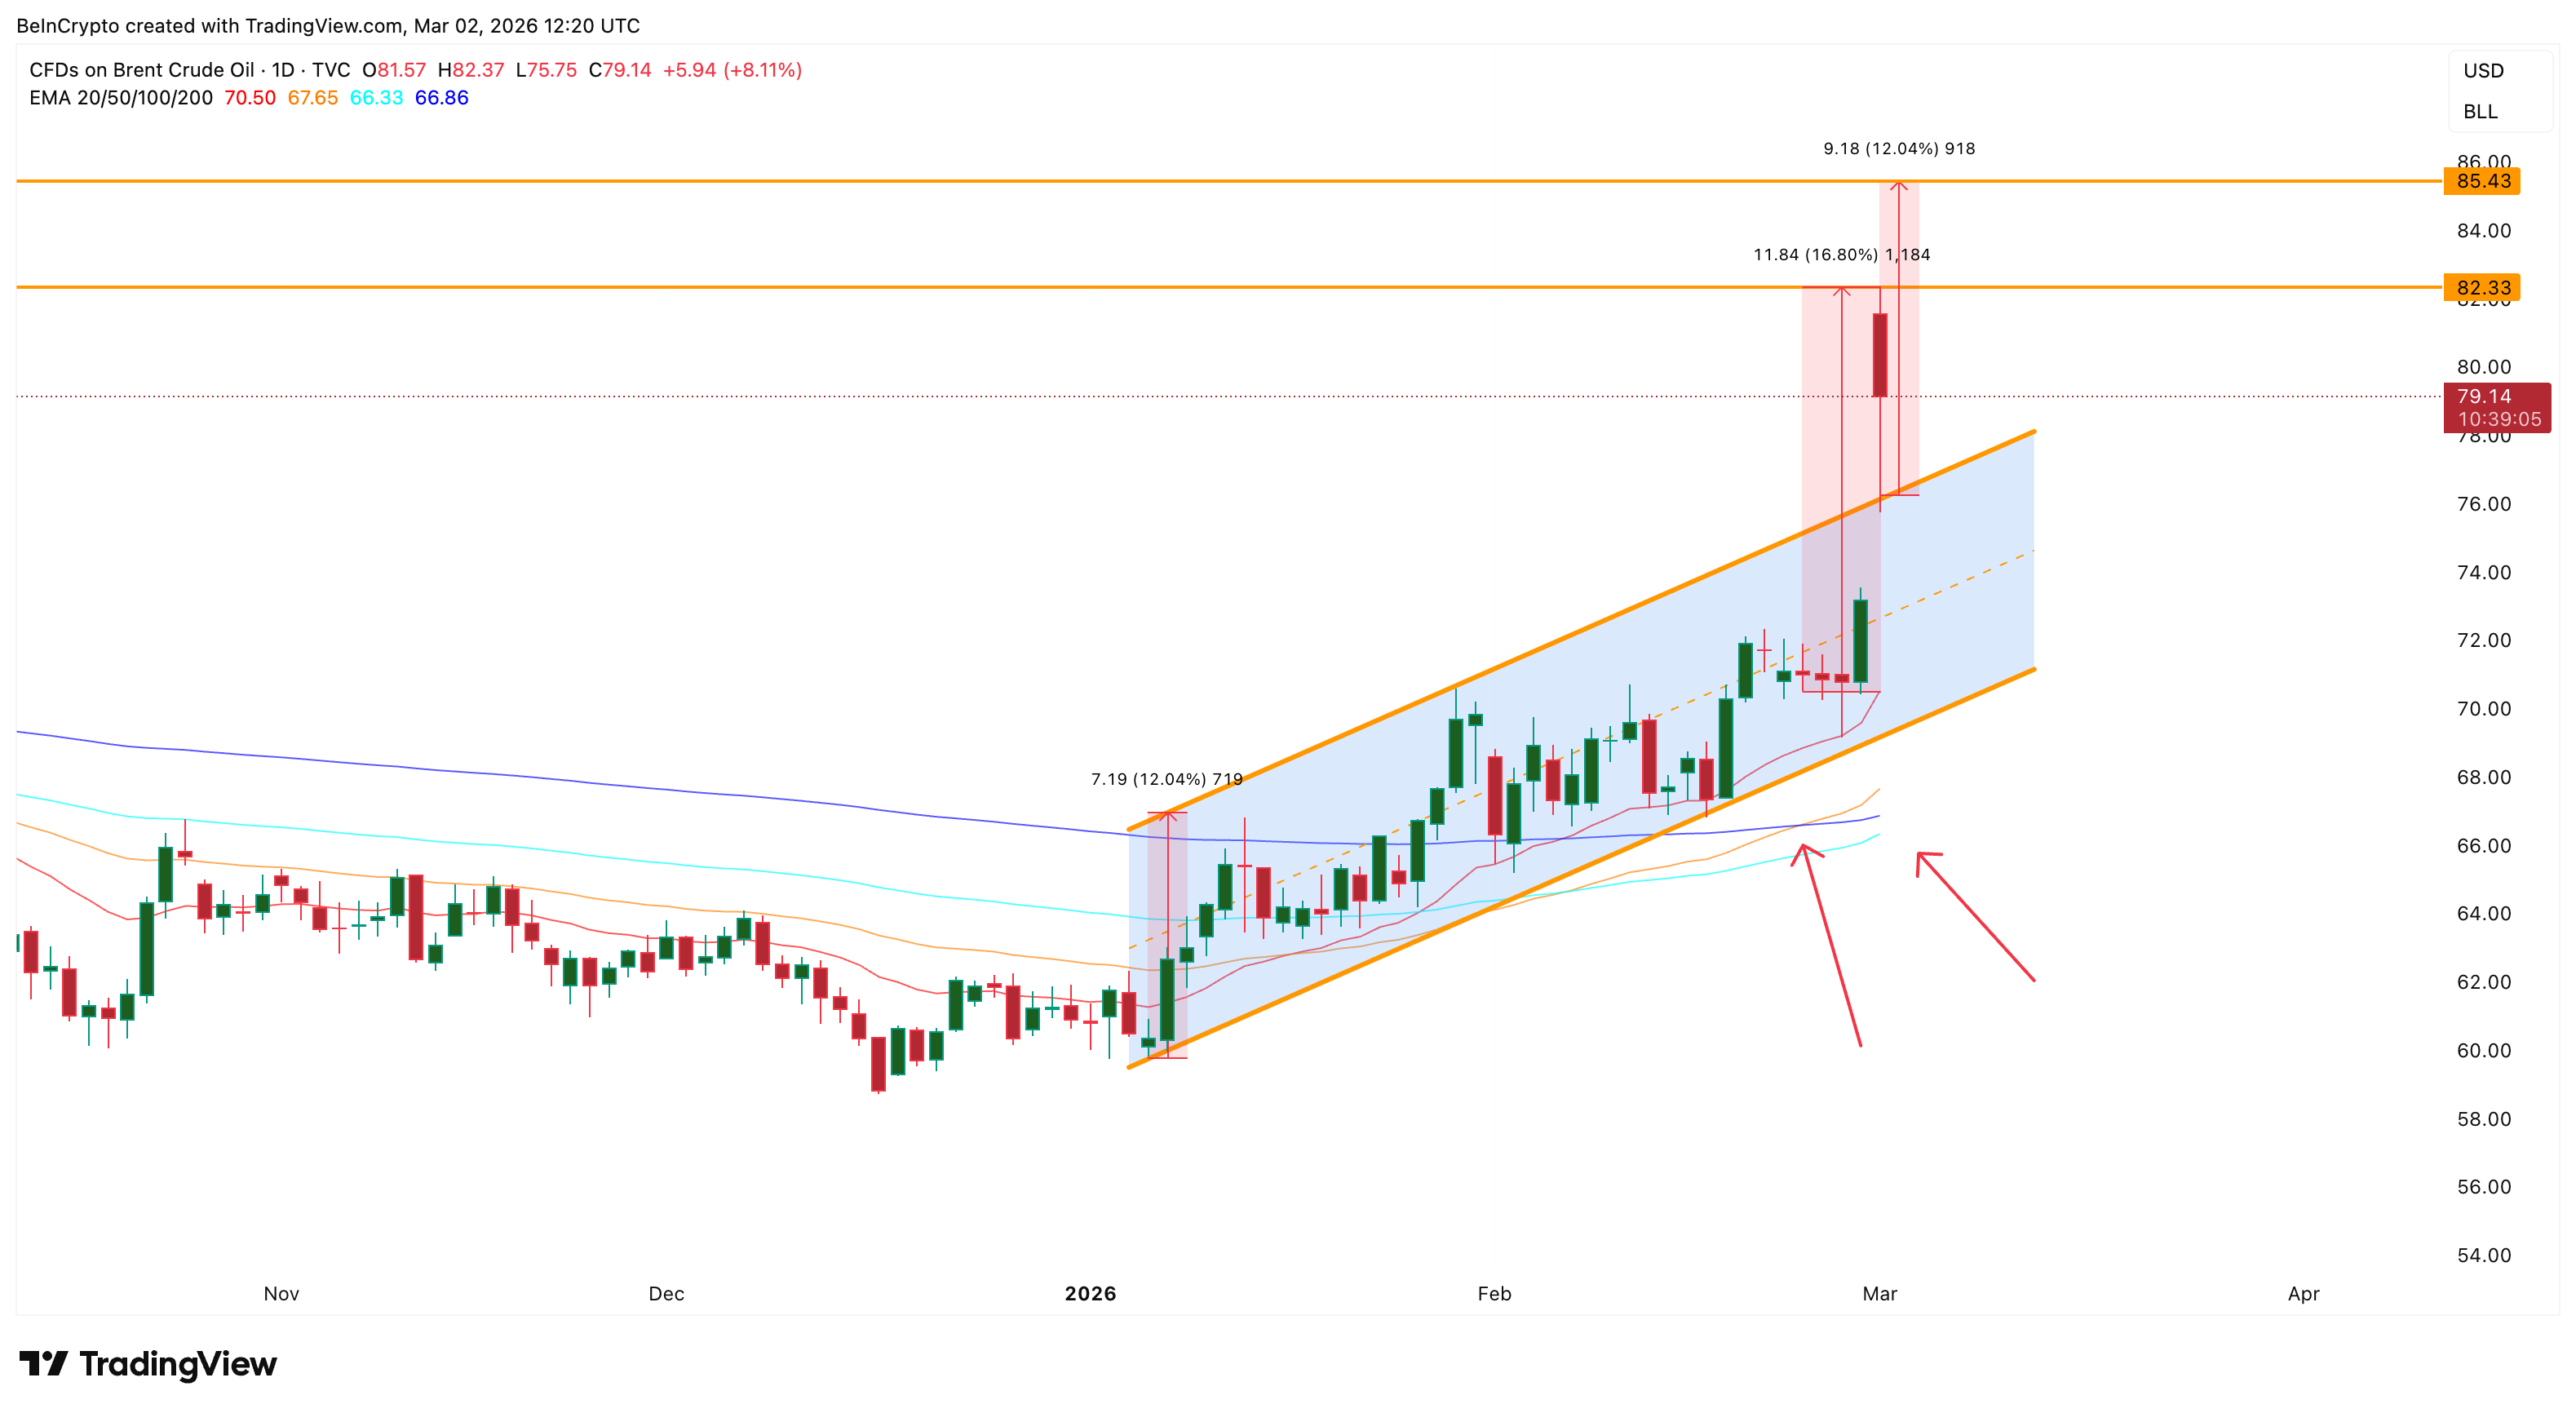
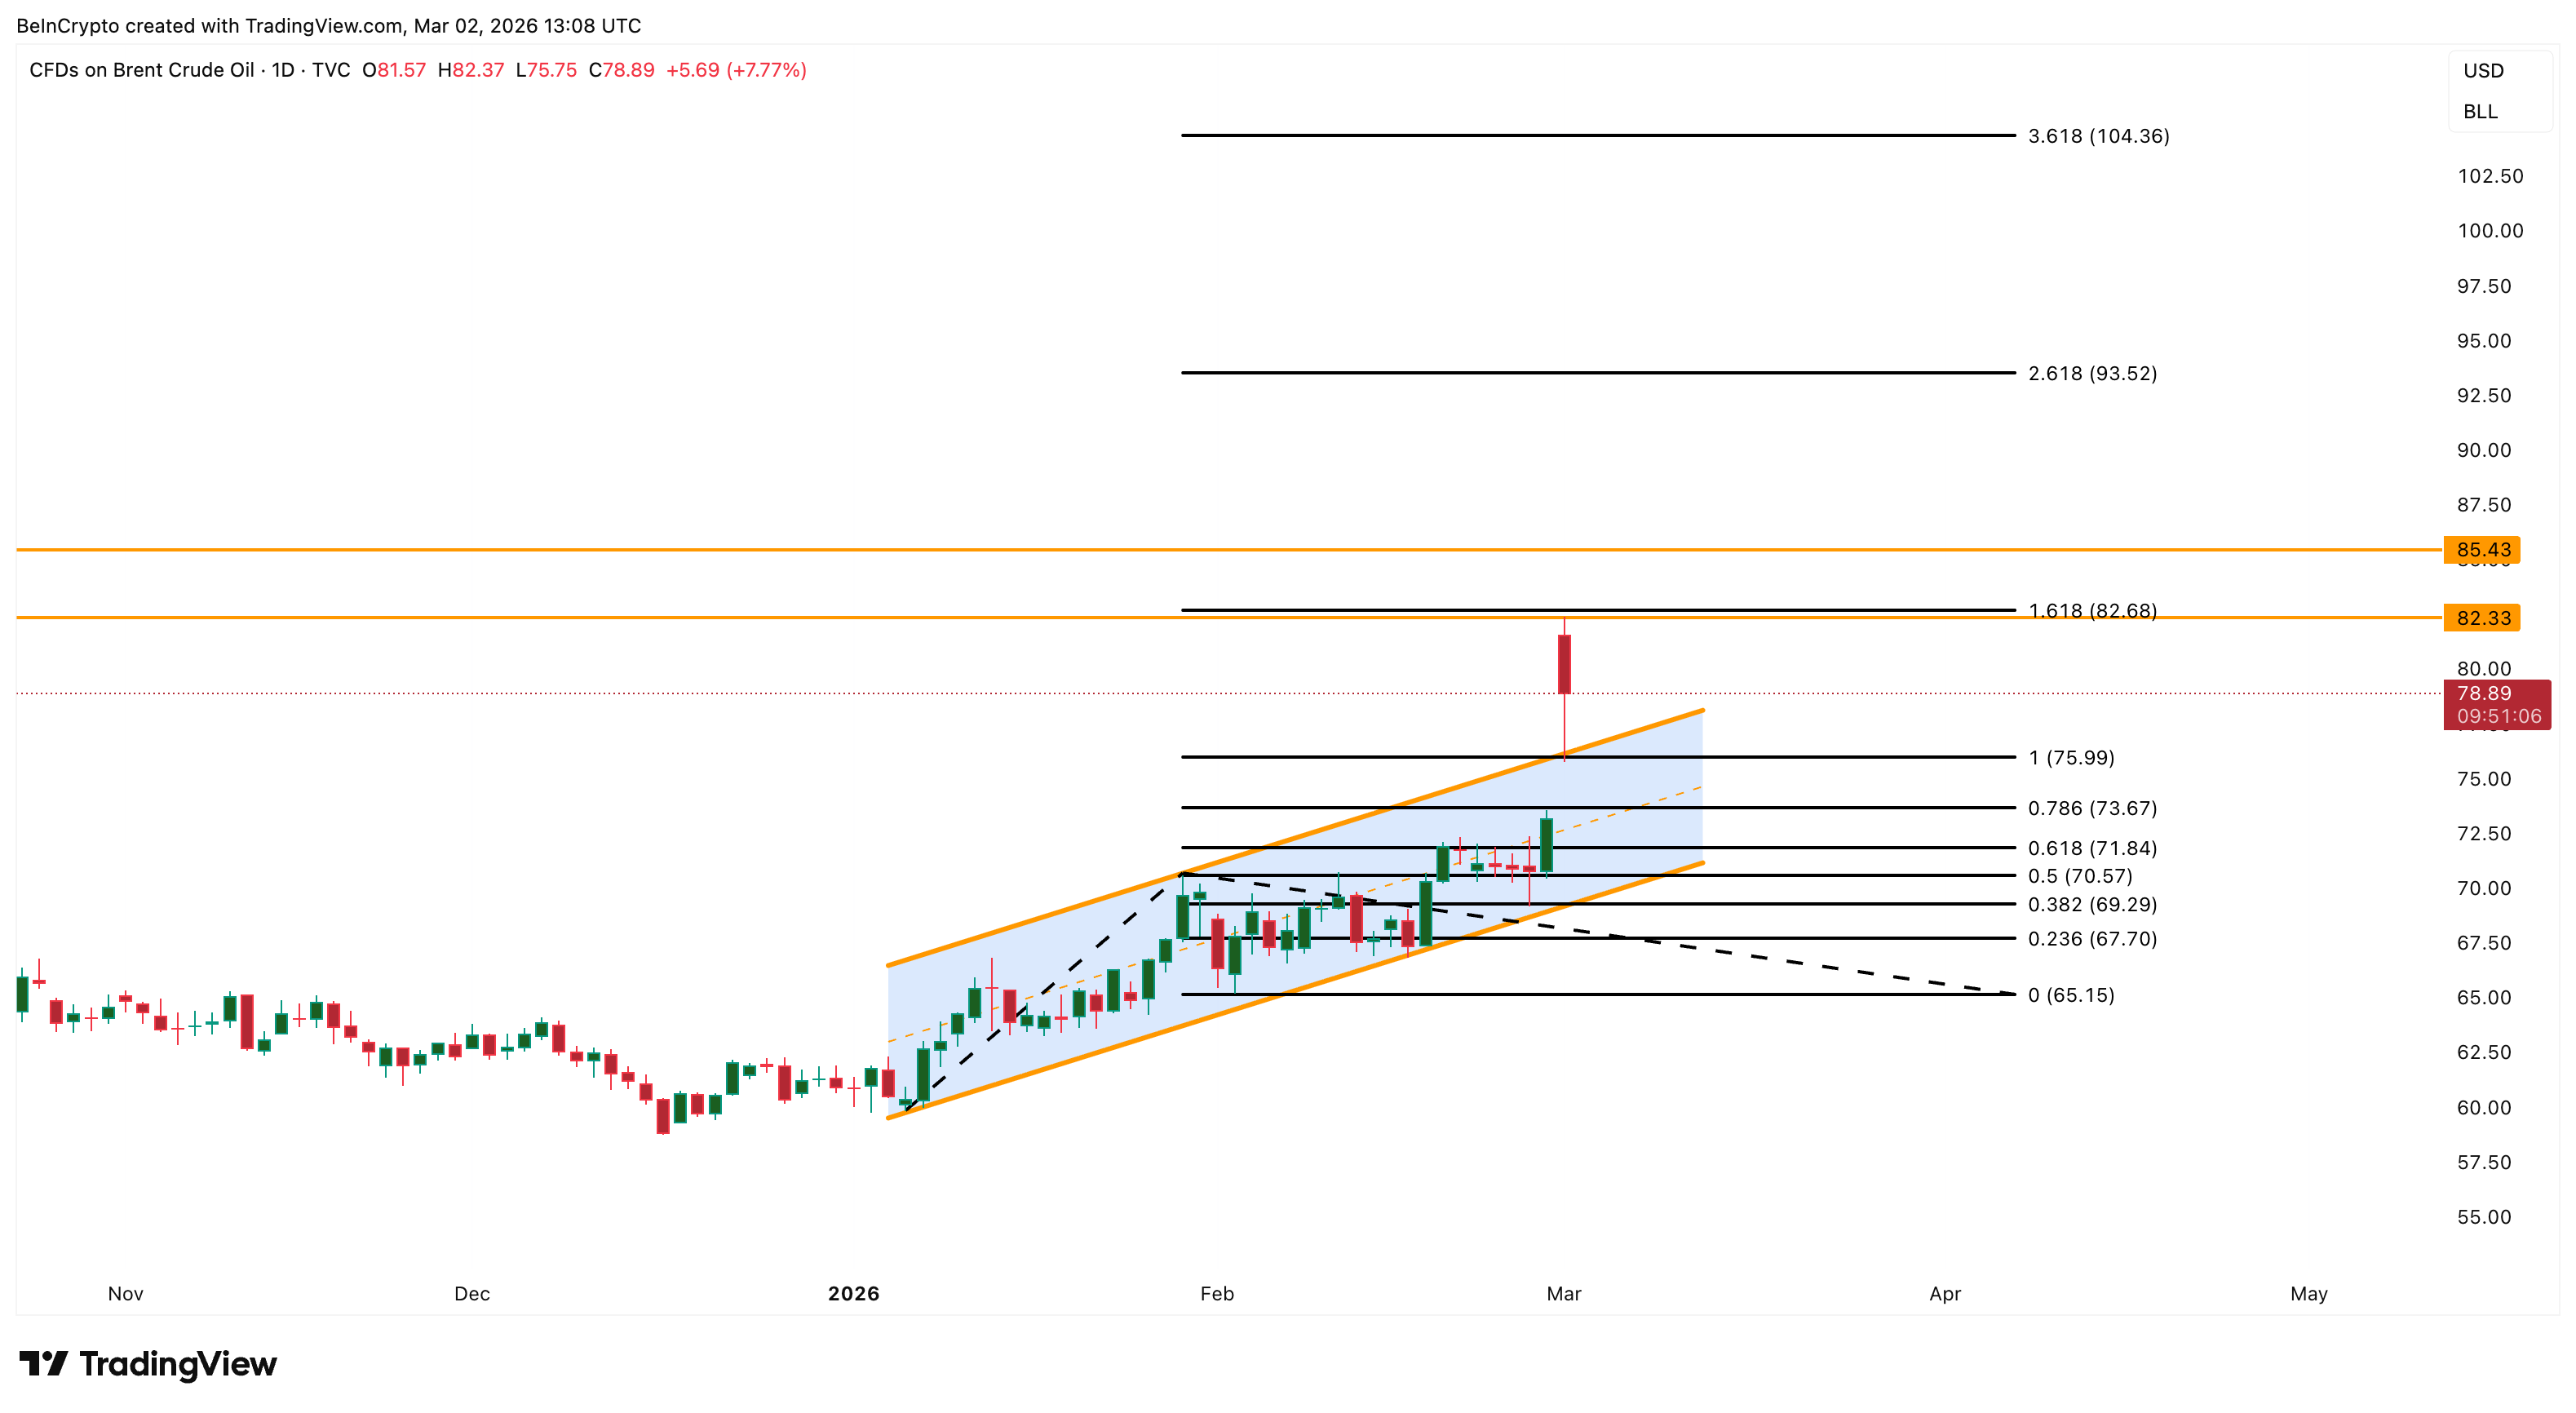
Per the chart, the first resistance remains $82, which aligns with the Fibonacci retracement (mentioned later).
If the oil price breaks above $82, the next target becomes $85, based on the ascending channel breakout projection. Above that, the next resistance levels appear at $93 and $104 if geopolitical risk continues. Adding to this current strength is the Exponential Moving Average (EMA) positioning.
This measures the average price over time while giving more weight to recent data, and recently confirmed a golden crossover where the 50-day EMA crossed above the 200-day EMA, a signal that previously preceded the latest upward move. The 100-day EMA is now rising toward the 200-day EMA, showing strengthening trend support.
 EMA Patterns: TradingView
If that bullish crossover confirms, the $85 target, based on the ascending channel’s projection, might show up first.
However, the most important support level is $75.
 Crude Oil Price Analysis: TradingView
If the oil price falls below $75, it could decline toward $73 and $71. However, the bullish structure only weakens on possible peace talks and a dip under $67.
Recommended Articles


