


Why Is The Crypto Market Down Today? Key Reasons Explained
The crypto market is in the red today, with a majority of the top-100 cryptocurrencies reflecting losses over the last 24 hours. Notably, only six altcoins, including two stablecoins, have managed to maintain a positive performance amidst a broader market sell-off.
Several complex and intertwined factors have contributed to the day’s negative market sentiment, affecting major cryptocurrencies. Over the last 24 hours, the price of Bitcoin has decreased by 4.2%, Ethereum has fallen by 5.0%, Solana has dropped by 8.7%, XRP has declined by 4.7%, and Dogecoin has decreased by 8.3%.
#1 Persistent Macroeconomic Uncertainty
A primary factor influencing today’s market movements is the evolving macroeconomic landscape, particularly concerning US interest rates and inflation expectations. At the beginning of the year, the market anticipated aggressive monetary easing by the Federal Reserve. However, the sentiment has shifted considerably based on recent data and Federal Reserve signals.
“Markets are pricing in fewer rate cuts for this year compared to the Fed’s dot plot projection of 3 rate cuts by year end. The implied fed funds rate for December has risen to 5.0%, indicating that the futures market is pricing in only 1 to 2 rate cuts,” Cetera Investment Management stated via X (formerly Twitter).
This week, all eyes are on the release of the Personal Consumption Expenditures (PCE) price index for March—the Fed’s favored inflation measure on Friday, April 26 at 8:30 am EDT. Until then, the market could be in a derisk mode.
The PCE is anticipated to present a varied view of inflation trends, which could strengthen the Federal Reserve’s inclination to delay any increases in interest rates. Analysts predict a slight increase in the overall PCE Price Index, rising to 2.6% year-over-year from 2.5% in February. Additionally, they expect a decrease in the index’s month-over-month change, dropping to 0.30% from 0.33%.
#2 Crypto Market In Shock Over Legal Action Against Samourai WalletThe crypto market has also been rocked by yesterday’s legal developments involving the Samourai Wallet. The US Federal prosecutors’ decision to charge the founders Keonne Rodriguez and William Lonergan Hill with money laundering and operating an unlicensed money transmitting business has sent ripples through the crypto community. This action underscores the ongoing regulatory scrutiny within the crypto space.
The prosecution of Samourai Wallet’s founders not only raises questions about the future of cryptographic privacy but also significantly impacts market sentiment as it underscores the legal risks inherent in the crypto sector. The implications of this case extend beyond the immediate legal concerns, influencing broader market perceptions and investor confidence.
#3 Bitcoin And Crypto Are “Just Ranging”Further insights into market dynamics come from prominent crypto analysts who have commented on the state of market liquidity and trader behavior. “The market has gifted us with a beautiful reset in trader positioning for Bitcoin. OI weighted funding turned negative for the first time since October 2023. That was before Bitcoin ran from 27k to 46k without any meaningful dip,” said Ted, a crypto analyst on X.
This reset refers to a reduction in the overheated futures market, which could allow the market to consolidate and potentially build a base for future upward movements.
Emperor, another crypto analyst, described the current market state through a series of tweets, highlighting the ongoing consolidation phase post-highs: “Too much panic still on the timeline but we’ve been ranging since the ATH, that’s all.”
He added, “The bear/bull line is an important resistance Point of Control (PoC) of our range. Expecting VaL (Value Area Low) to hold on pullbacks and VaH (Value area High) to be the next target on longs if we reclaim level 1.”
#4 Bitcoin ETFs Remain MutedBitcoin Price Update
Too much panic still on the timeline but We've been ranging since the ATH, that's all
1. The bear/bull line is a important resistance Point of Control (PoC) of our range. Expecting VaL (Value Area Low) to hold on pullbacks and VaH(Value area High ) to… pic.twitter.com/4UTExqQv0n
— Emperor
(@EmperorBTC) April 24, 2024
Yesterday’s ETF flows were negative again. Only Fidelity’s FBTC and Ark Invest’s ARKB had minimal inflows. GBTC sold more again at -$130.4m and BlackRock had zero inflows for the first time ever since inception on January 11. Thus, BlackRock’s (IBIT) inflow streak ended at 70 days. Prior to this, IBIT entered into the top 10 all time after passing the ETFs like JETS, BND and VEA.
Yesterday's ETF flows by @FarsideUK.We are back to outflows and of course it's Barry.We had $120.6 million in outflows yesterday.$GBTC did $130.4 million of outflows.
Blackrock had 0. Which means that after 70 days for the first time they didn't have any inflows.
Price… pic.twitter.com/Akh1agezb6
— WhalePanda (@WhalePanda) April 25, 2024
Notably, the momentum for spot Bitcoin ETFs has waned significantly in the past two weeks. The last notable day of inflows was on March 26, when they surpassed $400 million—nearly a month ago. On the bright side, despite this slowdown, there have been no outflows from either BlackRock or Fidelity. Grayscale’s GBTC remains the primary negative factor driving outflows.
Furthermore, there seems to be a decrease in investment willingness among traditional sector investors; the total inflows through ETFs have been stagnant for more than 30 days, coinciding with a flat trend in Bitcoin prices.
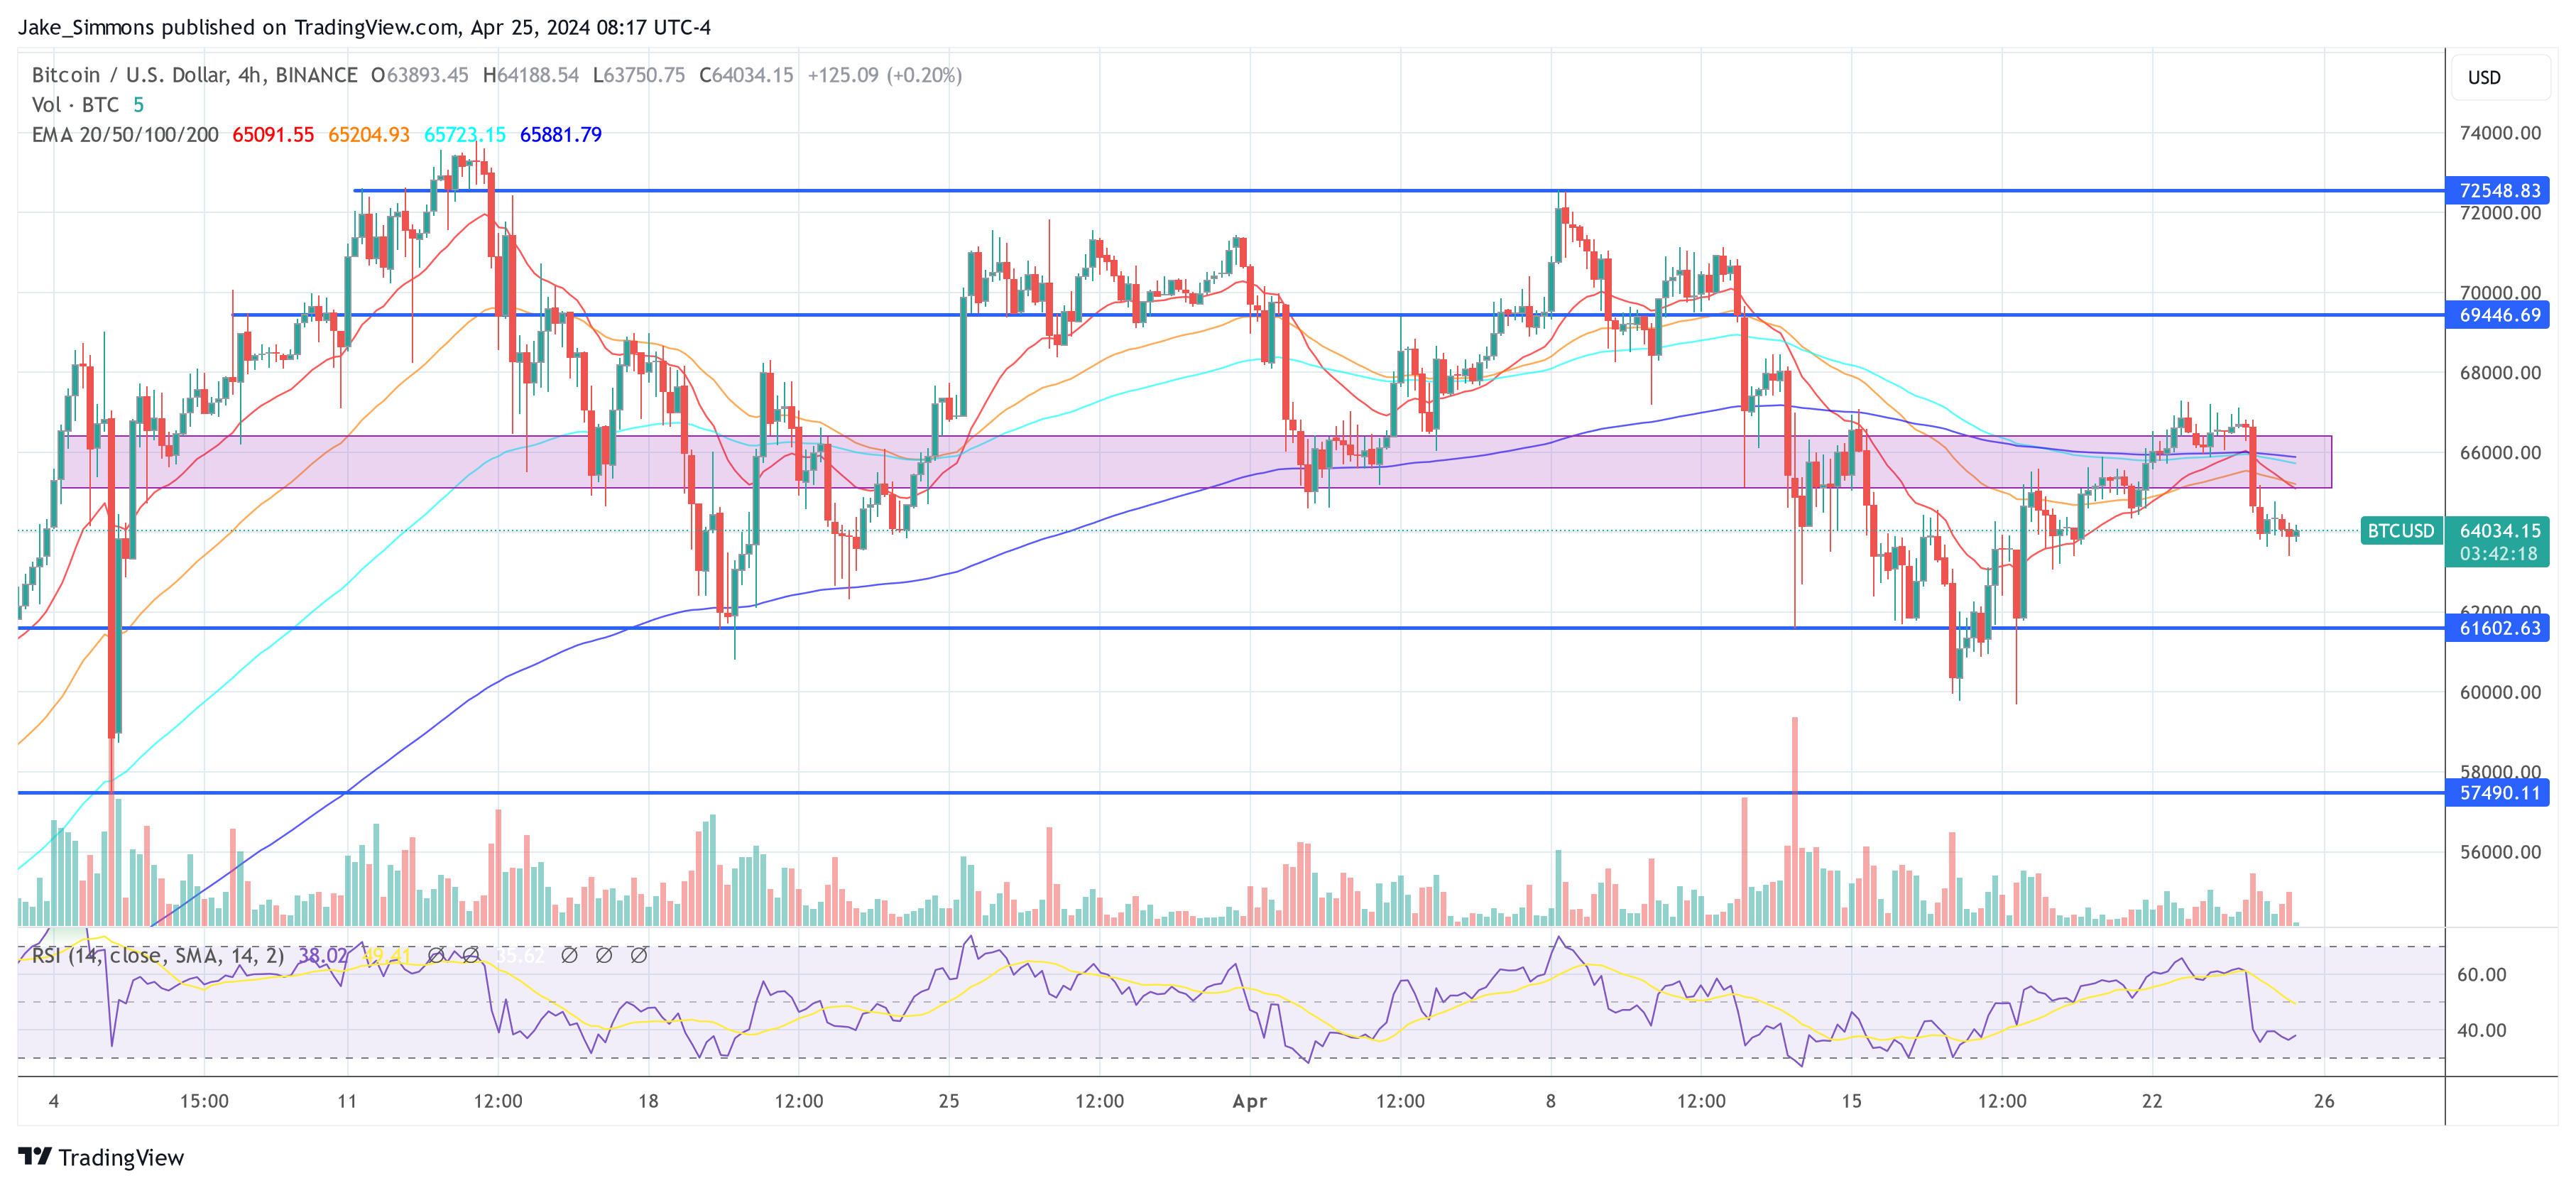
At press time, BTC traded at $64,034.
Recommended Articles


