


Ripple wallets holding up to one million XRP near all-time highs
- Ripple wallets holding up to one million XRP are close to their all-time highs on Wednesday.
- Legal expert Fred Rispoli expresses concerns about a second round of the legal battle between Ripple and the SEC.
- XRP remains range bound below $0.55 on Wednesday.
Ripple price (XRP) failed to break resistance at $0.55 early Wednesday as traders continue to digest Ripple’s recent response to the Securities and Exchange Commission’s (SEC) allegations of illegally selling XRP as a security.
About the legal battle, cryptocurrency industry attorney Fred Rispoli said a second round of litigation between Ripple and the SEC is likely. Rispoli added that the payment-remittance firm is in a great position to win the lawsuit, but also that there are “ominous signs.”
Daily digest market movers: Ripple on-chain metrics show signs of investor confidence
- The number of wallets holding between 1 and 1 million XRP tokens is nearing all-time highs, according to on-chain intelligence tracker Santiment data.
%20[10.48.34,%2024%20Apr,%202024]-638495377160685296.png)
XRP wallets holding between 1 and 1 million tokens
- Addresses holding small volumes of an asset are typically considered retail wallets. As retail investors’ XRP holdings are near all-time highs, it signals increasing confidence among market participants.
- Despite the ongoing legal battle with the SEC and regulatory hurdles faced by Ripple in the US, retail traders have increased their holdings consistently in 2024.
- Attorney Fred Rispoli, a legal expert in the crypto community, shared his take on Ripple’s response filed on April 22. Rispoli states that the parties are likely posturing for a second round of litigation as Ripple said in its filing that “Ripple tells Court if SEC wants to sue on the new contracts, it needs to bring a new enforcement action (p16).”
From suing .gov agencies multiple times over the years, the incompetency and/or corruption at such places is off the charts. It's not a show that Ripple is in on. It is 100% a hit job but the degree of the malfeasance can only be known once we look at all the internal docs…
— Fred Rispoli (@freddyriz) April 24, 2024
Technical analysis: XRP stuck below $0.55, likely to test resistance
Ripple’s recent uptrend has lost momentum after its price failed on Monday to break above $0.57, a level that aligns with the 100-day Simple Moving Average (SMA). XRP price target is the psychologically important level of $0.60, but before it has to overcome key resistance levels at $0.5574 and $0.5951. These two levels represent the 61.8% and 78.6% Fibonacci retracement of XRP decline from April 9 top of $0.6431 to April 13 low of $0.4188.
XRP price could tackle these resistances on its path to $0.60 and target the April 9 top of $0.6431 thereafter.
The green bars above the neutral line on the Moving Average Convergence/ Divergence (MACD) indicator show underlying positive momentum in XRP price uptrend. The MACD line crossed over the signal line on Monday. This crossover is typically considered a bullish sign for the asset’s price.
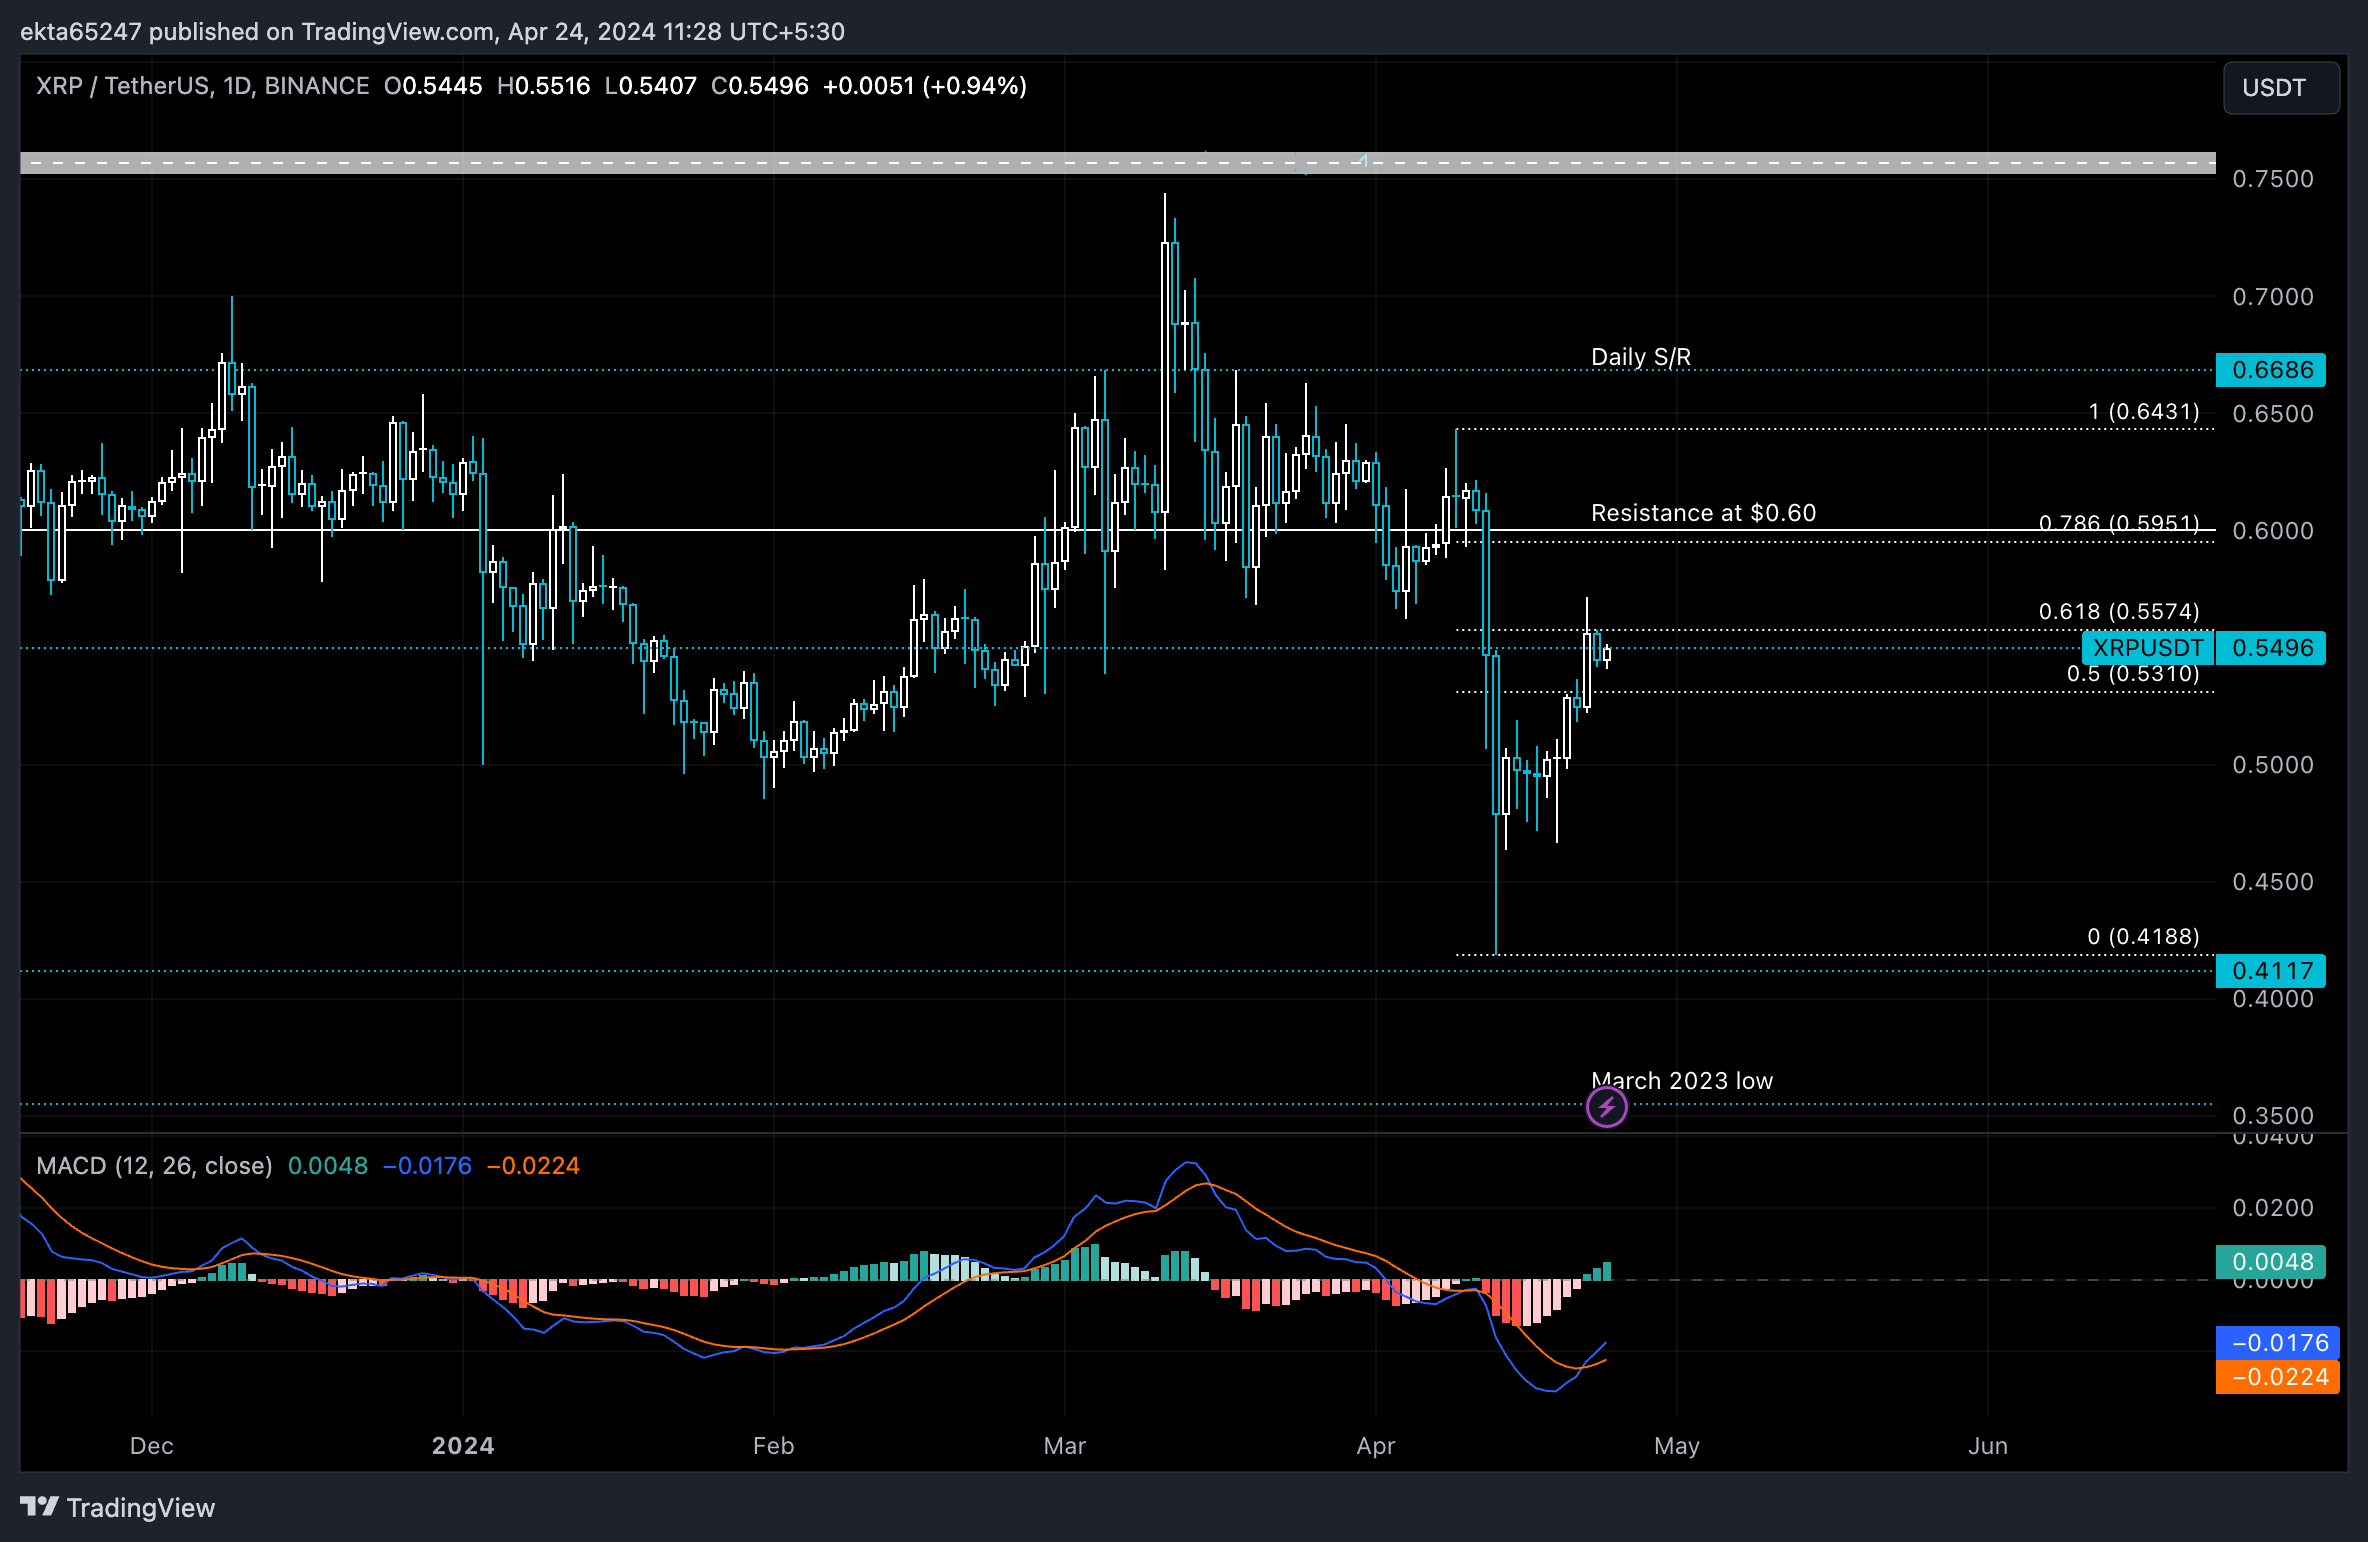
XRP/USDT 1-day chart
A daily candlestick close below $0.5310, the 50% Fibonacci retracement of the decline from the April 9 top to April 13 low, could invalidate the bullish thesis. Further down, XRP could find support at the April 13 low of $0.4188.
Bitcoin, altcoins, stablecoins FAQs
Bitcoin is the largest cryptocurrency by market capitalization, a virtual currency designed to serve as money. This form of payment cannot be controlled by any one person, group, or entity, which eliminates the need for third-party participation during financial transactions.
Altcoins are any cryptocurrency apart from Bitcoin, but some also regard Ethereum as a non-altcoin because it is from these two cryptocurrencies that forking happens. If this is true, then Litecoin is the first altcoin, forked from the Bitcoin protocol and, therefore, an “improved” version of it.
Stablecoins are cryptocurrencies designed to have a stable price, with their value backed by a reserve of the asset it represents. To achieve this, the value of any one stablecoin is pegged to a commodity or financial instrument, such as the US Dollar (USD), with its supply regulated by an algorithm or demand. The main goal of stablecoins is to provide an on/off-ramp for investors willing to trade and invest in cryptocurrencies. Stablecoins also allow investors to store value since cryptocurrencies, in general, are subject to volatility.
Bitcoin dominance is the ratio of Bitcoin's market capitalization to the total market capitalization of all cryptocurrencies combined. It provides a clear picture of Bitcoin’s interest among investors. A high BTC dominance typically happens before and during a bull run, in which investors resort to investing in relatively stable and high market capitalization cryptocurrency like Bitcoin. A drop in BTC dominance usually means that investors are moving their capital and/or profits to altcoins in a quest for higher returns, which usually triggers an explosion of altcoin rallies.
Recommended Articles


