

Akash Network (AKT) Leads Crypto Top 100 With 46% Rise Today: Here’s Why

Source Newsbtc

Amidst a rather quiet altcoin market, Akash Network (AKT) has emerged as today’s standout performer among the top 100 cryptocurrencies by market capitalization, recording a significant 46% increase in price over the past 24 hours. This surge has propelled AKT to the forefront, well ahead of its peers such as Core (CORE) and Arweave (AR), which posted gains of 7% and 6%, respectively.

As of this writing, AKT is trading at $6.03. This increase in price has pushed its market cap to approximately $1.4 billion, positioning it as the 68th-largest cryptocurrency. Additionally, Akash Network’s trading volume has seen a dramatic rise of 2,790%, reaching $116 million today.

Earlier today, AKT reached a new all-time high of $6.84 on the cryptocurrency exchange Kraken, though it has since adjusted to around $6.03, below its previous peak of $6.49.

Catalysts For The Akash Network Surge

The primary driver behind today’s price escalation appears to be an announcement from Upbit, a major South Korean cryptocurrency exchange. Upbit has confirmed that it will list AKT, offering trading pairs in South Korean Won (KRW), Bitcoin (BTC), and Tether (USDT) starting at 10:00 UTC today.

Further fueling investor interest, data from Santiment, a market intelligence platform, shows that Akash Network’s social media volume has spiked by 200% in the last 24 hours. This surge in social activity, predominantly on platforms like Reddit and Bitcointalk, has played a significant role in AKT’s market performance.

Future Price Trajectory

Looking ahead, if AKT’s price can record a daily close above the previous all-time high of $6.49 (set on March 11, 2024) today, the next target could be $7.46, corresponding to the 1.272 Fibonacci extension of the overarching price movement. Should the buying pressure continue, a move towards $8.64, marked by the 1.618 Fibonacci extension, might be on the horizon. Here, traders should anticipate potential profit-taking.
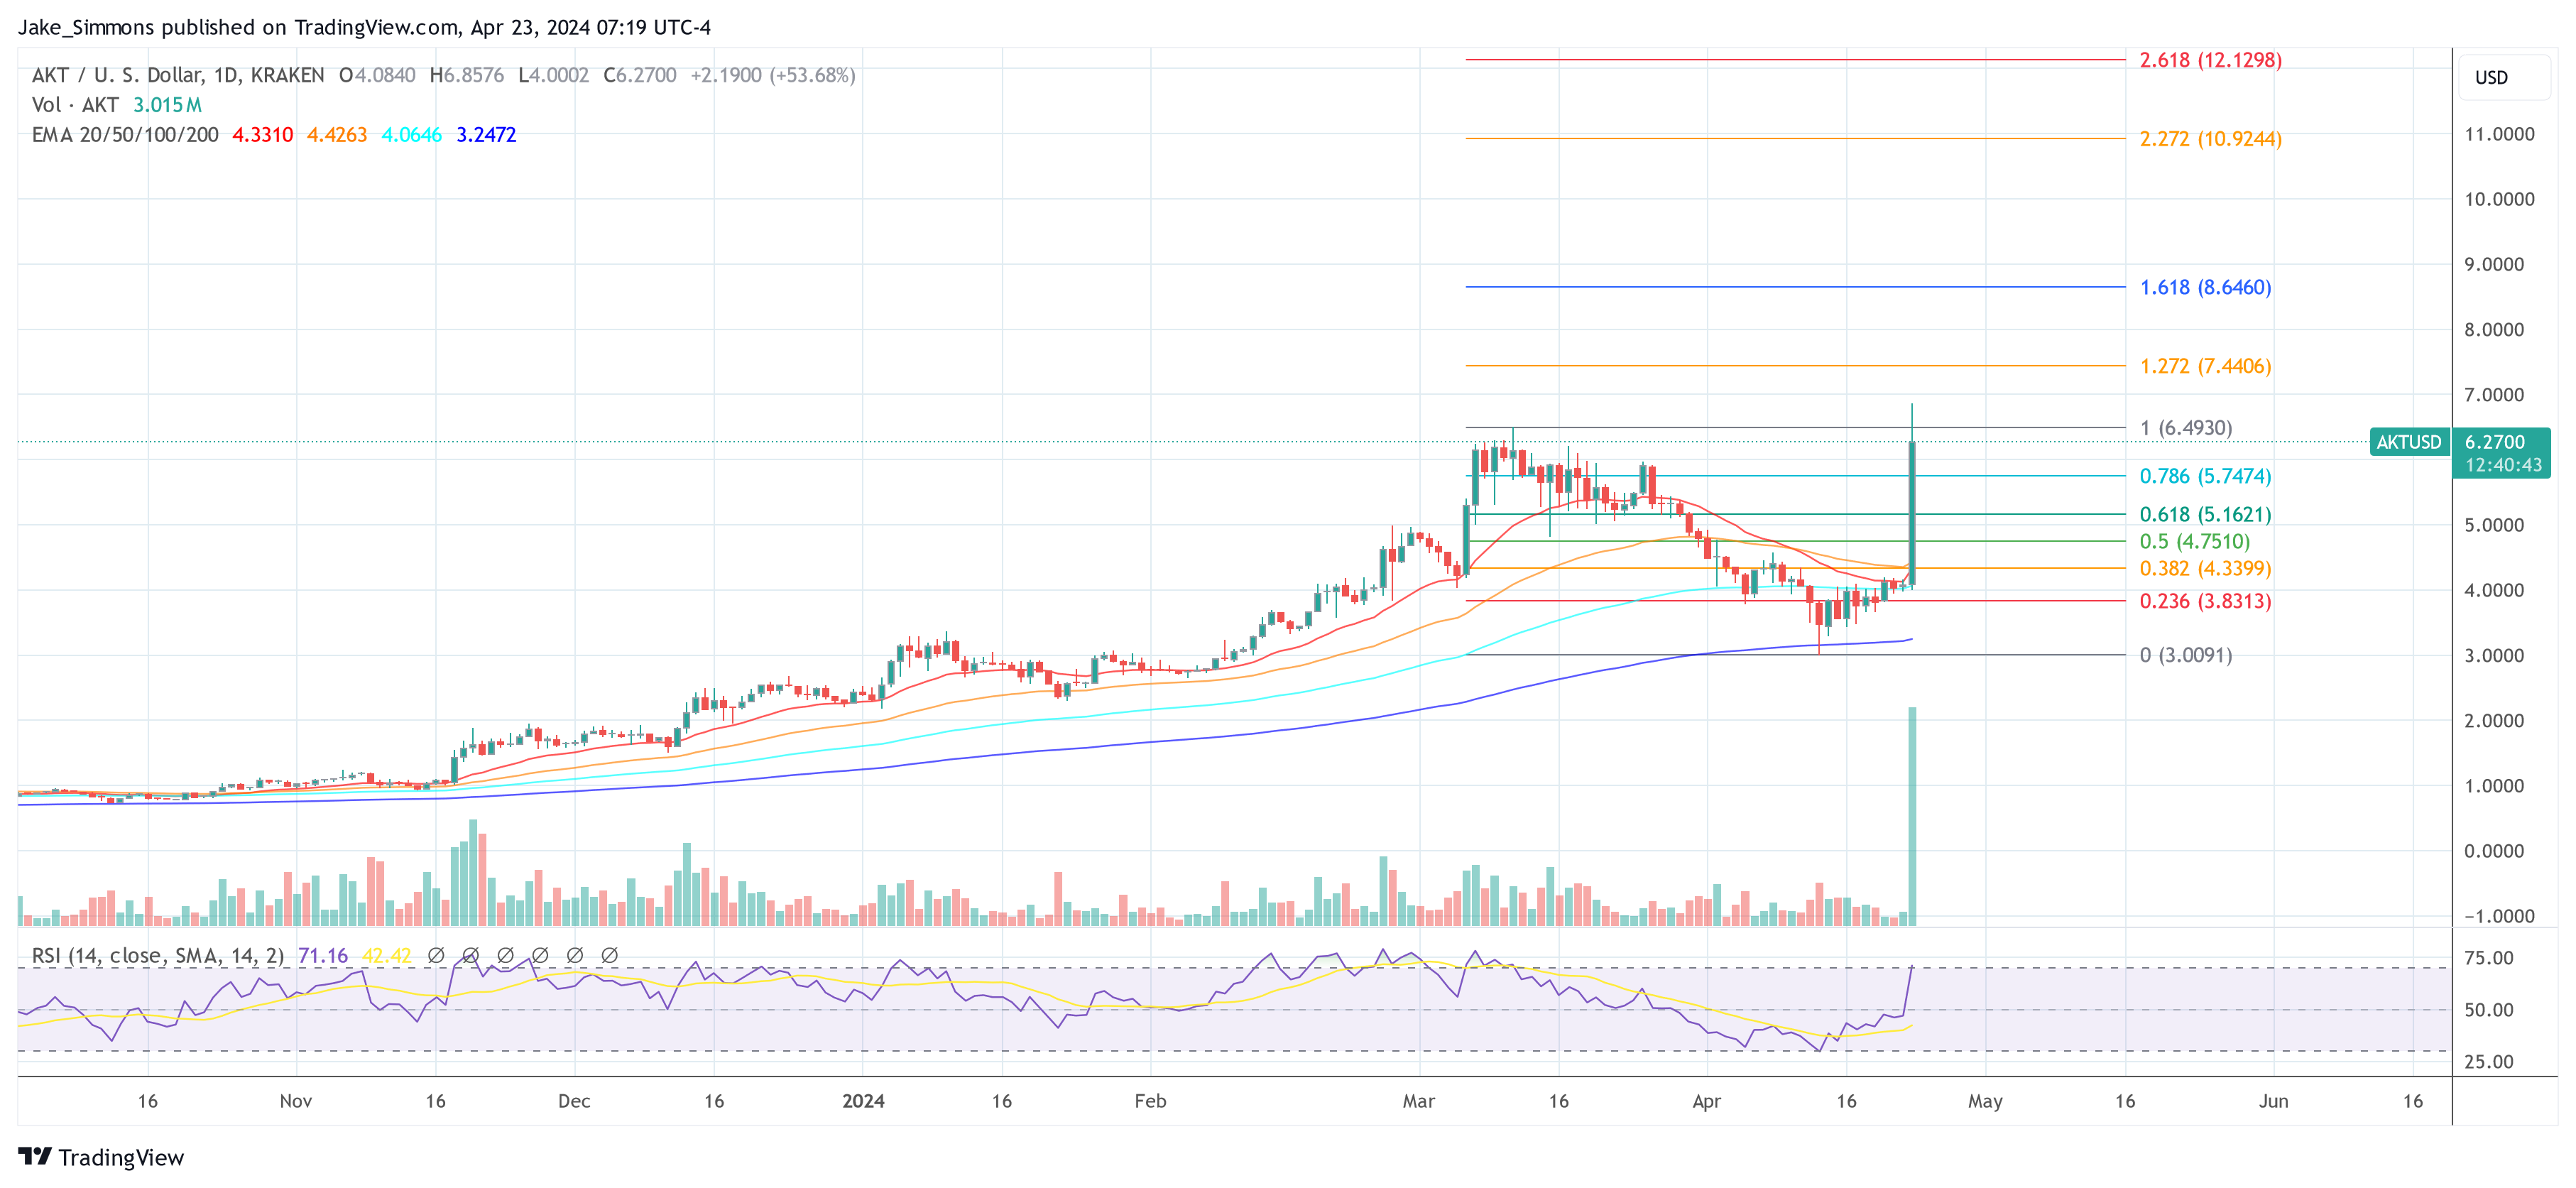
Akash Price

A breakthrough beyond this level could pave the way to medium-term targets at $10.92 (2.272 Fibonacci extension) and potentially even $12.13 (2.618 Fibonacci projection), contingent on continued bullish sentiment across the broader crypto market.

Conversely, if AKT fails to uphold its new highs and closes below $6.48, a downward correction towards the $5.74 zone (0.786 Fibonacci level) could occur, where new buying opportunities might arise. A further dip below this level could see retests of the $5.16 (0.618 Fibonacci level) and $4.75 (0.5 Fibonacci level) support zones.

The trajectory of AKT, like that of many cryptocurrencies, could be influenced by broader market conditions, including potential downturns triggered by accelerating US inflation, the US Fed’s favorite inflation gauge, the Personal Consumption Expenditures Price Index (PCE) is set for release on Friday, April 26, or other macroeconomic factors.

Nevertheless, the 200-day exponential moving average (EMA), currently at $3.24, remains the most critical long-term support level for AKT.

Disclaimer: For information purposes only. Past performance is not indicative of future results.
placeholder
Hot August jobs report reignites Fed-hike bets; S&P 500 slips below 7,700 — what to watch before the September FOMCAugust nonfarm payrolls surged to 162,000, three times the consensus, pushing CME FedWatch odds of a September 25-bp hike to 58.4% and dragging the S&P 500 below 7,700. CPI, PPI and the Sept 15-16 FOMC decision now set the tone for US stocks.
Author  Irene Q.
Sep 07, Mon
August nonfarm payrolls surged to 162,000, three times the consensus, pushing CME FedWatch odds of a September 25-bp hike to 58.4% and dragging the S&P 500 below 7,700. CPI, PPI and the Sept 15-16 FOMC decision now set the tone for US stocks.
placeholder
Japanese Yen rallies to February 18 high as upbeat wage data and GDP lift BoJ hike betsThe USD/JPY pair declines for the second straight day – also marking the fourth day of a fall in the previous five – and sinks to its lowest level since February 18, around mid-153.00s during the Asian session on Tuesday.
Author  FXStreet
Sep 08, Tue
The USD/JPY pair declines for the second straight day – also marking the fourth day of a fall in the previous five – and sinks to its lowest level since February 18, around mid-153.00s during the Asian session on Tuesday.
placeholder
Gold slumps to near $4,350 amid oil-driven inflation fears, US inflation data in focusGold price (XAU/USD) falls to near $4,350 during the early Asian session on Wednesday. The precious metal faces some selling pressure as rising oil prices fueled inflation ‌concerns and boosted expectations for a rate hike by the Federal Reserve (Fed) in September.
Author  FXStreet
Sep 09, Wed
Gold price (XAU/USD) falls to near $4,350 during the early Asian session on Wednesday. The precious metal faces some selling pressure as rising oil prices fueled inflation ‌concerns and boosted expectations for a rate hike by the Federal Reserve (Fed) in September.
placeholder
Brent holds above $100 as tanker attacks tighten supply — but four forces are capping the rallyBrent crude is holding above $100 a barrel for a second session, its first close above the level since late July, as tanker attacks near the Strait of Hormuz squeeze an already tight physical market. Yet the rally has been gradual: 8.3 mb/d of Gulf output is still shut in, diesel is at a record, and forecasts now range from $74 to $100.
Author  Irene Q.
Yesterday 07: 34
Brent crude is holding above $100 a barrel for a second session, its first close above the level since late July, as tanker attacks near the Strait of Hormuz squeeze an already tight physical market. Yet the rally has been gradual: 8.3 mb/d of Gulf output is still shut in, diesel is at a record, and forecasts now range from $74 to $100.
placeholder
US August CPI lands tonight: after a 5.4% PPI shock, will the Fed hike on September 16?US August PPI came in at 5.4% year-on-year, above the 5.3% consensus, with core PPI at 4.6%. Traders have pushed the odds of a 25bp Fed hike on September 15-16 to around 70%. Tonight's CPI is the last major inflation print before the decision — here is the full calendar, the consensus numbers, and what a hot versus cool reading would mean for the dollar, yields, gold and stocks.
Author  Irene Q.
6 hours ago
US August PPI came in at 5.4% year-on-year, above the 5.3% consensus, with core PPI at 4.6%. Traders have pushed the odds of a 25bp Fed hike on September 15-16 to around 70%. Tonight's CPI is the last major inflation print before the decision — here is the full calendar, the consensus numbers, and what a hot versus cool reading would mean for the dollar, yields, gold and stocks.
goTop
quote