Pi Coin Declines 25% in 20 Days as Investor Outflows Increase

Source Beincrypto

Pi Coin has faced sustained selling pressure over recent weeks, pushing its price to a multi-week low. The altcoin has declined sharply alongside broader market weakness, with Bitcoin acting as a key drag. 

Waning investor support and rising withdrawals have intensified downside pressure, limiting any meaningful recovery attempts.

Pi Coin Follows Bitcoin

On-chain indicators reflect deteriorating sentiment among Pi Coin holders. The Chaikin Money Flow shows heavy withdrawals, with the indicator dropping to an eight-month low. This reading signals strong capital outflows, suggesting investors are reducing exposure amid continued price weakness.

The sustained selling reflects fading confidence following repeated failed recovery attempts. Many holders appear unwilling to wait for a rebound, choosing instead to exit positions. 

Want more token insights like this? Sign up for Editor Harsh Notariya’s Daily Crypto Newsletter here.

Pi Coin CMF
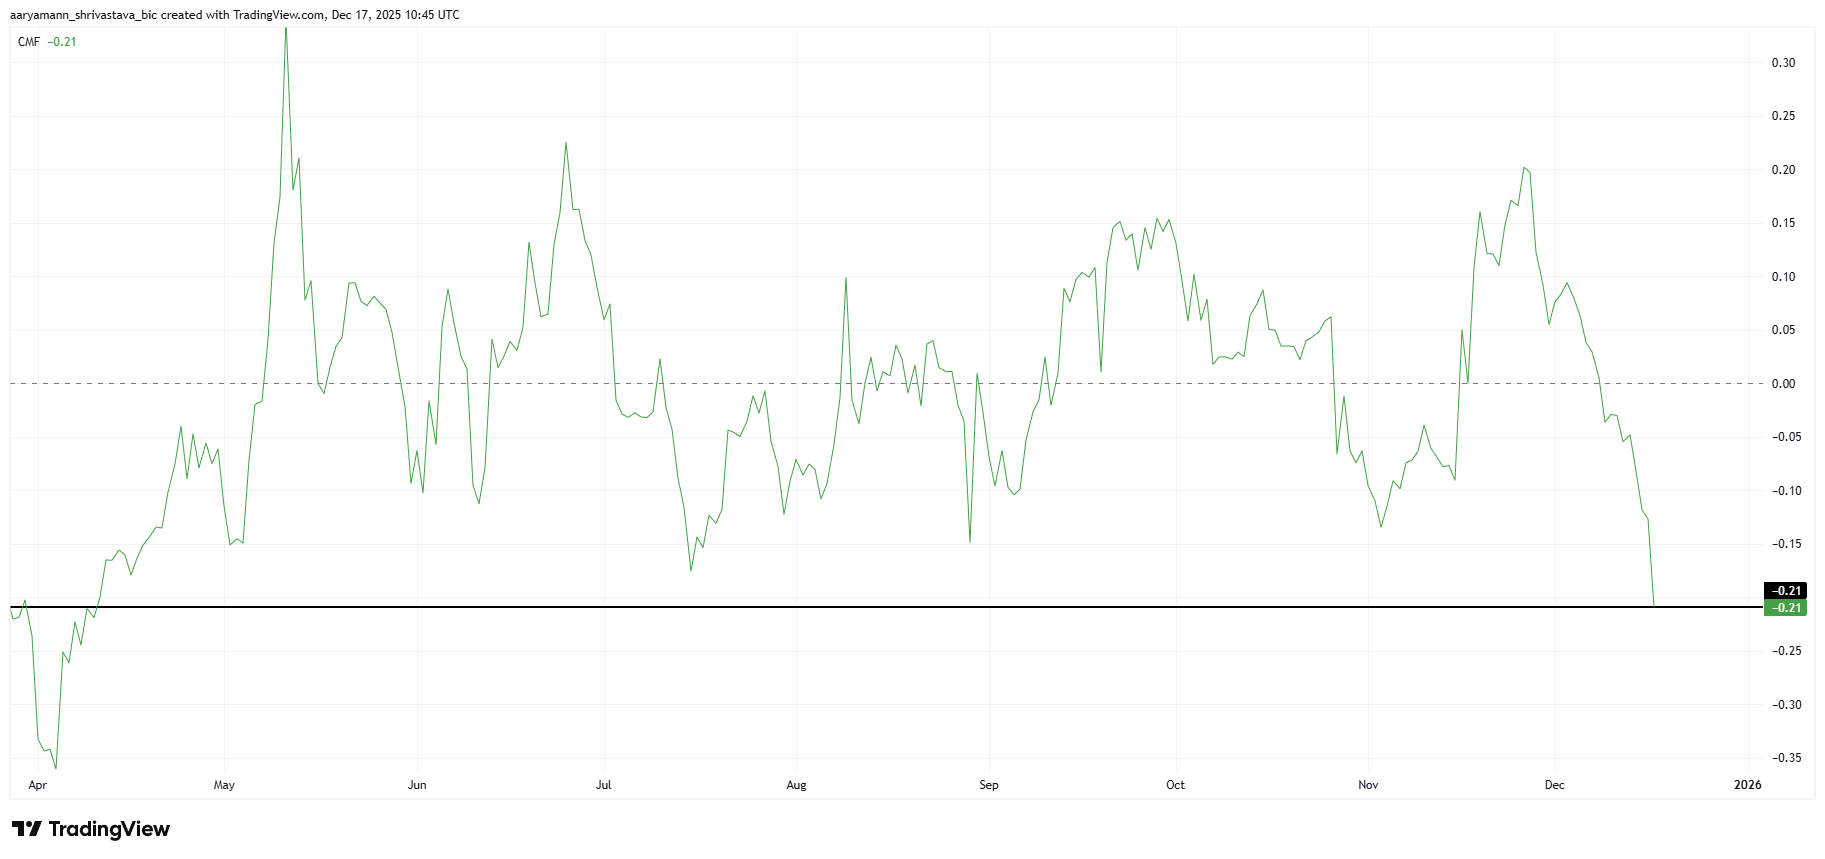
Pi Coin CMF. Source: TradingView

Pi Coin’s macro momentum remains closely tied to Bitcoin’s performance. The correlation between PI and Bitcoin currently stands at 0.42. This relationship turned positive after steadily improving over nearly three weeks, mirroring the period of Pi Coin’s recent price decline.

This alignment has worked against PI. As Bitcoin corrected, Pi Coin followed lower, magnifying losses. A rising correlation during a downtrend often increases vulnerability, as independent recovery becomes less likely without broader market stabilization or asset-specific catalysts.

Pi Coin Correlation To Bitcoin
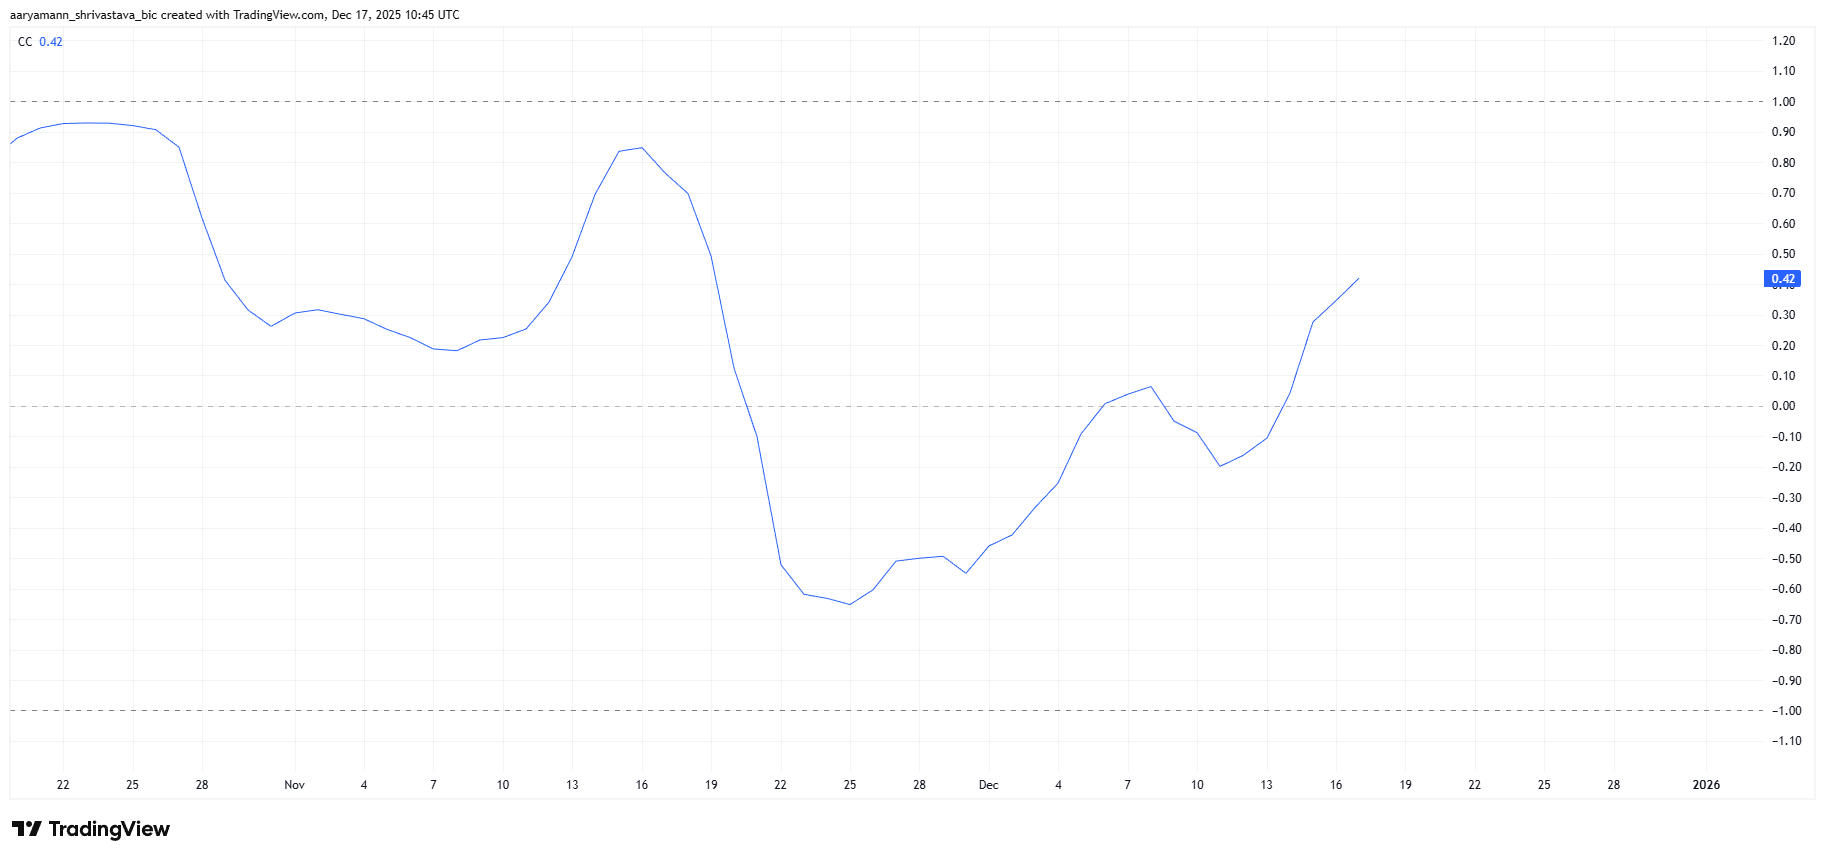
Pi Coin Correlation To Bitcoin. Source: TradingView

PI Price Falls To Its Critical Support

At the time of writing, Pi Coin trades at $0.201, reflecting a 25% decline over the past 20 days. The drop followed a failed attempt to break above the $0.272 resistance. Rejection at that level marked a clear shift toward sustained bearish momentum.

Pi Coin is now testing the $0.198 support, an eight-week low that has previously acted as a floor. This level remains critical. However, bearish signals persist, and a breakdown could push PI toward $0.188 or even $0.180, extending the downtrend.

Pi Coin Price Analysis. 
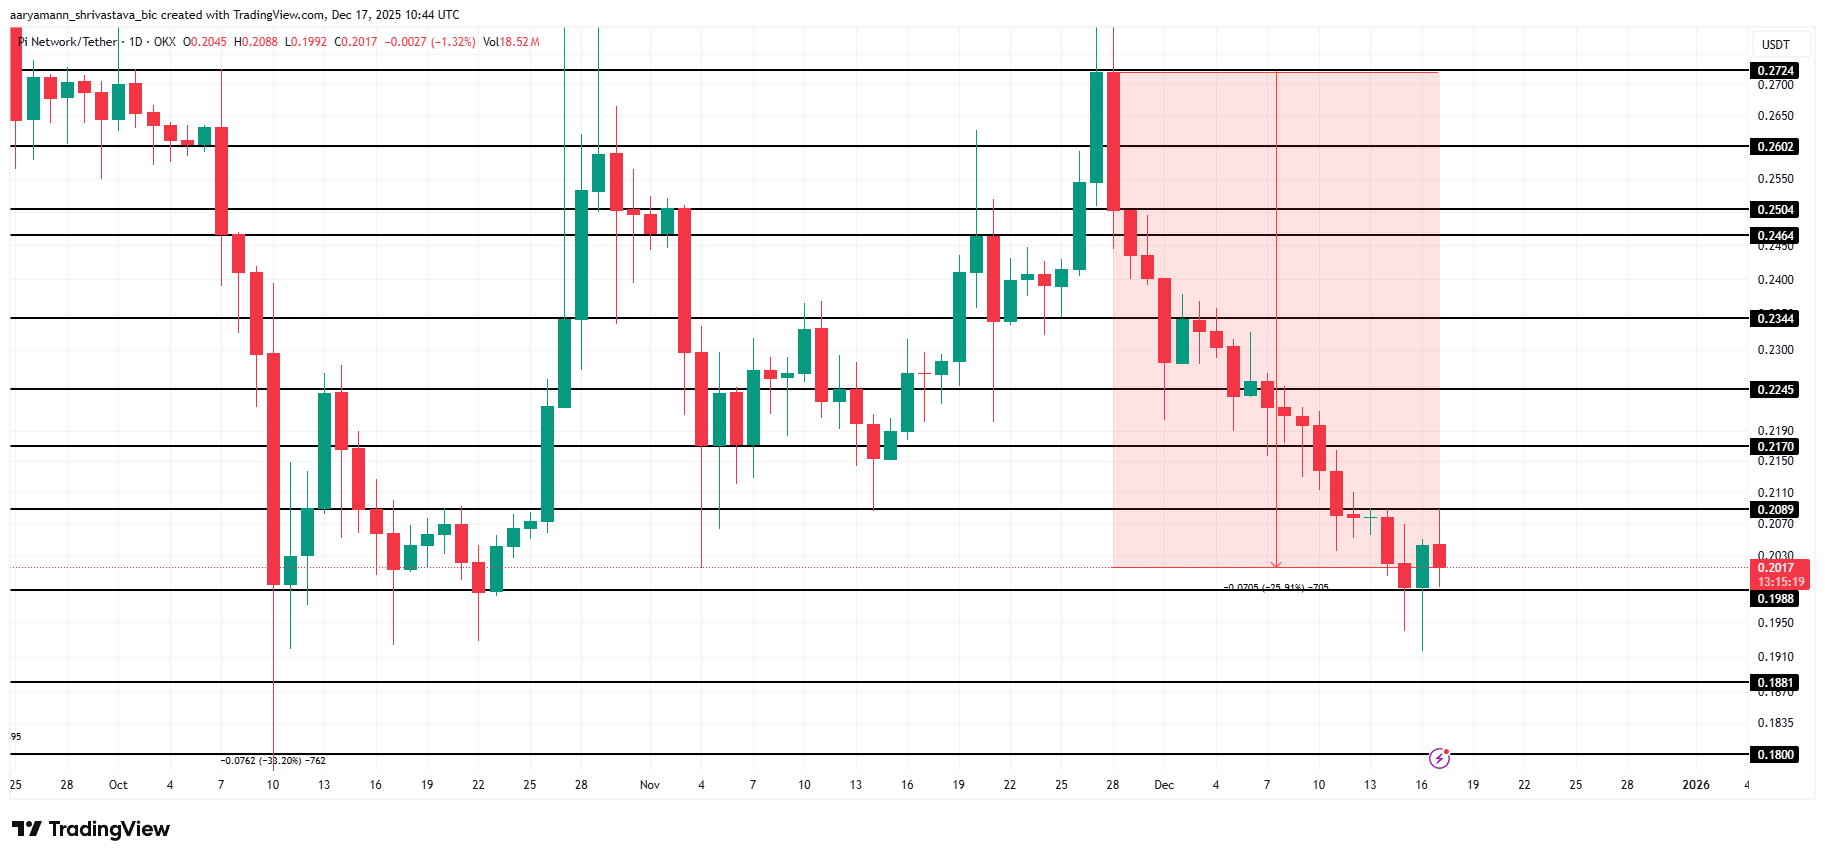
Pi Coin Price Analysis. Source: TradingView

A recovery scenario remains possible if historical patterns repeat. A successful bounce from $0.198 could restore short-term confidence. If Pi Coin reclaims $0.208 as support, the bearish thesis would weaken. Such a move may allow PI to rise toward $0.217, signaling temporary relief.

Disclaimer: For information purposes only. Past performance is not indicative of future results.
placeholder
Tesla Stock Hits Record High as Robotaxi Tests Ignite Market. Why Is Goldman Sachs Pouring Cold Water on Tesla?TradingKey - For Tesla investors, a challenging start to the year has now taken a significant turn.After a 36% stock plunge in the first quarter—its worst performance since 2022—Tesla shares surged ov
Author  TradingKey
11 hours ago
TradingKey - For Tesla investors, a challenging start to the year has now taken a significant turn.After a 36% stock plunge in the first quarter—its worst performance since 2022—Tesla shares surged ov
placeholder
Pound Sterling slumps as UK inflation falls by more than expected to 3.2%The Pound Sterling (GBP) faces intense selling pressure against its major currency peers on Wednesday and slides over 0.5% to near 1.3340 against the US Dollar (USD), following the release of the United Kingdom (UK) Consumer Price Index (CPI) data for November.
Author  FXStreet
12 hours ago
The Pound Sterling (GBP) faces intense selling pressure against its major currency peers on Wednesday and slides over 0.5% to near 1.3340 against the US Dollar (USD), following the release of the United Kingdom (UK) Consumer Price Index (CPI) data for November.
placeholder
XRP’s Price Action Flashes a Warning Even as ETF Flows Stay PositiveXRP’s structure remains weak despite 18 straight positive closes in spot XRP ETFs, with analysts warning that $1.98 and other nearby resistance zones could cap rebounds unless the YO region is reclaimed, while deeper downside scenarios keep $1.53 on watch as a potential (not guaranteed) accumulation area.
Author  Mitrade
14 hours ago
XRP’s structure remains weak despite 18 straight positive closes in spot XRP ETFs, with analysts warning that $1.98 and other nearby resistance zones could cap rebounds unless the YO region is reclaimed, while deeper downside scenarios keep $1.53 on watch as a potential (not guaranteed) accumulation area.
placeholder
Bitcoin-to-Gold Ratio Plummets 50% as Gold Breaks $4,000 in 2025In 2025, gold outpaced Bitcoin, slashing the BTC-to-gold ratio by half from 40 to 20 ounces per BTC.
Author  Mitrade
15 hours ago
In 2025, gold outpaced Bitcoin, slashing the BTC-to-gold ratio by half from 40 to 20 ounces per BTC.
placeholder
December Santa Claus Rally: New highs in sight for US and European stocks?Historical data show a rising trend of US and European stocks in December. If the momentum is strong, fund managers may rush in with a buying frenzy.
Author  Mitrade
18 hours ago
Historical data show a rising trend of US and European stocks in December. If the momentum is strong, fund managers may rush in with a buying frenzy.
goTop
quote