How a Potential Russia–Ukraine Ceasefire Could Impact Crypto Markets

Source Beincrypto

Diplomatic efforts to end the Russia–Ukraine war gained visible momentum on Monday, as US, Ukrainian, and European officials outlined the foundations of a possible ceasefire and post-war security framework.

The developments mark one of the most substantive diplomatic advances since the conflict began. The positive signs are already prompting investors to reassess geopolitical risk across global markets, including cryptocurrencies.

For crypto, which has recently suffered sharp declines tied to global risk-off dynamics, a ceasefire could alter sentiment, but not without important caveats.

Diplomatic Momentum Builds For Russian-Ukraine Ceasefire

Negotiators from Ukraine, the US, and key European allies met in Berlin this week for an intensive round of talks focused on ending hostilities and preventing renewed conflict. 

Officials involved in the discussions described progress as significant, with alignment reached on most elements of a proposed framework.

US officials confirmed that Washington has agreed to support meaningful security guarantees for Ukraine as part of a peace arrangement, addressing Kyiv’s long-standing demand for protection against future aggression. 

According to officials familiar with the talks, negotiators are now aligned on roughly 90% of the framework. 

However, remaining disagreements centered on territorial questions in eastern Ukraine, particularly in the Donetsk region.

European leaders reinforced the diplomatic push by endorsing plans for a European-led multinational force that would assist in stabilizing Ukraine if a ceasefire holds. The proposal also includes a US-backed monitoring and verification mechanism designed to oversee ceasefire compliance and respond to violations.

Public opinion inside Ukraine continues to act as a constraint on negotiations. Polling cited by Reuters shows that most Ukrainians oppose major territorial concessions or limits on the country’s military capabilities unless backed by firm and enforceable security commitments.

Fighting Continues Despite Negotiations

Even as diplomacy advances, military operations have not paused. On Monday, Ukrainian forces carried out additional long-range drone strikes against Russian oil infrastructure in the Caspian Sea, disrupting production at key platforms for the third time in recent days. 

The attacks highlight Kyiv’s strategy of applying economic pressure on Russia’s energy revenues while negotiations remain unresolved.

Ukraine also claimed it struck a Russian Kilo-class submarine in the port of Novorossiysk using underwater drones. 

If confirmed, would underscore the growing sophistication of Ukraine’s asymmetric naval capabilities. Independent verification of the claim remains limited, and Russian officials have denied damage.

What a Ceasefire Could Mean for Crypto Markets

1. Reduced Safe-Haven Demand, Improved Risk Appetite

A credible ceasefire would remove one of the largest sources of global tail risk. In markets where risk sentiment is a major driver, such a de-escalation can:

  • Boost risk assets broadly, reducing demand for traditional safe havens like the US Treasuries and the US dollar.
  • Support assets like Bitcoin and major altcoins as investors rotate back toward higher-beta investments.
  • Lower implied volatility across equity and digital asset markets.

The mechanics are straightforward: with reduced geopolitical risk, funds that fled to safety may redeploy into risk assets, potentially lifting Bitcoin and Ethereum prices. A stronger risk appetite could also benefit altcoins, which tend to outperform in relief rallies.

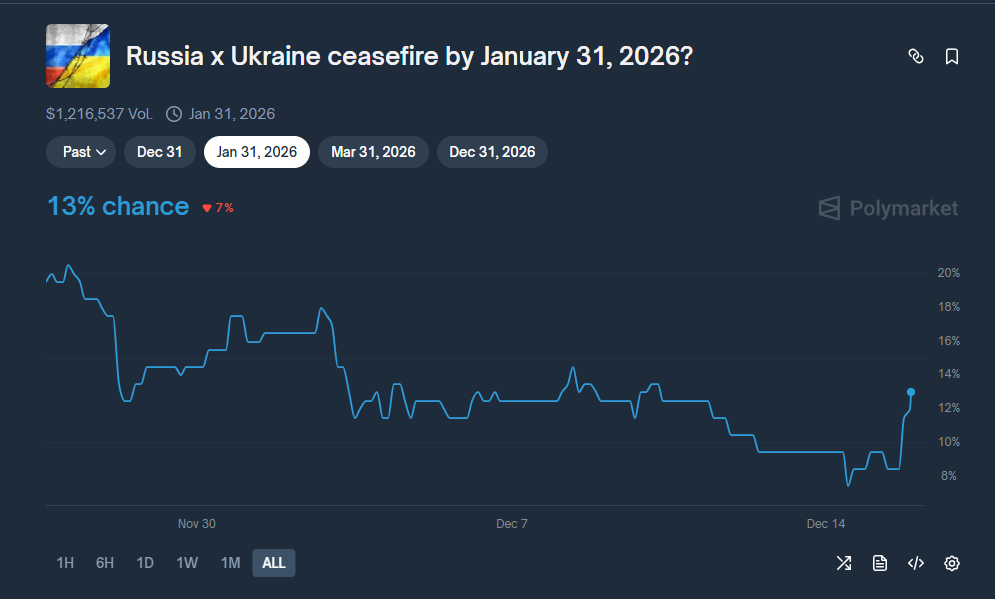
Polymarket Odds On Russia-Ukraine Ceasefire By Early 2026 Have Increased. Source: Polymarket

2. Energy and Inflation Narrative

A sustained ceasefire could also affect commodity markets, especially if it lessens pressure on energy prices. Lower or stabilized global energy prices could:

  • Dampen inflation expectations in Europe and elsewhere.
  • Reduce pressure on central banks to maintain restrictive policy settings.
  • Allow liquidity conditions to ease further, which historically has supported higher valuations in risk assets such as cryptocurrencies.

However, this transmission is neither direct nor immediate. It depends on how quickly markets perceive structural changes in energy markets and central bank policy trajectories.

What Might Limit the Crypto Recovery

While a ceasefire can reduce geopolitical risk, it cannot fully offset macro headwinds that influenced crypto markets over the past months:

  • Persisting central bank uncertainty: If the Bank of Japan proceeds with tightening and the US data continues to suggest sticky inflation, liquidity could remain constrained, muting upside in risk assets.
  • Derivative market positioning: Leverage has been a significant catalyst of past crypto declines. Relief rallies can trigger fresh positioning and high funding rates, only to be reversed if macro forces reassert.
  • Liquidity conditions: A ceasefire is good news, but sustained asset price rallies require ample liquidity. Without clearer signals of easing financial conditions, crypto assets may see only transient relief moves.
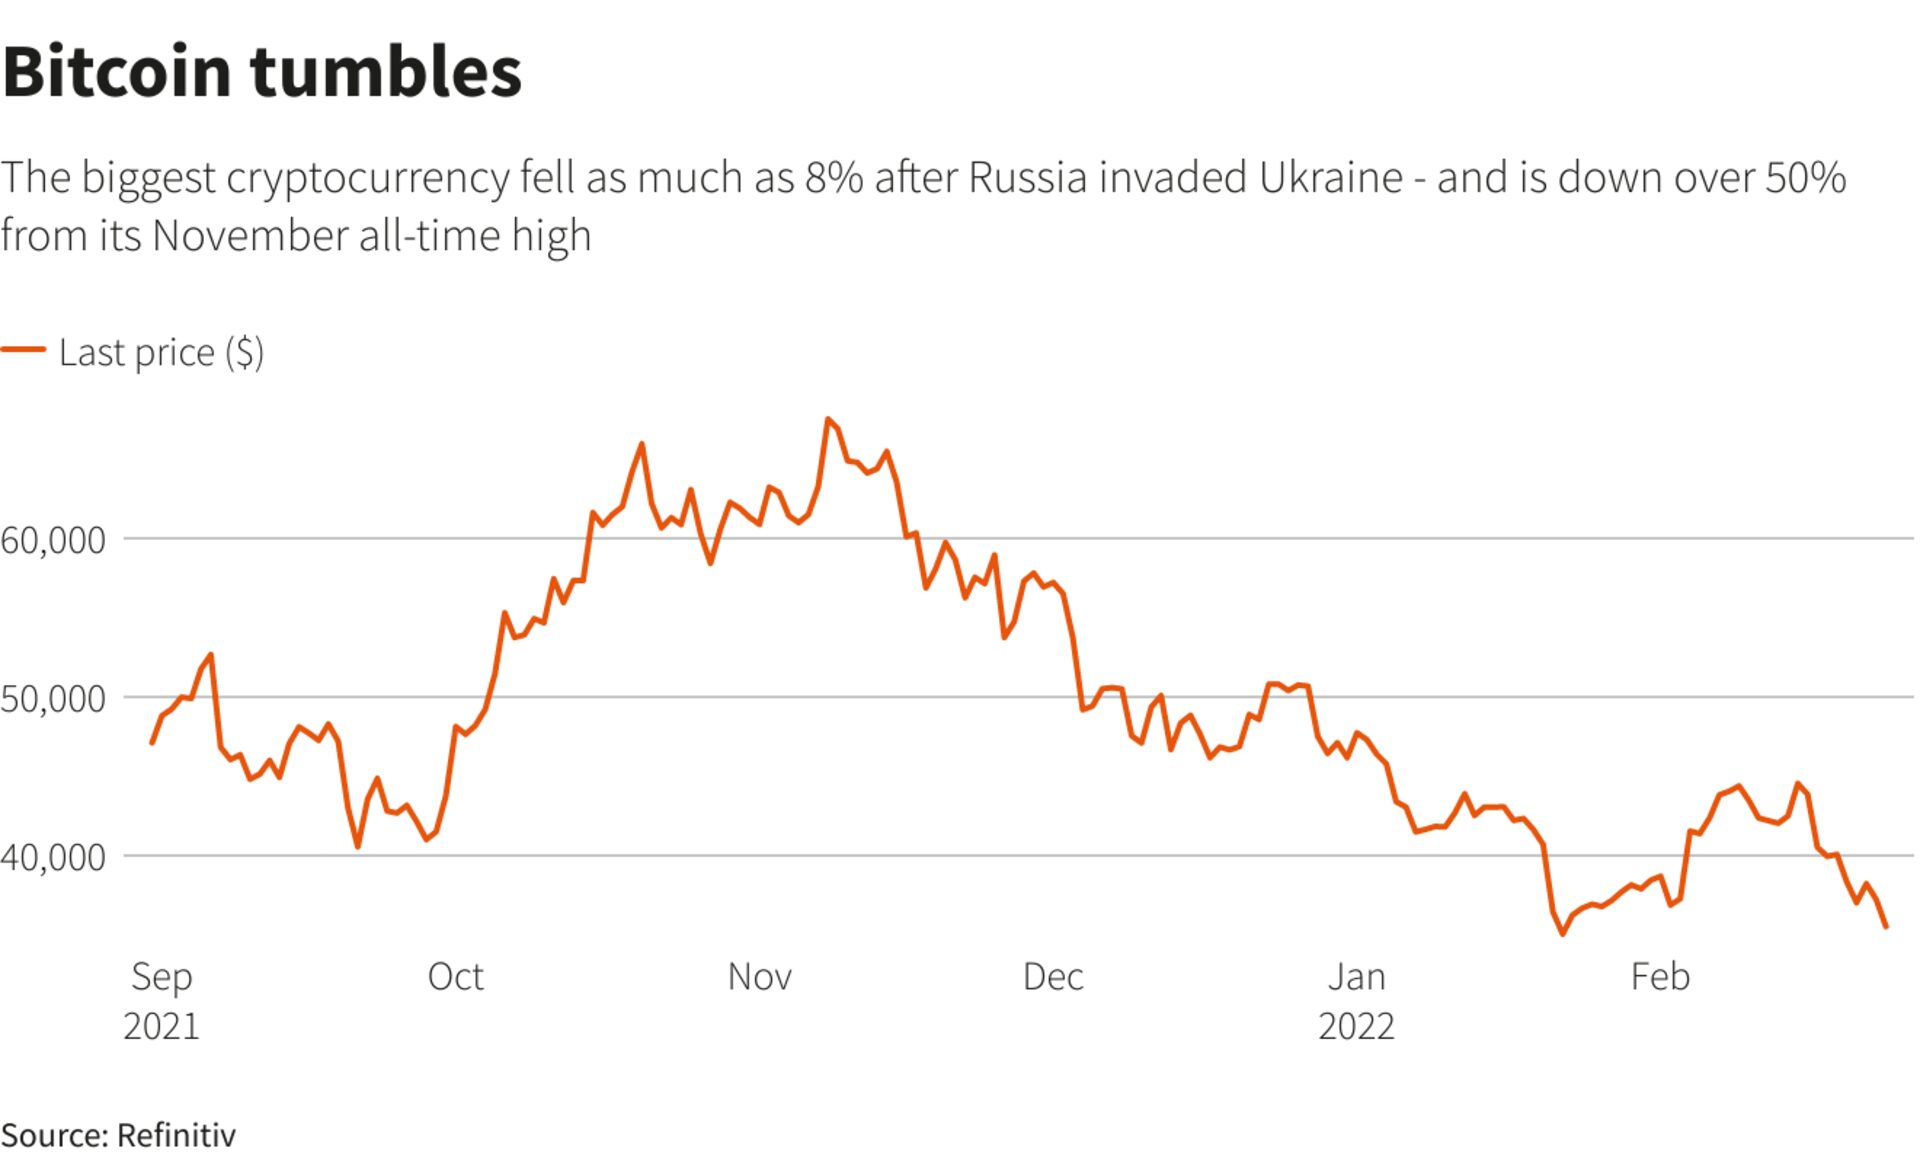
Bitcoin Dip When Russia Invaded Ukraine in 2022. Source: Reuters

A Ceasefire Would Be Positive, But Not Sufficient

An agreed ceasefire between Russia and Ukraine would mark a monumental shift in geopolitics and initially bolster risk assets, including cryptocurrencies. 

However, the broader impact on crypto markets will depend heavily on how the ceasefire intersects with liquidity conditions, central bank policy expectations, and global risk appetite.

In the short term, crypto could see a meaningful relief rally, driven by sentiment and risk reallocation. 

Over the medium term, the trend will likely hinge on whether ceasefire outcomes tangibly ease inflation and liquidity pressures — the primary macro drivers that have influenced digital assets in recent months.

Disclaimer: For information purposes only. Past performance is not indicative of future results.
placeholder
Gold Price Forecast: XAU/USD drifts higher above $4,200 as Fed delivers expected cutGold price (XAU/USD) gains momentum to around $4,235 during the early Asian session on Thursday. The precious metal extends its upside after the US Federal Reserve (Fed) delivered an expected third consecutive interest rate cut and maintained its outlook for just one cut in 2026.
Author  FXStreet
Dec 11, Thu
Gold price (XAU/USD) gains momentum to around $4,235 during the early Asian session on Thursday. The precious metal extends its upside after the US Federal Reserve (Fed) delivered an expected third consecutive interest rate cut and maintained its outlook for just one cut in 2026.
placeholder
Gold remains bid as lack of Fed clarity and geopolitical frictions persistGold (XAU/USD) advances modestly on Friday as traders seem to book profits ahead of the weekend, yet clings to gains of over 0.51% after reaching a seven-week high of $4,353. At the time of writing, XAU/USD trades at $4,302 as traders digest comments from Federal Reserve (Fed) officials.
Author  FXStreet
Yesterday 01: 34
Gold (XAU/USD) advances modestly on Friday as traders seem to book profits ahead of the weekend, yet clings to gains of over 0.51% after reaching a seven-week high of $4,353. At the time of writing, XAU/USD trades at $4,302 as traders digest comments from Federal Reserve (Fed) officials.
placeholder
Ethereum Price Slips Lower — $3,000 Looms as the Key BattlegroundEthereum is attempting to recover from a $3,026 low but remains below $3,200 and the 100-hour SMA, with a bearish trend line near $3,175 capping rebounds as bulls need a clean break above $3,200 to target $3,250–$3,400, while a drop below $3,050 risks a retest of $3,000 and $2,940.
Author  Mitrade
Yesterday 03: 25
Ethereum is attempting to recover from a $3,026 low but remains below $3,200 and the 100-hour SMA, with a bearish trend line near $3,175 capping rebounds as bulls need a clean break above $3,200 to target $3,250–$3,400, while a drop below $3,050 risks a retest of $3,000 and $2,940.
placeholder
Macro Analysts: Hawkish Japan Could Push Bitcoin Below $70KAnalysts predict Bitcoin may face further declines towards the $70,000 mark if the Bank of Japan raises interest rates as expected.
Author  Mitrade
Yesterday 05: 48
Analysts predict Bitcoin may face further declines towards the $70,000 mark if the Bank of Japan raises interest rates as expected.
placeholder
Bitcoin Slides 5% as Sellers Lean In — Can BTC Reclaim $88,000?Bitcoin has dropped back below $88,000 after rolling over from $90,500, with price still trading under the 100-hour Simple Moving Average. The sell-off found a floor at $85,151, and BTC is now consolidating near that base, but rebounds are facing pressure from a bearish trend line around $89,000. Bulls need to retake $88,000–$89,000 to ease downside risk; failure to do so keeps $85,500–$85,000 and then $83,500 in play, with $80,000 as the deeper “line in the sand.” Bitcoin (BTC) is back in damage-control mode after a sharp pullback wiped out recent gains. The price failed to reclaim the $90,000–$90,500 band, rolled over, and slid through $88,500 before briefly dipping under $87,000. Buyers did show up around $85,000, but the rebound so far looks more like stabilization than a clear trend reversal. Bitcoin dips hard, finds a bid near $85,000(h3) BTC’s latest move lower began when it couldn’t build follow-through above $90,000 and $90,500. Once that upside stalled, sellers took control and pushed price down through $88,500. The slide accelerated enough to spike below $87,000, but the market didn’t free-fall. Bulls defended the $85,000 zone, printing a low at $85,151. Since then, Bitcoin has been consolidating below the 23.6% Fibonacci retracement of the drop from the $93,560 swing high to the $85,151 low — a clue that the bounce is still shallow and that sellers haven’t fully backed off yet. Structurally, BTC is still on the back foot: It’s trading below $88,000, and It remains below the 100-hour Simple Moving Average, keeping short-term trend pressure pointed downward. Resistance is layered, and $89,000 is the problem area(h3) If bulls try to turn this into a recovery, they’ll have to climb through multiple ceilings in quick succession. First, BTC faces resistance around $87,150, followed by a more meaningful barrier near $87,500. From there, the market’s attention snaps back to $88,000 — the level BTC just lost and now needs to reclaim. A close back above $88,000 would improve the tone, but it doesn’t solve the bigger issue: there’s a bearish trend line on the hourly BTC/USD chart (Kraken feed) with resistance near $89,000, which also lines up with the next technical hurdle. If BTC can push through $89,000 and hold, the rebound could extend toward $90,000, with follow-through targets at $91,000 and $91,500. But until price clears that $88,000–$89,000 zone, rallies are at risk of being sold rather than chased. If BTC fails to reclaim resistance, the downside path is clear(h3) The near-term bear case is simple: if Bitcoin can’t climb back above the $87,000 area and keep traction, sellers may attempt another leg lower. Support levels line up like this: Immediate support: $85,500 First major support: $85,000 Next support: $83,500 Then $82,500 in the near term Below that, the major “don’t break this” level is still $80,000. If BTC slips under $80,000, the risk of acceleration to the downside increases significantly — not because it’s magic, but because it’s the kind of psychological and structural level that tends to trigger forced de-risking. Indicators: momentum still leans bearish(h3) The intraday indicators aren’t offering much comfort yet: Hourly MACD is losing pace in the bearish zone. Hourly RSI remains below 50, suggesting sellers still have the upper hand on short timeframes. So while the $85,000 defense held for now, the market hasn’t flipped bullish — it’s just stopped bleeding.
Author  Mitrade
3 hours ago
Bitcoin has dropped back below $88,000 after rolling over from $90,500, with price still trading under the 100-hour Simple Moving Average. The sell-off found a floor at $85,151, and BTC is now consolidating near that base, but rebounds are facing pressure from a bearish trend line around $89,000. Bulls need to retake $88,000–$89,000 to ease downside risk; failure to do so keeps $85,500–$85,000 and then $83,500 in play, with $80,000 as the deeper “line in the sand.” Bitcoin (BTC) is back in damage-control mode after a sharp pullback wiped out recent gains. The price failed to reclaim the $90,000–$90,500 band, rolled over, and slid through $88,500 before briefly dipping under $87,000. Buyers did show up around $85,000, but the rebound so far looks more like stabilization than a clear trend reversal. Bitcoin dips hard, finds a bid near $85,000(h3) BTC’s latest move lower began when it couldn’t build follow-through above $90,000 and $90,500. Once that upside stalled, sellers took control and pushed price down through $88,500. The slide accelerated enough to spike below $87,000, but the market didn’t free-fall. Bulls defended the $85,000 zone, printing a low at $85,151. Since then, Bitcoin has been consolidating below the 23.6% Fibonacci retracement of the drop from the $93,560 swing high to the $85,151 low — a clue that the bounce is still shallow and that sellers haven’t fully backed off yet. Structurally, BTC is still on the back foot: It’s trading below $88,000, and It remains below the 100-hour Simple Moving Average, keeping short-term trend pressure pointed downward. Resistance is layered, and $89,000 is the problem area(h3) If bulls try to turn this into a recovery, they’ll have to climb through multiple ceilings in quick succession. First, BTC faces resistance around $87,150, followed by a more meaningful barrier near $87,500. From there, the market’s attention snaps back to $88,000 — the level BTC just lost and now needs to reclaim. A close back above $88,000 would improve the tone, but it doesn’t solve the bigger issue: there’s a bearish trend line on the hourly BTC/USD chart (Kraken feed) with resistance near $89,000, which also lines up with the next technical hurdle. If BTC can push through $89,000 and hold, the rebound could extend toward $90,000, with follow-through targets at $91,000 and $91,500. But until price clears that $88,000–$89,000 zone, rallies are at risk of being sold rather than chased. If BTC fails to reclaim resistance, the downside path is clear(h3) The near-term bear case is simple: if Bitcoin can’t climb back above the $87,000 area and keep traction, sellers may attempt another leg lower. Support levels line up like this: Immediate support: $85,500 First major support: $85,000 Next support: $83,500 Then $82,500 in the near term Below that, the major “don’t break this” level is still $80,000. If BTC slips under $80,000, the risk of acceleration to the downside increases significantly — not because it’s magic, but because it’s the kind of psychological and structural level that tends to trigger forced de-risking. Indicators: momentum still leans bearish(h3) The intraday indicators aren’t offering much comfort yet: Hourly MACD is losing pace in the bearish zone. Hourly RSI remains below 50, suggesting sellers still have the upper hand on short timeframes. So while the $85,000 defense held for now, the market hasn’t flipped bullish — it’s just stopped bleeding.
goTop
quote