

Top Crypto Gainers: Zcash rallies as MYX Finance, Dash test critical EMA levels
- Zcash edges higher by nearly 10% in the last 24 hours, with bulls aiming for the $400 mark.
- MYX Finance extends recovery above $3 and the 50-day EMA, approaching the 100-day EMA resistance.
- Dash trades above $50 but struggles to clear the 100-day EMA.
Zcash (ZEC), MYX Finance (MYX), and Dash (DASH) are the top-performing assets in the top 100 cryptocurrency list over the last 24 hours. The privacy coin leads the rally while MYX and DASH struggle to clear their 100-day Exponential Moving Averages (EMA).
Zcash approaches $400 with bulls aiming for a breakout rally
Zcash edges higher by 5% at press time on Friday, extending its 8% rise from the previous day. The privacy coin performs a V-shaped reversal on the daily logarithmic chart from the $300 psychological support, marked by three consecutive bullish candles.
The recovery run approaches the 50-day EMA at $420, which serves as the immediate resistance. A successful close above this level could extend the rally toward the $550 supply zone.
The Relative Strength Index (RSI) at 42 on the daily chart indicates an upward tilt toward the midpoint, suggesting a decrease in selling pressure. At the same time, the Moving Average Convergence Divergence (MACD) shifts toward the signal line, a sign of reduced bearish momentum and a potential crossover which would indicate renewed bullish drive.
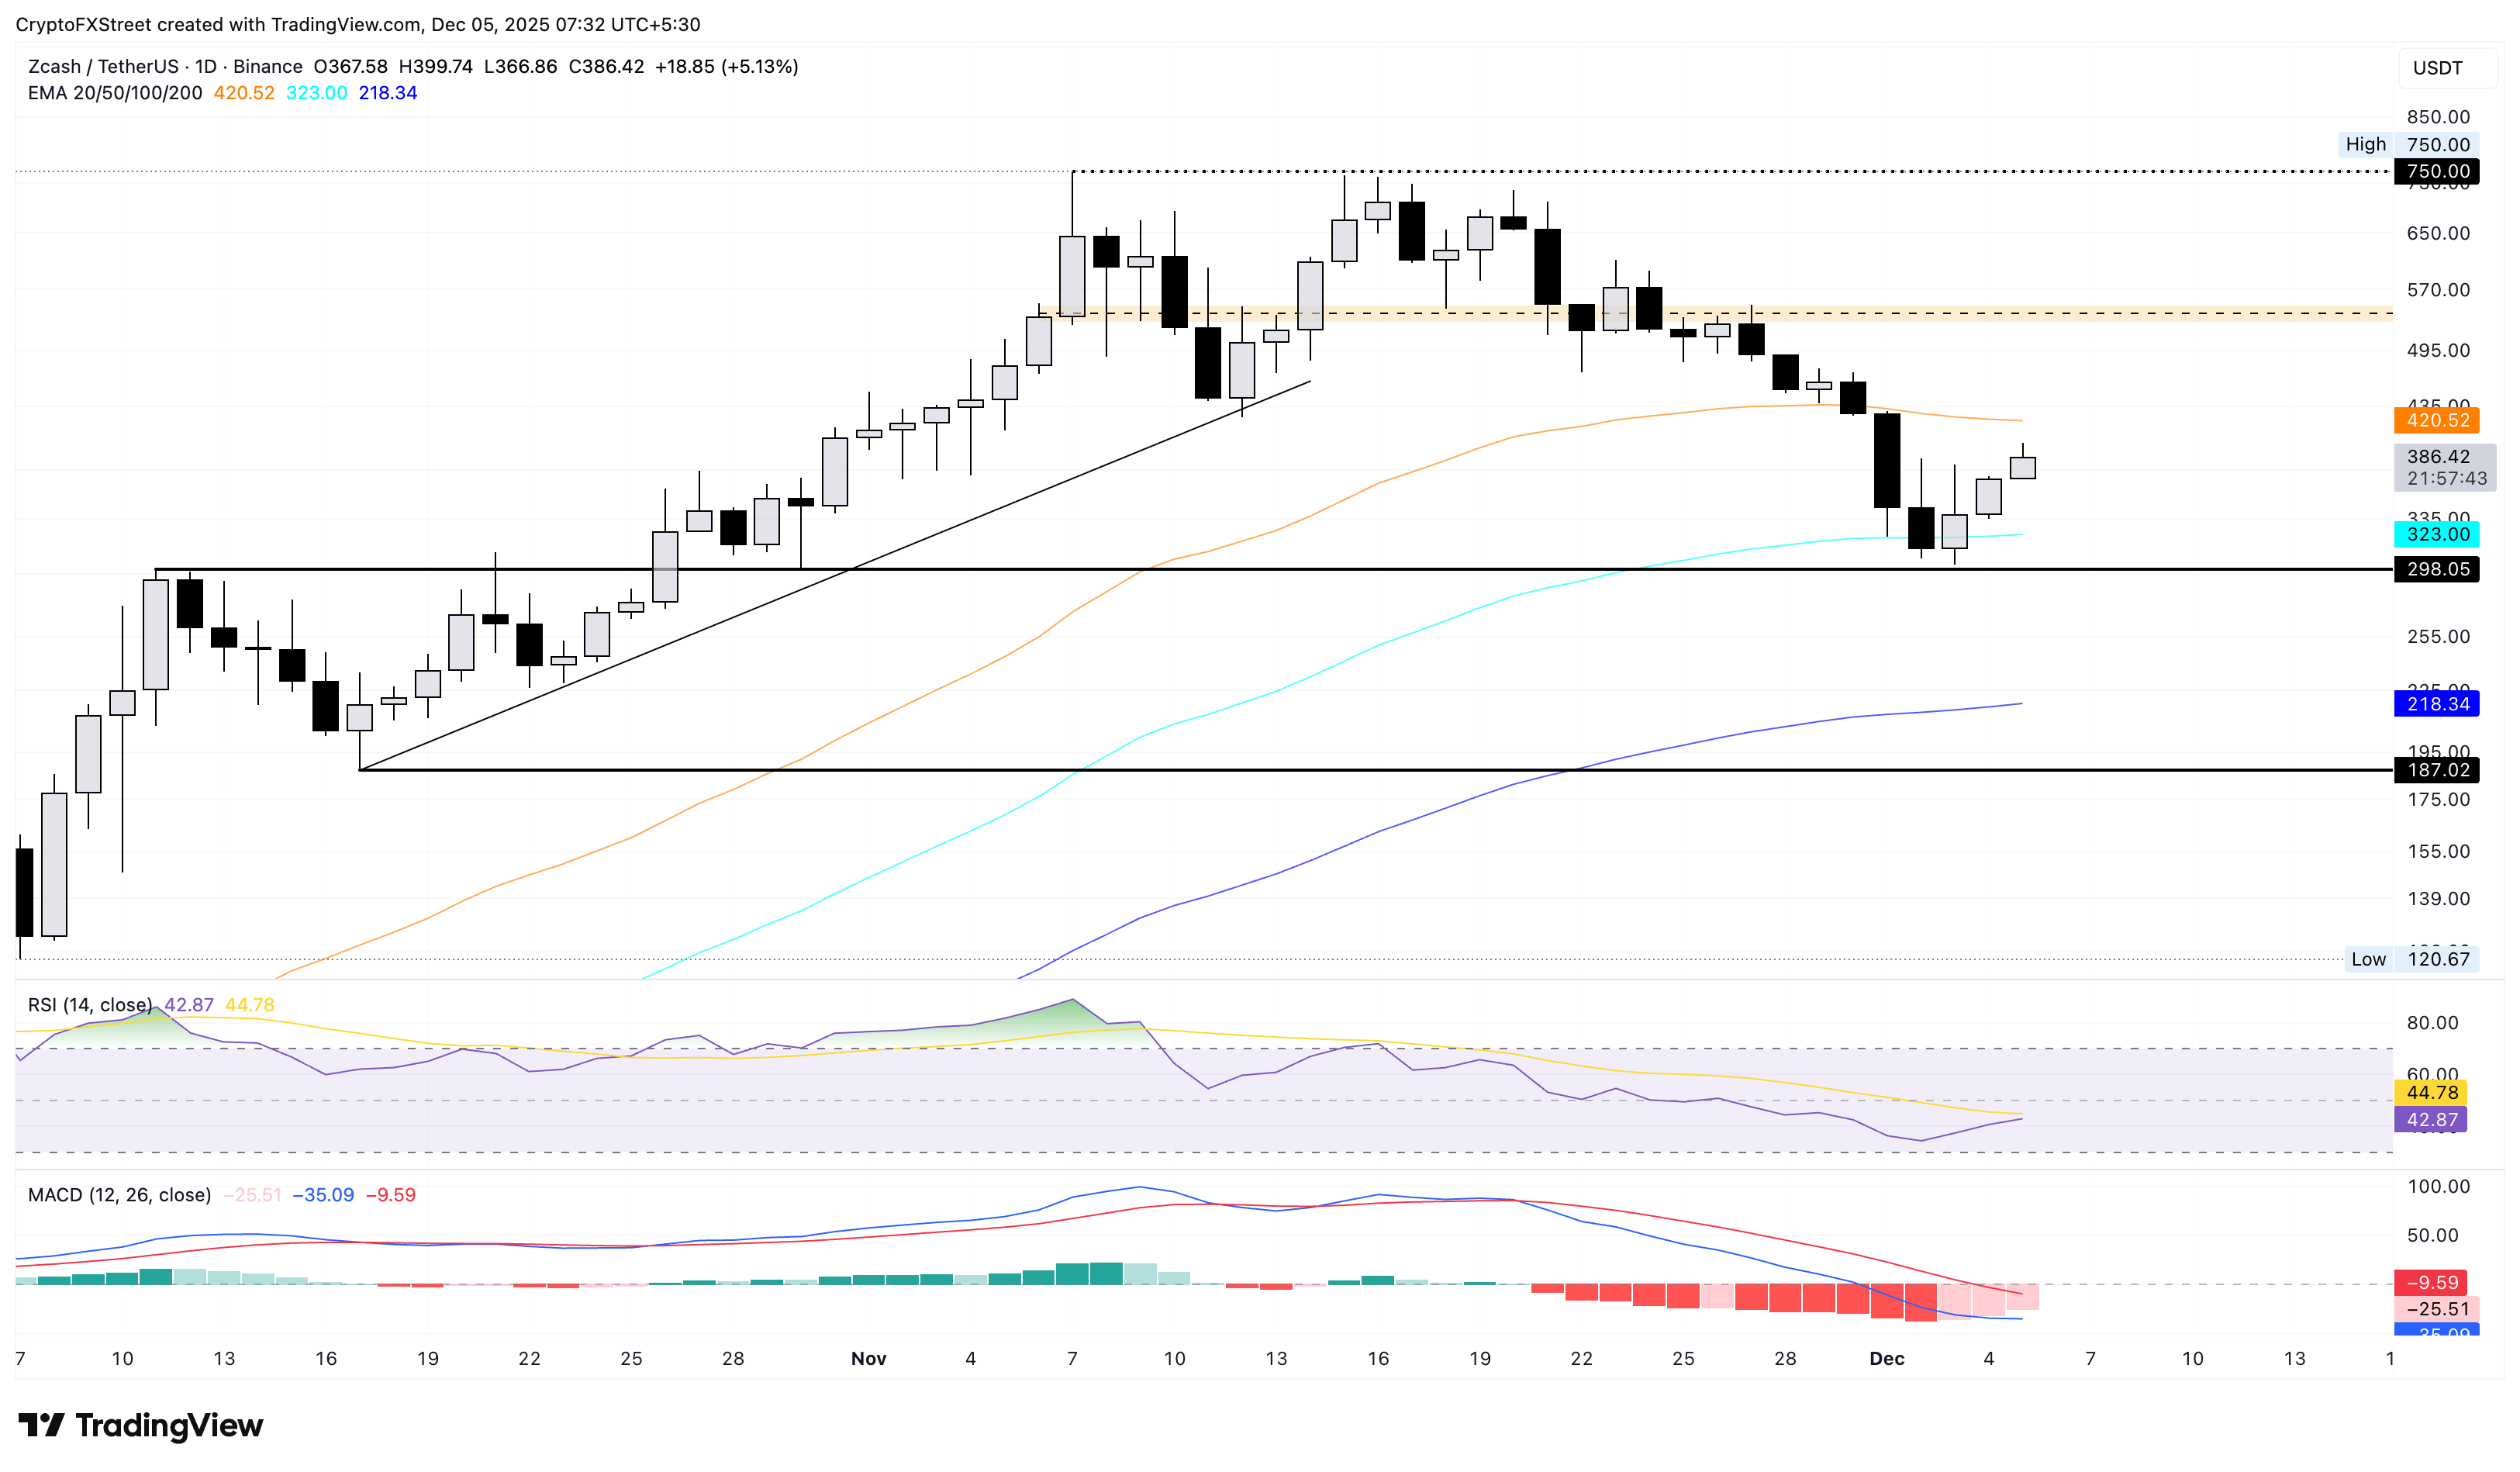
On the downside, if Zcash flips from $400, the 100-day EMA at $323 could provide support.
MYX Finance struggles at a resistance
MYX Finance token is up 4% by press time on Friday, extending the uptrend for the eighth day. The MYX recovery inches closer to the 100-day EMA at $3.58, which serves as immediate resistance. If the token clears this dynamic resistance, it could aim for $4.46, aligning with the October 5 low.
The momentum indicators show a steady increase in buying pressure as the RSI at 61 extends towards the overbought zone, while the MACD and signal line extend the uptrend above the zero line.
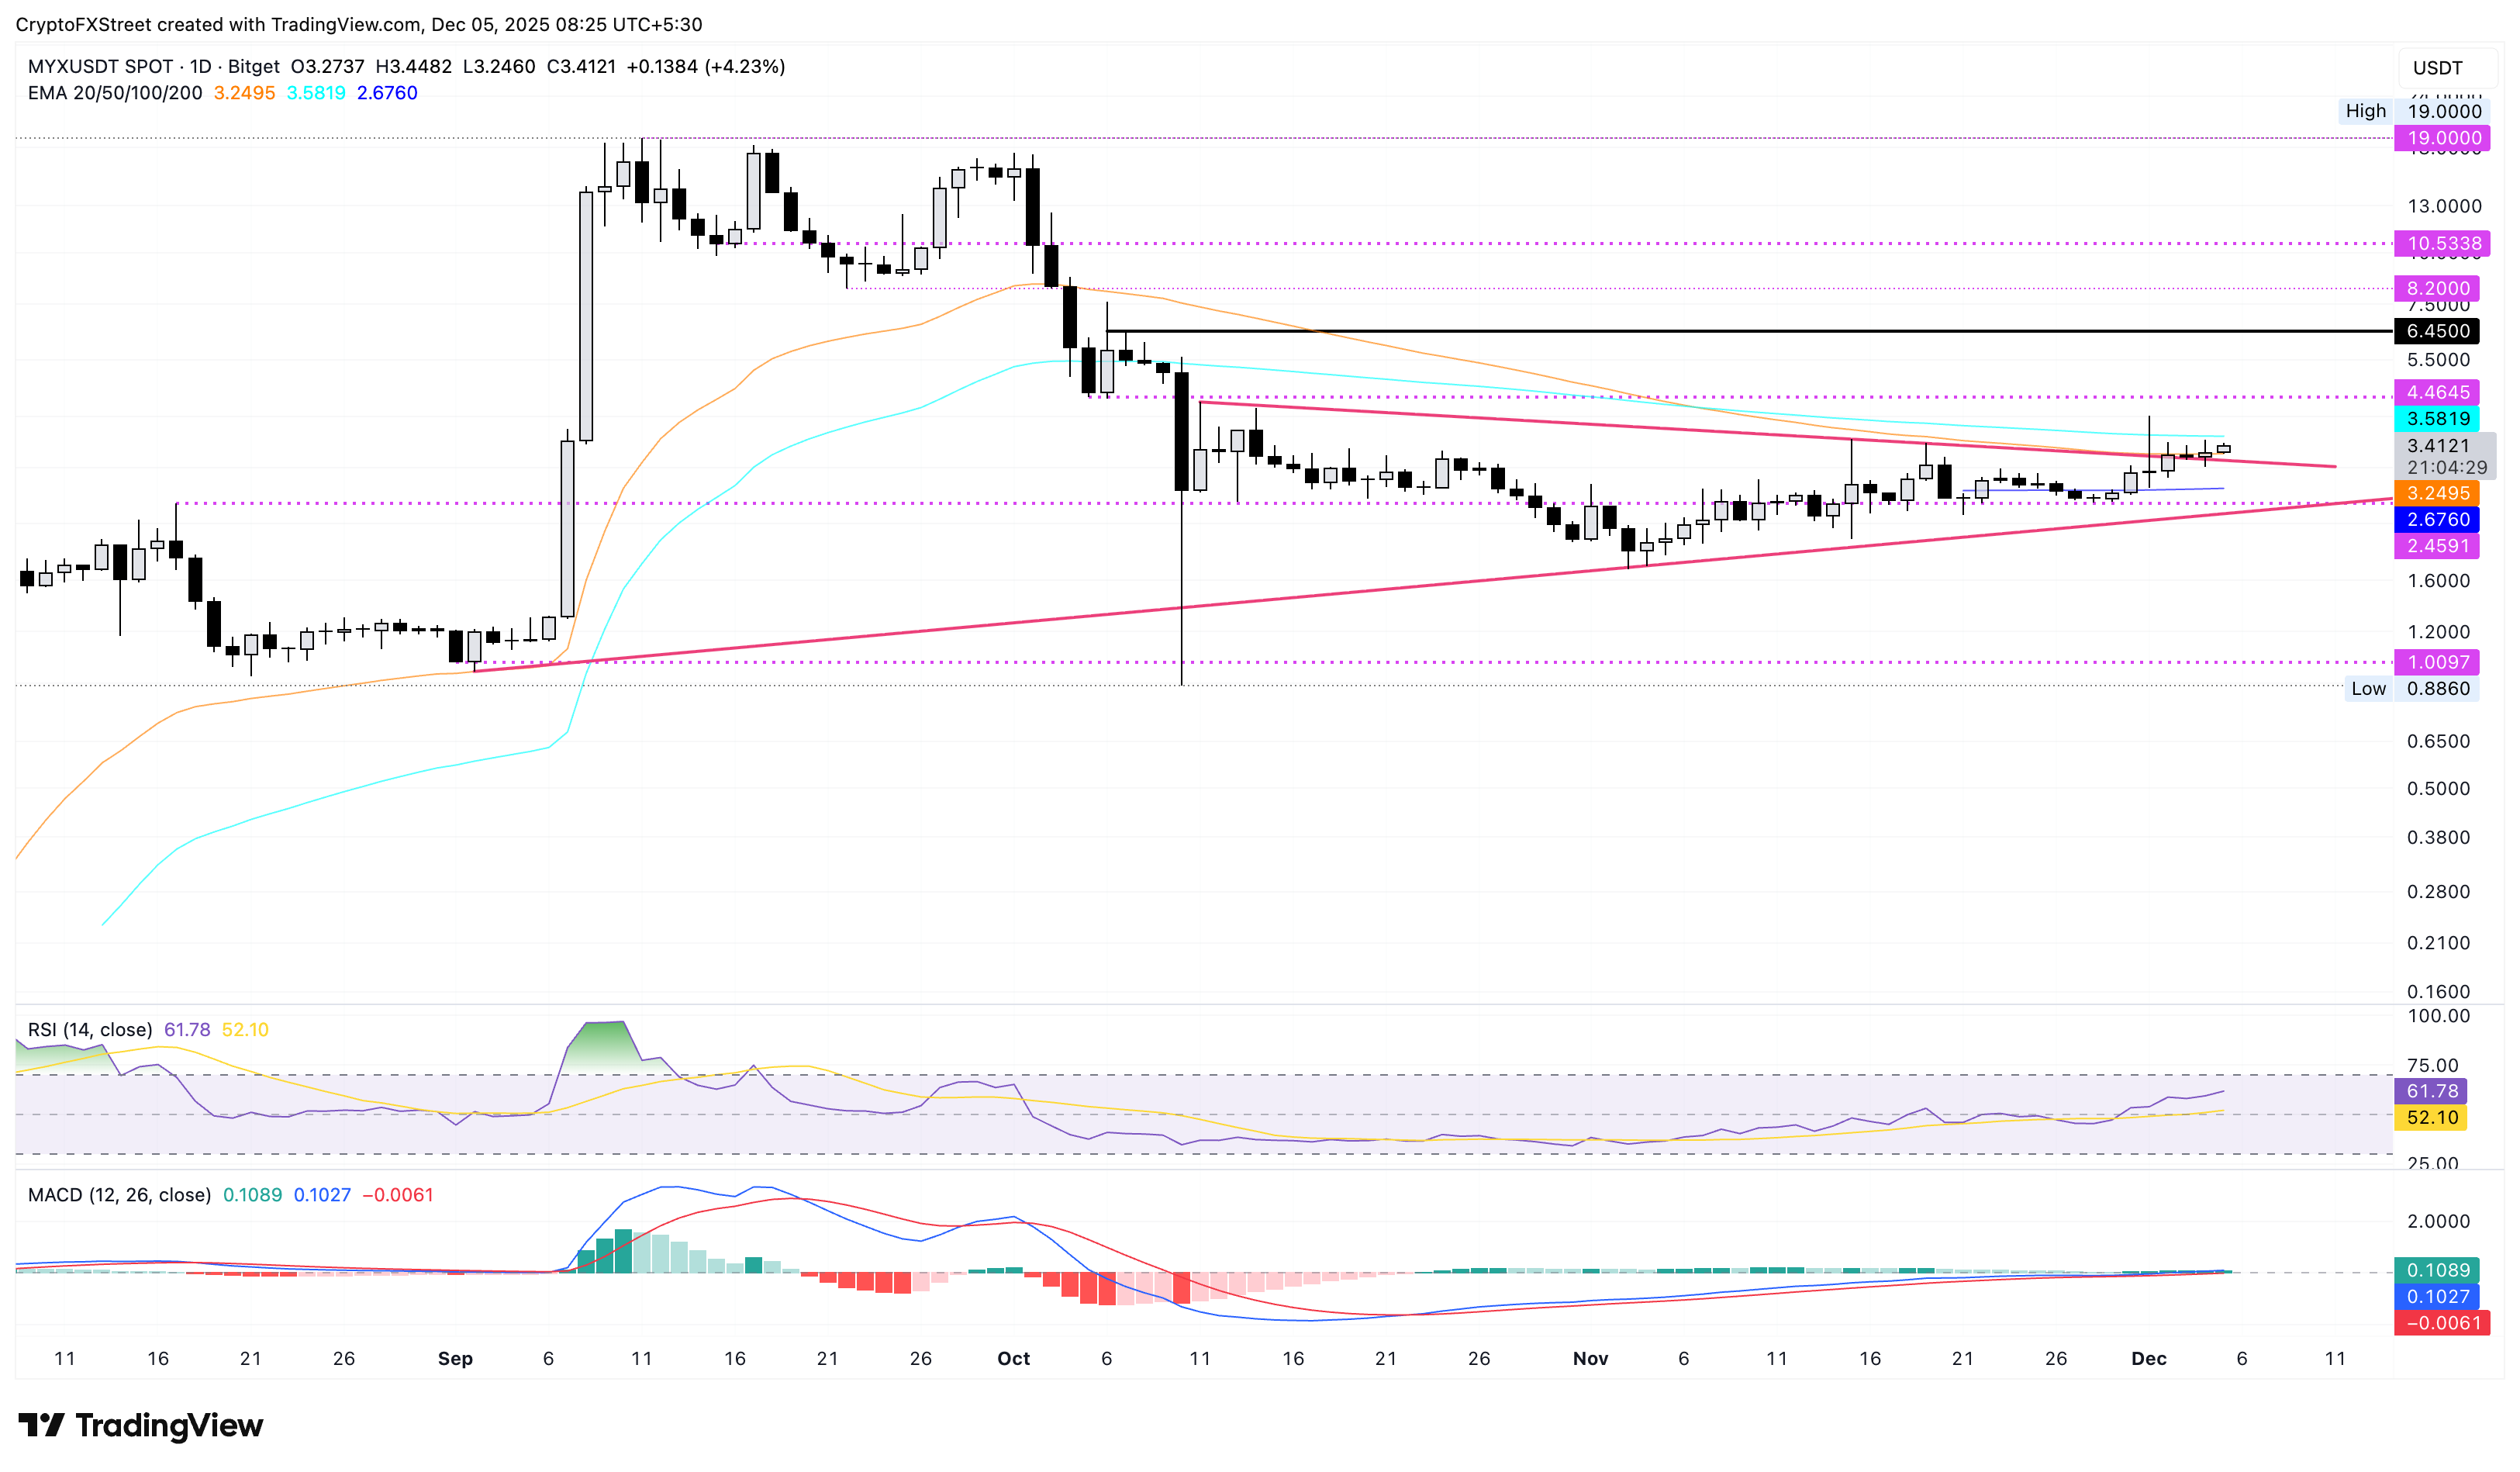
Looking down, the key support levels for MYX are the 50-day EMA at $3.24, followed by the 200-day EMA at $2.67.
Dash aims for the 100-day EMA breakout
Dash extends its recovery for the third consecutive day, aiming to clear the 100-day EMA at $50.98. At the time of writing, DASH trades near $52.00, up 5% on Friday.
If the privacy coin secures a daily close above $50.98, it would confirm the 100-day EMA breakout and aim for the 50-day EMA at $59.50.
Similar to Zcash, the momentum indicators on the daily timeframe signal a positive shift in the DASH price trend. The RSI at 42 is shifting upward towards the midline, while the MACD and signal line prepare for a bullish crossover.
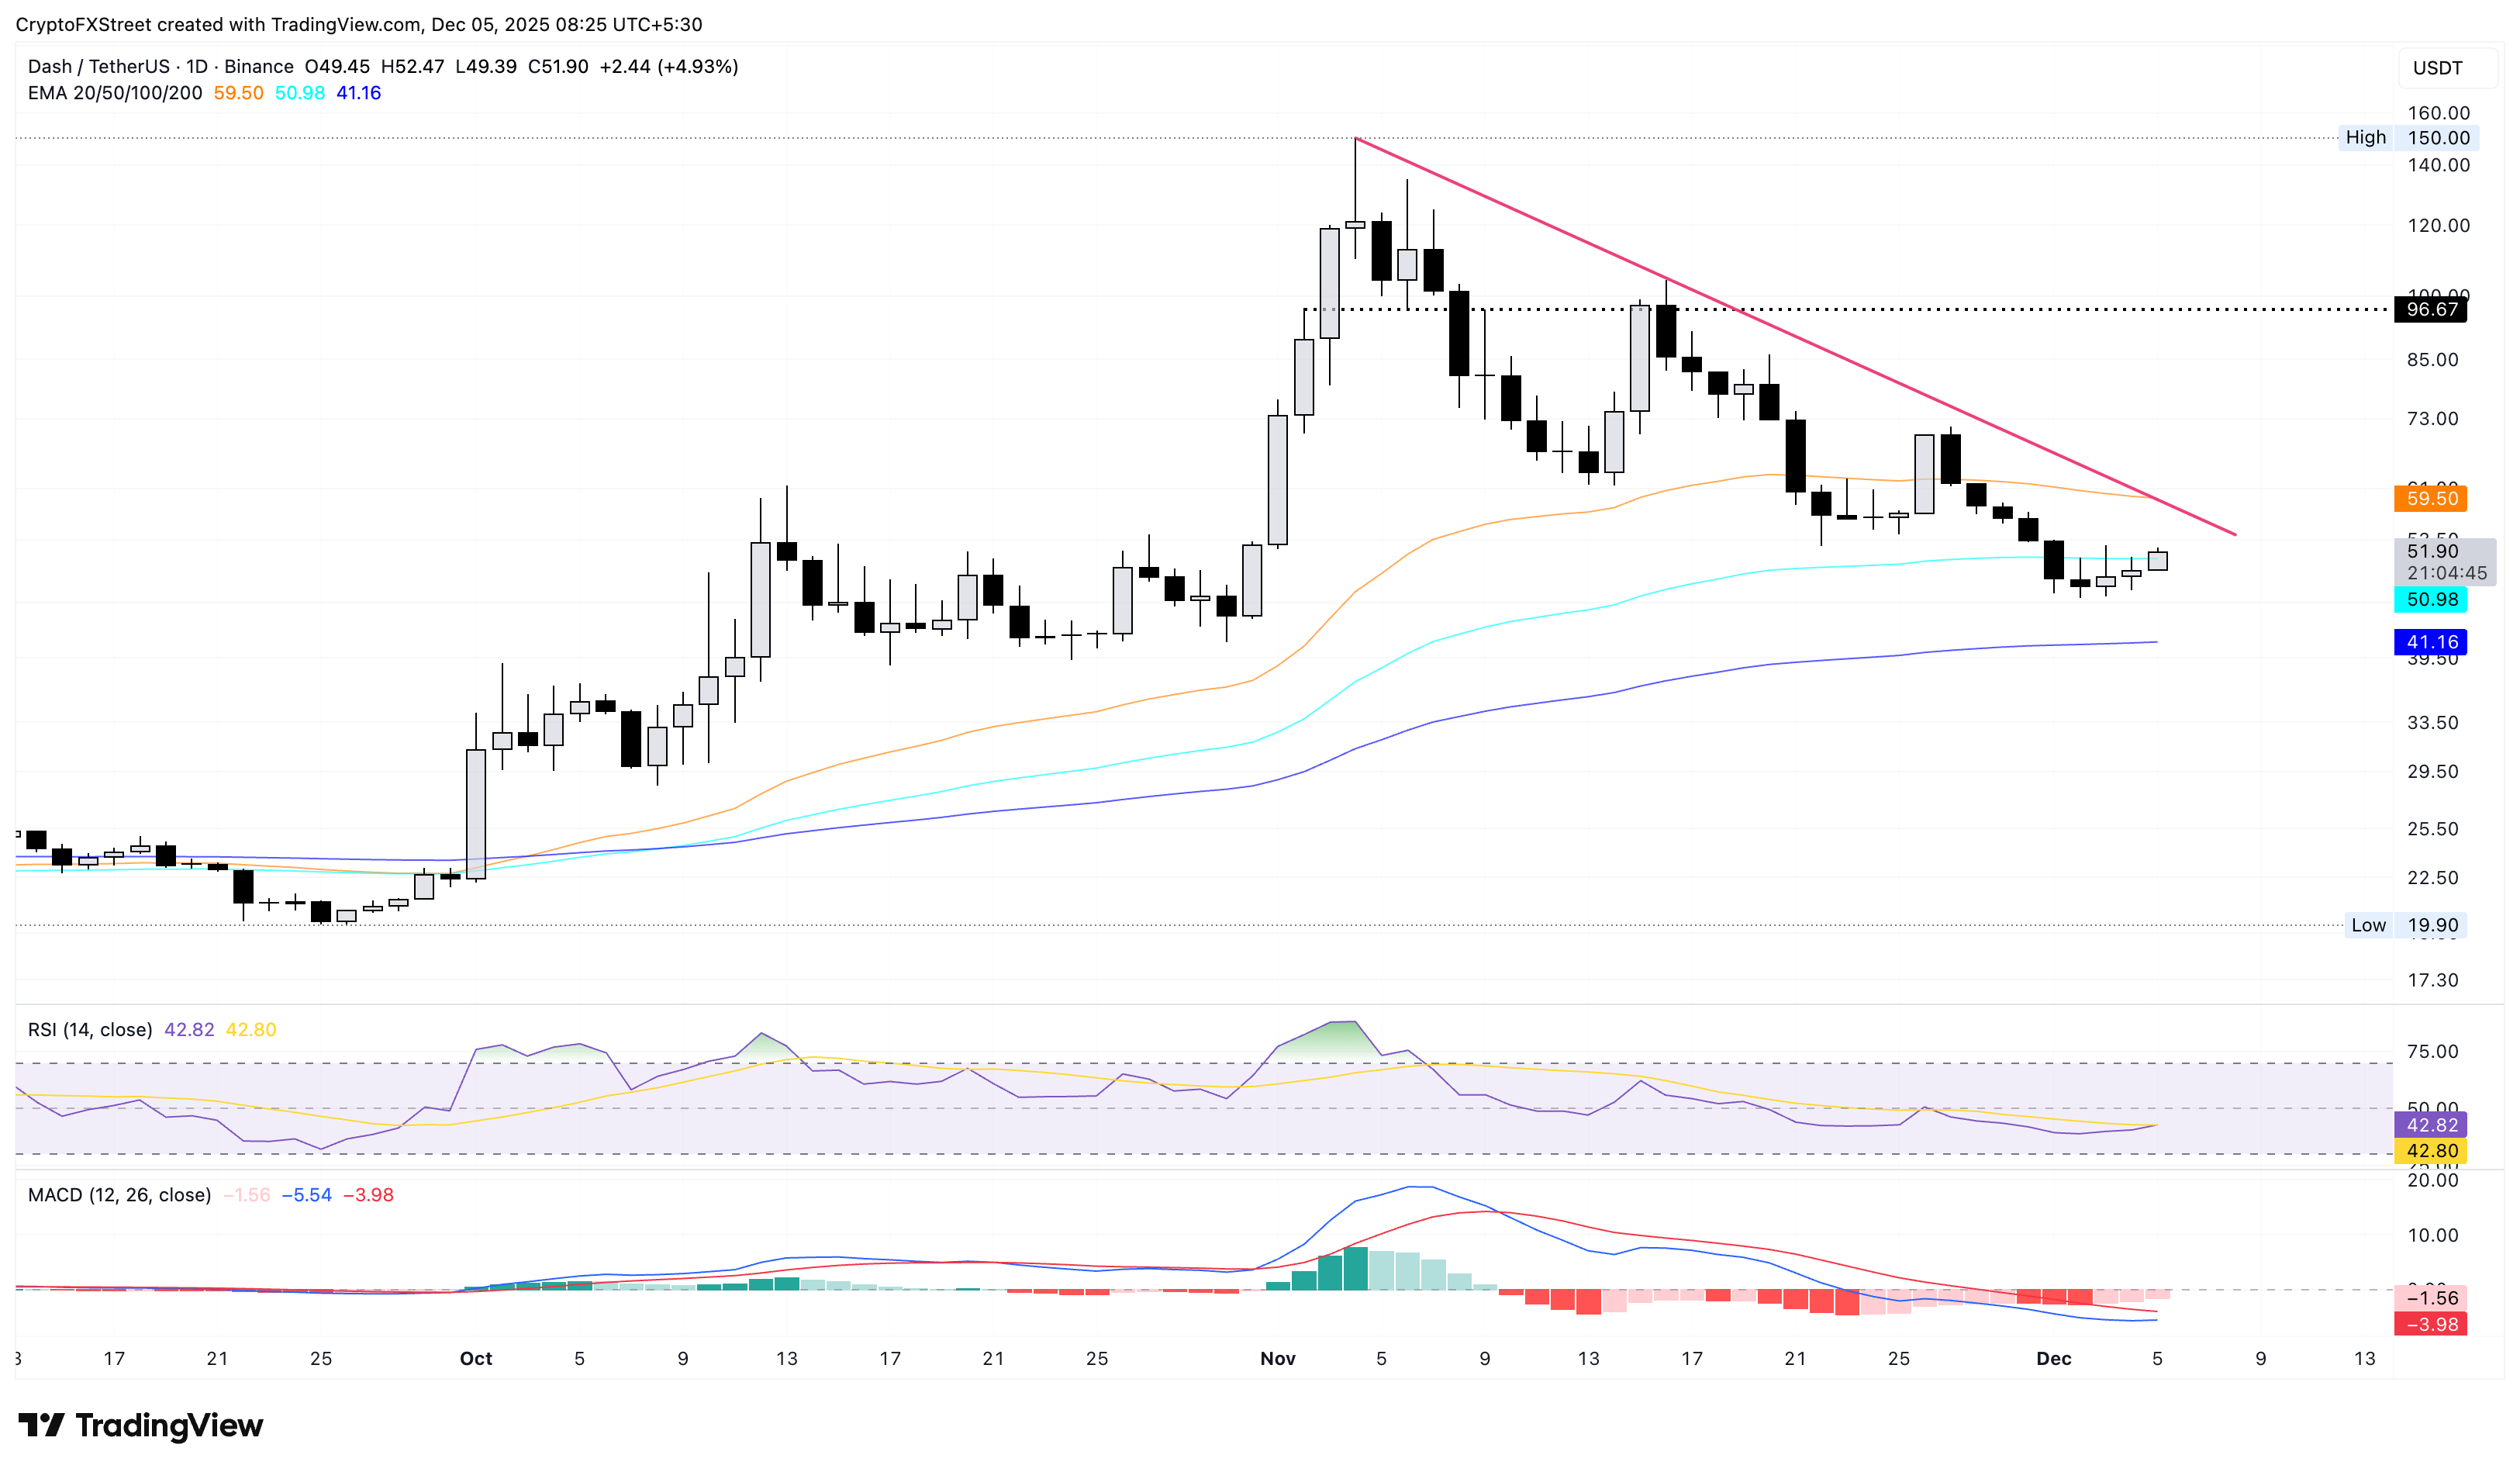
However, if DASH reverses from $50.00, it could extend the decline to the 200-day EMA at $41.16.
Recommended Articles


