

Dogecoin on-chain metrics signal DOGE could suffer price drop
- Dogecoin transaction volume has increased by nearly 80% between April 6 and 15, while DOGE price declined.
- Retail holders and small-wallet investors accumulated DOGE in the recent price dip, but whales sold their meme coin holdings.
- DOGE on-chain metrics signal the likelihood of further correction after 3.3% losses on the daily time frame.
Dogecoin (DOGE), one of the largest meme coins in the crypto ecosystem, has noted an increase in on-chain activity alongside a price correction since the beginning of April. DOGE price, which is down 3.3% on the day, is at risk of a further drop as whales shed their token holdings.
Three on-chain metrics bode no good for DOGE
- Transaction volume climbed 80% between April 6 and April 15
DOGE transaction volume was up from $2.99 billion on April 6 to $5.36 billion on April 15. Typically, an increase in transaction volume shows that the token is relevant and there is higher user activity. However, this increase in volume has come hand in hand with a more than 13% price decline.
%20[13.37.28,%2016%20Apr,%202024]-638488593580468630.png)
Transaction volume and price
- Retail investors are accumulating while whales distribute
An analysis of Santiment data for wallets holding between 1,000 to 10,000,000 DOGE tokens shows that small-wallet holders are accumulating through the recent “dip” in Dogecoin price. Wallets holding between 1,000 to 10,000; 10,000 to 100,000 and 100,000 to 1,000,000 DOGE tokens have rapidly accumulated the meme coin, while the cohort of DOGE holders with 1 million to 10 million DOGE tokens in their wallets has shed the meme coin.
Typically, whale holdings decrease near a price correction. As seen in the chart below, this cohort (holders of 1 million to 10 million DOGE) has shed their holdings ahead of price decline in DOGE, as seen on March 4 as well. If history is meant to repeat, market participants can expect a correction in DOGE price.
%20[13.54.27,%2016%20Apr,%202024]-638488593863463453.png)
DOGE supply distribution
- Nearly 81% of wallets are profitable
Data from IntoTheBlock’s Global In/Out of the Money map, a tool that calculates the average cost basis of the tokens currently held by the addresses, shows that nearly 81% of wallets holding DOGE are currently profitable. Wallets holding 123.18 billion DOGE tokens worth $19.24 billion are sitting on unrealized gains. These traders are likely to take profits, increasing the likelihood of higher selling pressure on DOGE in the coming days or weeks.
While this metric is typically used to identify support and resistance levels, it also signals whether there is a high or low likelihood of profit-taking by traders.
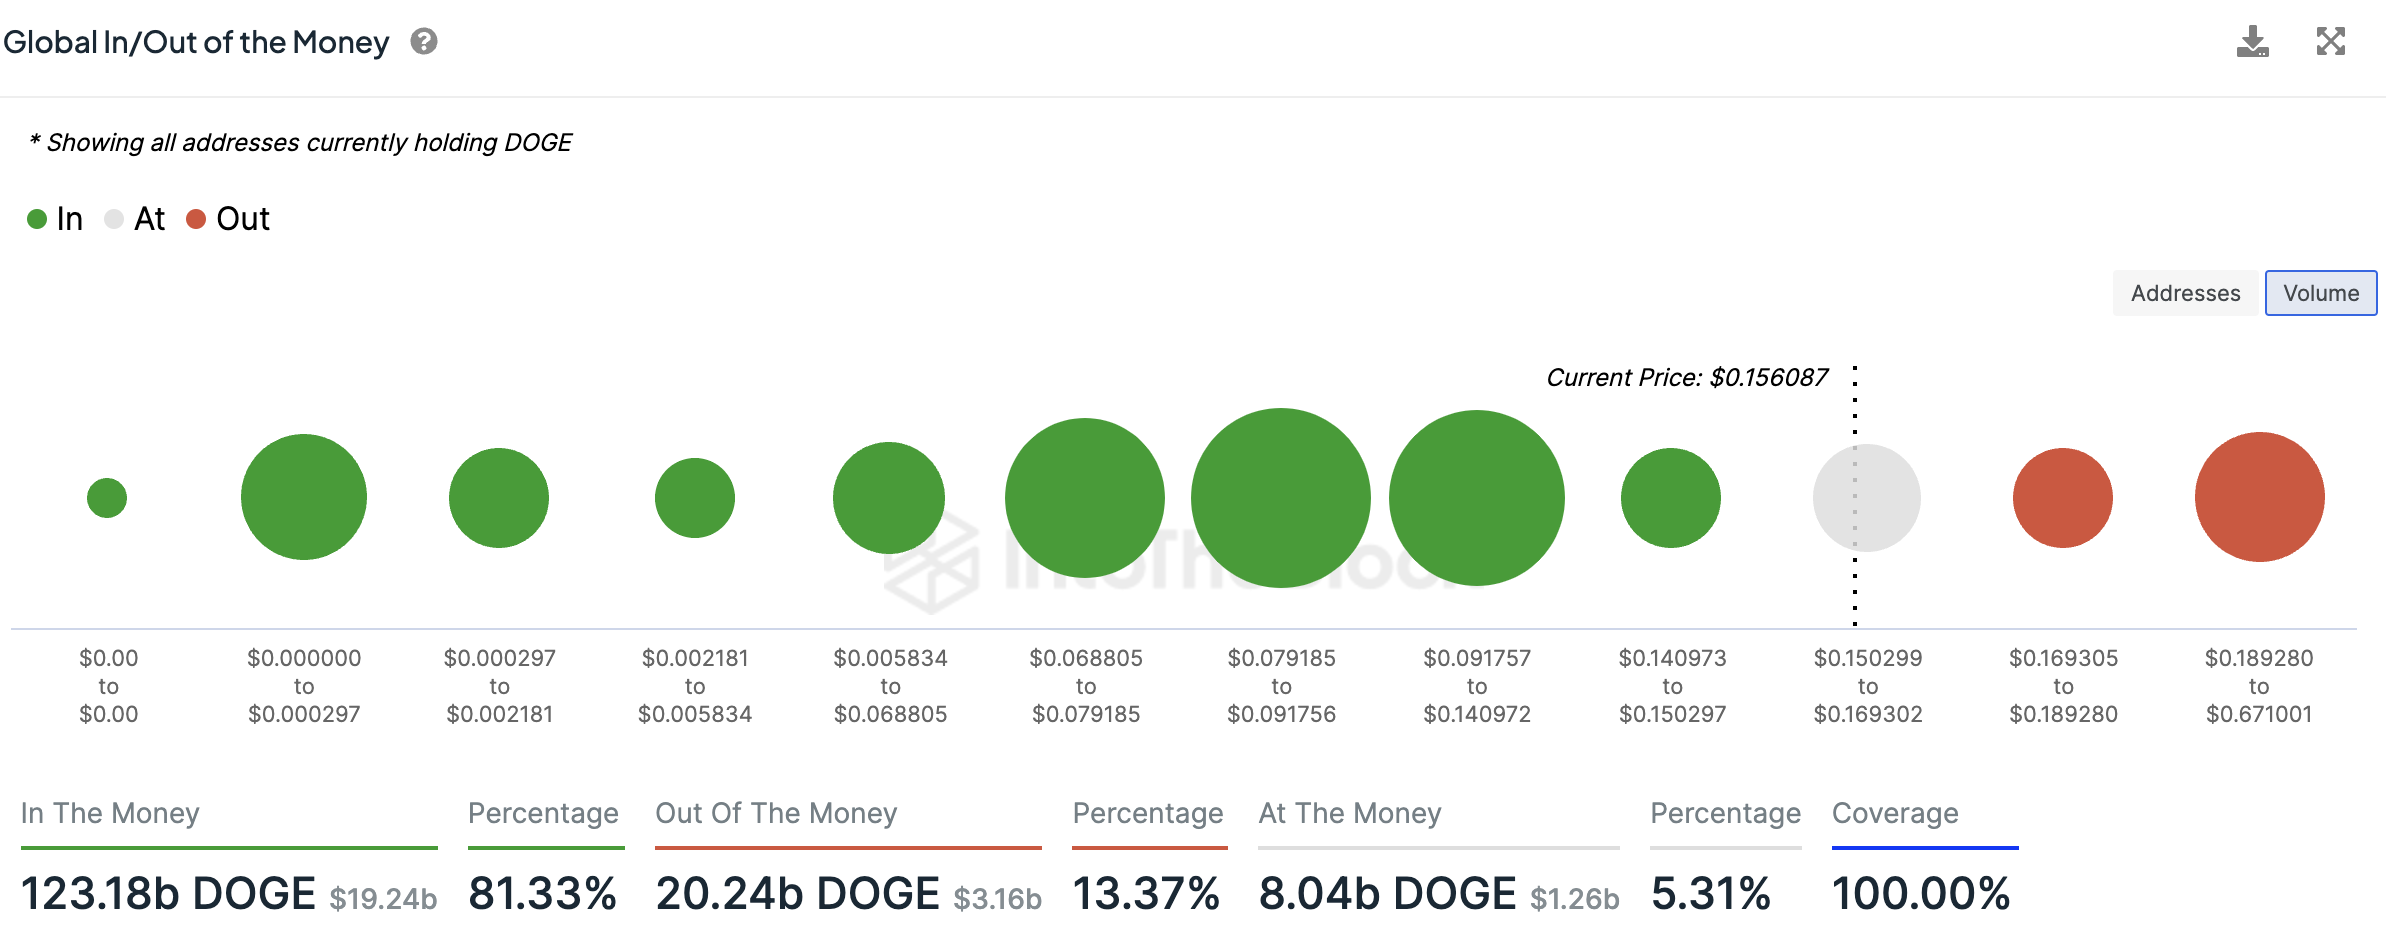
Global In/Out of the Money
DOGE price trades at $0.1564 at the time of writing, down nearly 3.3% on the day. The meme coin is in a downward trend, ahead of Dogecoin Day on April 20, an informal holiday created by the asset’s traders in honor of the 420 meme in the community.
Recommended Articles


