

Injective Price Prediction: INJ becomes attractive to buy after a 20% fall

Source Fxstreet
  • Injective price dipped nearly 20%, succumbing to broader market crash on Friday.
  • INJ is likely not to be left behind, trapping shorters for breakdown contingent on Bitcoin price showing strength.
  • A break and close below $20.00 would invalidate the bullish thesis.

Injective (INJ) price succumbed to the Friday crash that was instigated by Bitcoin price dumping to whiplash hundreds of millions in long and short positions. For late bulls, however, this could be the ideal discounted entry as the BTC halving closes in.

Also Read: Injective price coils up for a breakout after deep 40% correction

Injective price coils up for a rally

Injective price dipped nearly 20% on Friday, clearing the January 3 low of $29.21. The move could be a swift liquidity grab, triggered by large sell orders that quickly absorb available liquidity in the market. Participants may rush to capitalize on perceived opportunities, resulting in rapid price movements and fluctuations in liquidity.

With the Relative Strength Index (RSI) below 30, INJ is already oversold and may be due for a pullback. The likely play incase of a correction would be a flip of the $29.27 blockade into support, followed by a retest of this resistance-support before an extended move to the 50% Fibonacci placeholder at $37.24.

A move beyond $37.24 would encourage more buy orders with the gains likely to see the Injective price extend a neck higher to tag the $45.21. In a highly bullish case, INJ price could clear the aforementioned level to reclaim the $53.00 peak. This would denote a climb of nearly 98% above current levels. The forecasted recovery is contingent on how soon Bitcoin price recovers, and the broader cryptocurrency market with it.
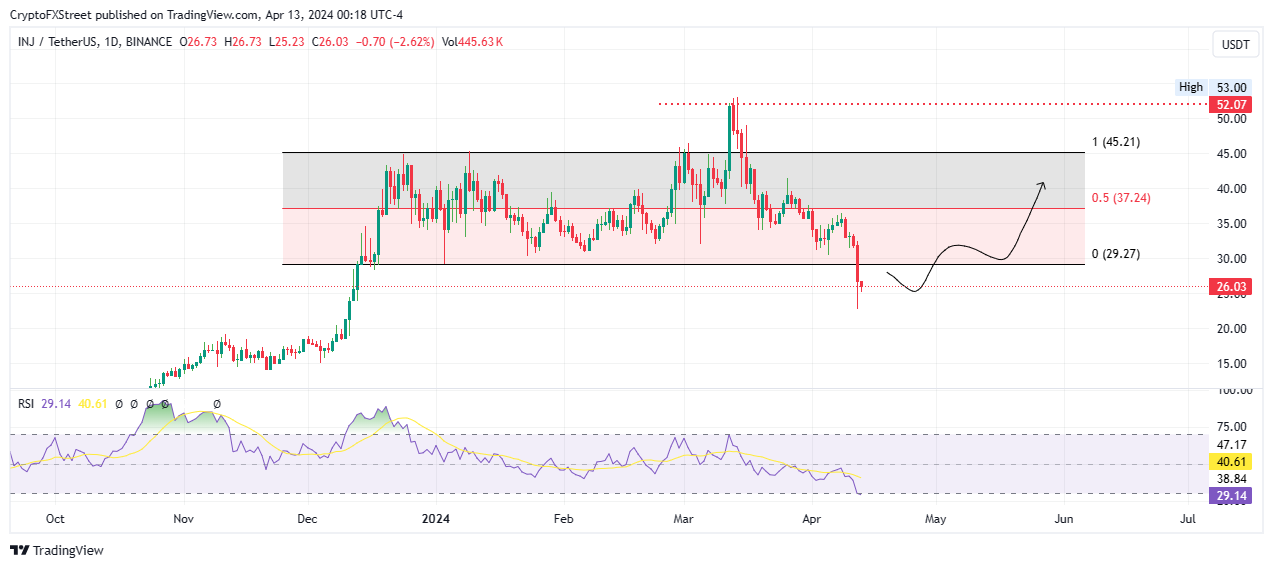
INJ/USDT 1-day chart

On the other hand, if the bears fasten their hands, the Injective price could extend the fall. A drop below the Friday bottom of $22.77 would produce a lower low, invalidating the bullish thesis. 

Disclaimer: For information purposes only. Past performance is not indicative of future results.
placeholder
US August CPI lands tonight: after a 5.4% PPI shock, will the Fed hike on September 16?US August PPI came in at 5.4% year-on-year, above the 5.3% consensus, with core PPI at 4.6%. Traders have pushed the odds of a 25bp Fed hike on September 15-16 to around 70%. Tonight's CPI is the last major inflation print before the decision — here is the full calendar, the consensus numbers, and what a hot versus cool reading would mean for the dollar, yields, gold and stocks.
Author  Irene Q.
Sep 11, Fri
US August PPI came in at 5.4% year-on-year, above the 5.3% consensus, with core PPI at 4.6%. Traders have pushed the odds of a 25bp Fed hike on September 15-16 to around 70%. Tonight's CPI is the last major inflation print before the decision — here is the full calendar, the consensus numbers, and what a hot versus cool reading would mean for the dollar, yields, gold and stocks.
placeholder
Brent tests $108 as a key export pipeline stays shut — can the rally clear $110?Brent crude rose 2.55% to $106.97 and WTI 2.32% to $102.30 as a major regional export pipeline remained offline with no restart timeline. Front-month backwardation has widened to $5.53 from $3.84 a week ago, European gas is at its highest since December 2022, and one analyst sees $119.48 if talks stall.
Author  Irene Q.
Sep 14, Mon
Brent crude rose 2.55% to $106.97 and WTI 2.32% to $102.30 as a major regional export pipeline remained offline with no restart timeline. Front-month backwardation has widened to $5.53 from $3.84 a week ago, European gas is at its highest since December 2022, and one analyst sees $119.48 if talks stall.
placeholder
Fed hike odds near 90% into Wednesday's decision — how to trade the dollar, gold and the S&P 500A 0.3% monthly core CPI print has lifted the market-implied probability of a 25bp Fed hike on 16 September to roughly 86.5% ~ 90%, which would be the first increase since July 2023. Here is the decision timeline, the pricing versus the forecasts, both scenarios, and the key levels for the dollar, gold and the S&P 500.
Author  Suzie
Sep 14, Mon
A 0.3% monthly core CPI print has lifted the market-implied probability of a 25bp Fed hike on 16 September to roughly 86.5% ~ 90%, which would be the first increase since July 2023. Here is the decision timeline, the pricing versus the forecasts, both scenarios, and the key levels for the dollar, gold and the S&P 500.
placeholder
Gold falls below $4,300 as higher US yields bolster Fed rate hike betsGold price (XAU/USD) tumbles to near $4,295 during the early Asian session on Tuesday. The precious metal faces some selling pressure as rising bond yields and surging energy prices strengthen expectations that the US Federal Reserve (Fed) will raise interest rates this week. 
Author  FXStreet
Yesterday 01: 23
Gold price (XAU/USD) tumbles to near $4,295 during the early Asian session on Tuesday. The precious metal faces some selling pressure as rising bond yields and surging energy prices strengthen expectations that the US Federal Reserve (Fed) will raise interest rates this week. 
placeholder
【Daily Brief】10-year Treasury yield briefly tops 5%, S&P 500 slips to 7,602 and the dollar firms at 99.3 as the Fed's decision eve beginsThe 10-year Treasury yield touched 5.014% on Monday — its first print above 5% since October 2023 — while the S&P 500 closed 0.48% lower at 7,619.98 and the dollar index firmed to 99.3. Here is the full market wrap ahead of Wednesday's FOMC decision, the dot plot and the August retail sales report, plus today's CLARITY Act Senate vote.
Author  Irene Q.
Yesterday 08: 16
The 10-year Treasury yield touched 5.014% on Monday — its first print above 5% since October 2023 — while the S&P 500 closed 0.48% lower at 7,619.98 and the dollar index firmed to 99.3. Here is the full market wrap ahead of Wednesday's FOMC decision, the dot plot and the August retail sales report, plus today's CLARITY Act Senate vote.
Related Instrument
goTop
quote