

Bitcoin dramatic downward shift sends altcoins into double-digit losses
- Bitcoin shed $6,000 briefly after testing the $71,000 key resistance.
- Liquidated long positions approaching $800 million.
- Altcoins posted double-digit losses as their high correlation with Bitcoin still stands tall.
Bitcoin's (BTC) price saw a red Friday after plunging nearly 5% on the day. The move also saw the largest digital asset dragging down altcoins as it looked set to close the week on a bearish note.
Read more: Bitcoin Weekly Forecast: BTC’s rangebound movement leaves traders confused
Bitcoin’s dip saw liquidated long positions skyrocket
Bitcoin bulls attempted to break past the $71,000 level on Friday after testing it earlier on Monday. However, a harsh rejection pushed the number one cryptocurrency to around $65,000.
Several major altcoins felt twice the impact as Bitcoin went down, recording double-digit losses.
Solana (SOL), XRP, Dogecoin (DOGE), Toncoin (TON), Cardamom (ADA), Avalanche (AVAX), Shiba Inu (SHIB), and Bitcoin Cash (BCH) have all seen losses above 10% in the past twenty-four hours. This confirms Bitcoin's high correlation with altcoins.
As the effect of the dump continues playing out, liquidations keep rising. The market has witnessed more than $870 million in liquidations in the past 24 hours, with 95% of that number coming in the last 12 hours, according to data from Coinglass. Liquidated long positions are approaching the $800 million mark, with over $780 million positions wiped out.
Also read: Bitcoin meme coin PUPS hits new all-time high as Ordinals tokens see massive spike
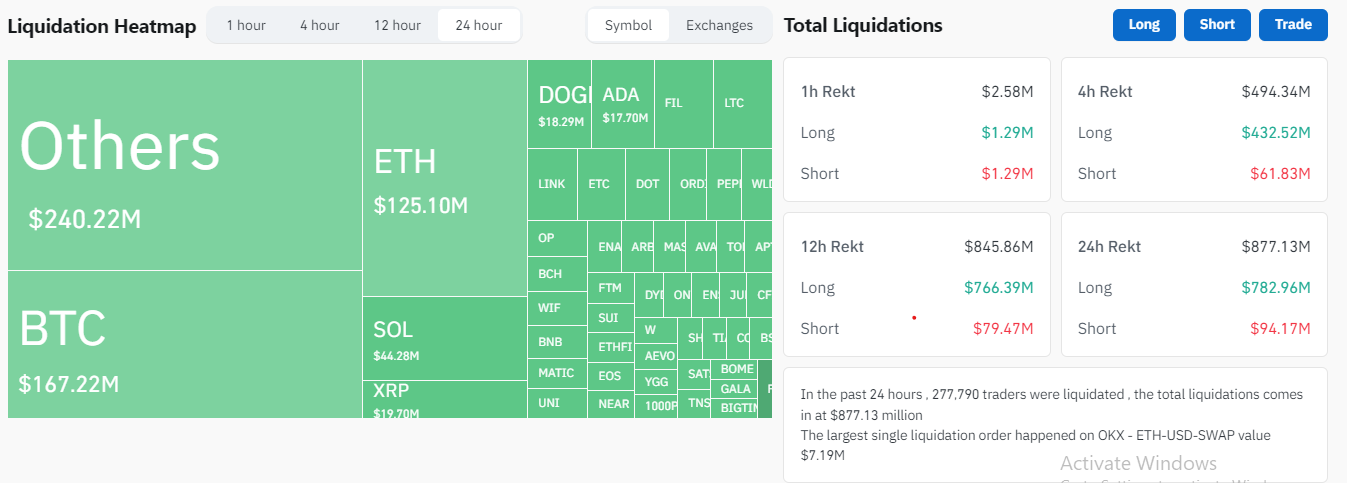
24-hour liquidation heatmap
Crash follows warnings from key community members
The recent crash comes amid warnings of increased volatility as the Bitcoin halving approaches. Arthur Hayes, cofounder of BitMEX crypto exchange, warned investors to cease trading until May after volatility from the halving has calmed. Dogecoin contributor @Mishabor also raised concern in an X post on Thursday about how leverage trading will prove highly risky, considering extreme volatility in the coming weeks.
Also read: Is Bitcoin sucking liquidity from altcoins, or will alt season begin again?
Many investors have attributed the dip to traders exercising caution following news of geopolitical tensions between Israel and Iran.
The market may be looking to take a new trajectory as the Bitcoin halving is less than seven days away.
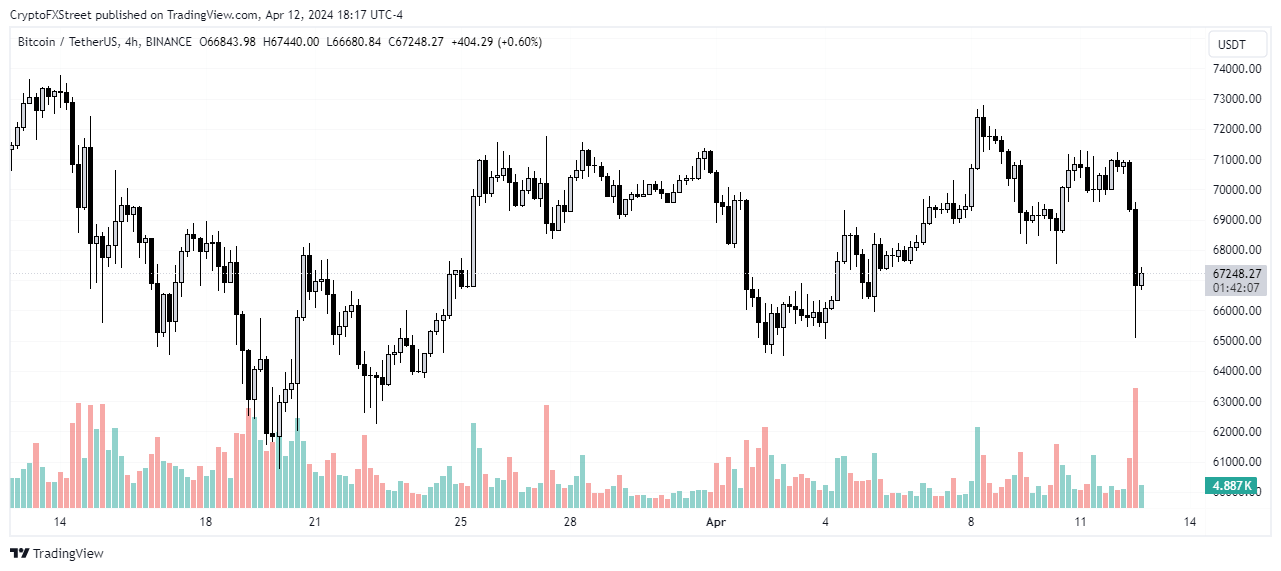
BTC/USDT 1-hour chart
Bitcoin is trading at $67,145 at the time of writing.
Recommended Articles


