

Bitcoin Weekly Forecast: BTC’s rangebound movement leaves traders confused
- Bitcoin price consolidation offers no insight into the directional bias.
- A potential retracement to below $60,000 could be a good buying opportunity ahead of the fourth halving.
- On-chain metrics show that the long-term bullish outlook remains intact.
Bitcoin (BTC) price has been hovering around the $70,000 psychological level for a few weeks, resulting in a rangebound movement. This development could lead to a massive liquidation on either side before a directional move is established. While Bitcoin’s long-term outlook remains positive, bouts of volatility could bring prices down ahead of the upcoming halving.
Read more: Hong Kong could approve spot Bitcoin ETFs as early as this month: Reuters
Bitcoin price volatility remains low
Bitcoin price action for the past month has been a sideways movement with no resolution of the ongoing consolidation. A similar outlook was noted between mid-December and mid-January. This rangebound movement led to a sweep of the range high followed by a sweep of the range low, collecting liquidity on both sides. Eventually, BTC's directional bias was clear as the king crypto moved higher.
An interesting observation is that the sweep of range lows on January 23 pushed Bitcoin price into the weekly imbalance, extending from $38,435 to $39,996. The current BTC price action also has a similar imbalance at the bottom, stretching from $53,120 to $59,111.
If history repeats itself, Bitcoin price could dip into this level before deciding on the directional bias.
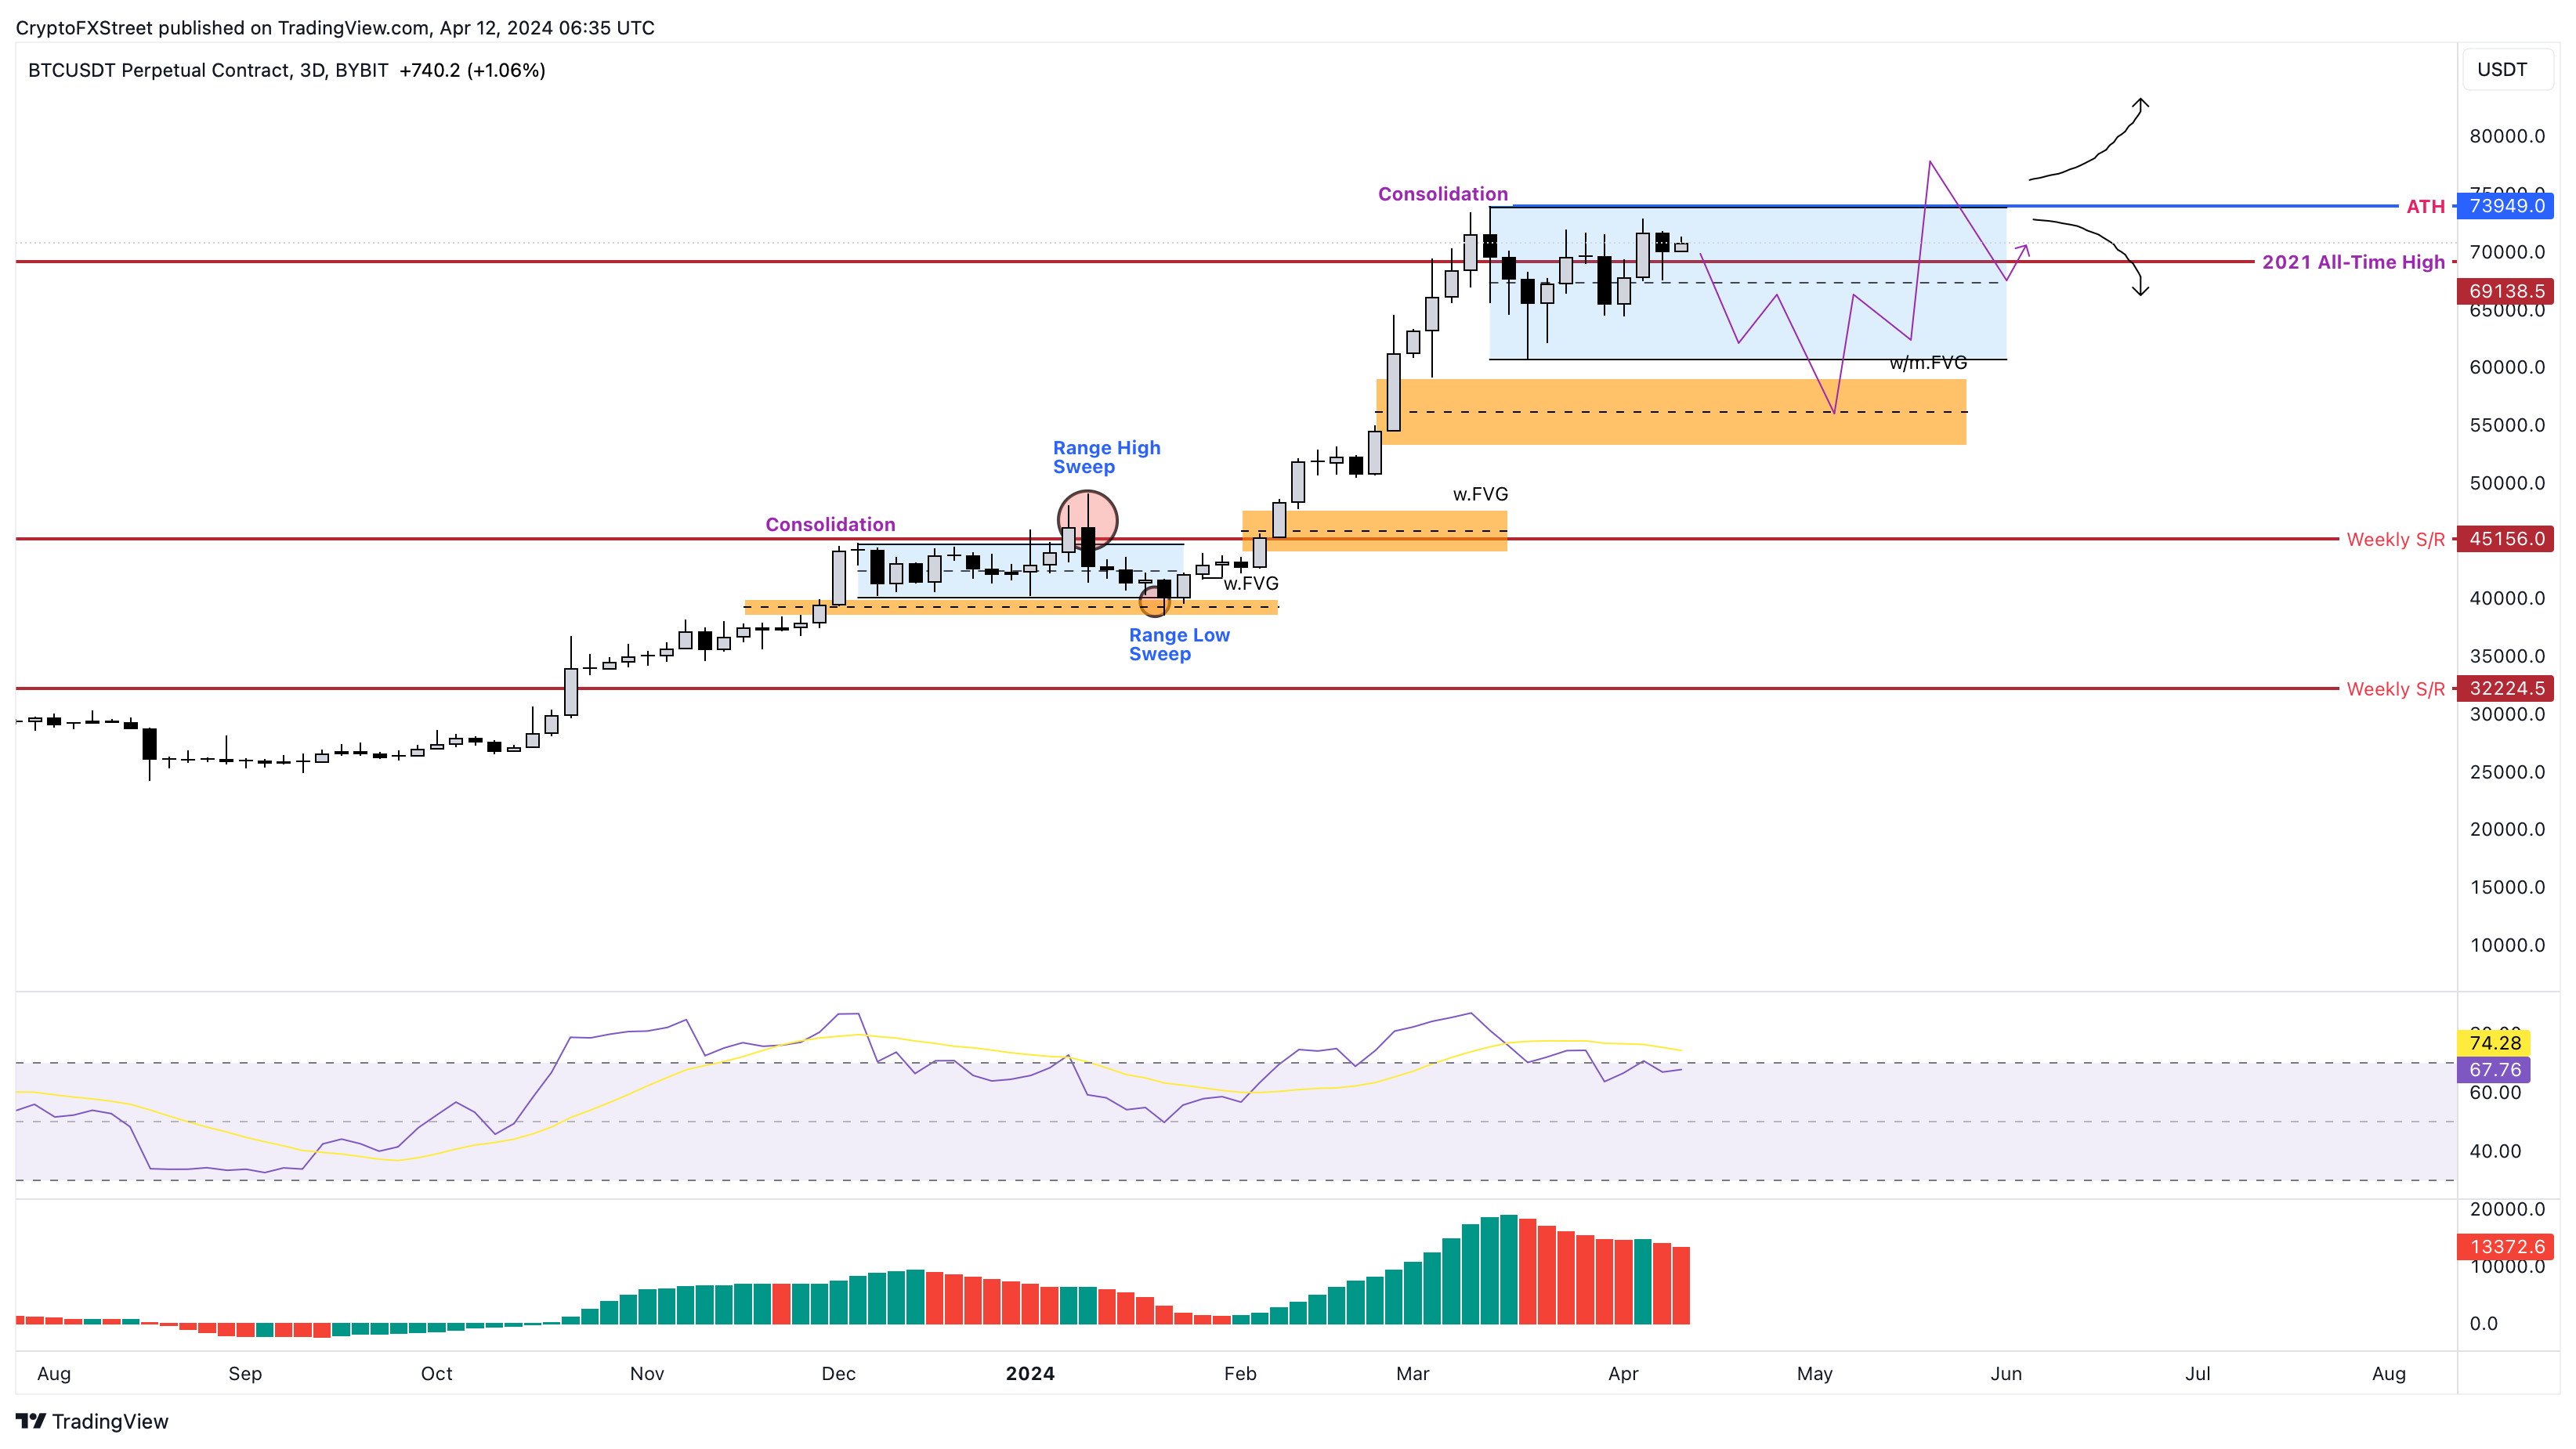
BTC/USDT 1-day chart
Other factors affect BTC’s directional bias
The fourth Bitcoin halving: This event, scheduled for April 19, could be one reason for Bitcoin’s consolidation. The build-up could lead to an explosive move on or after the halving event is complete.
Ideally, Bitcoin price rallies leading into the halving and corrects when the event is just a few days away. After this important miner reward upgrade, BTC's market value continues to increase. The theoretical reasoning beyond this behavior can be attributed to the negative supply shock created due to the reduction in supply while the demand remains the same.
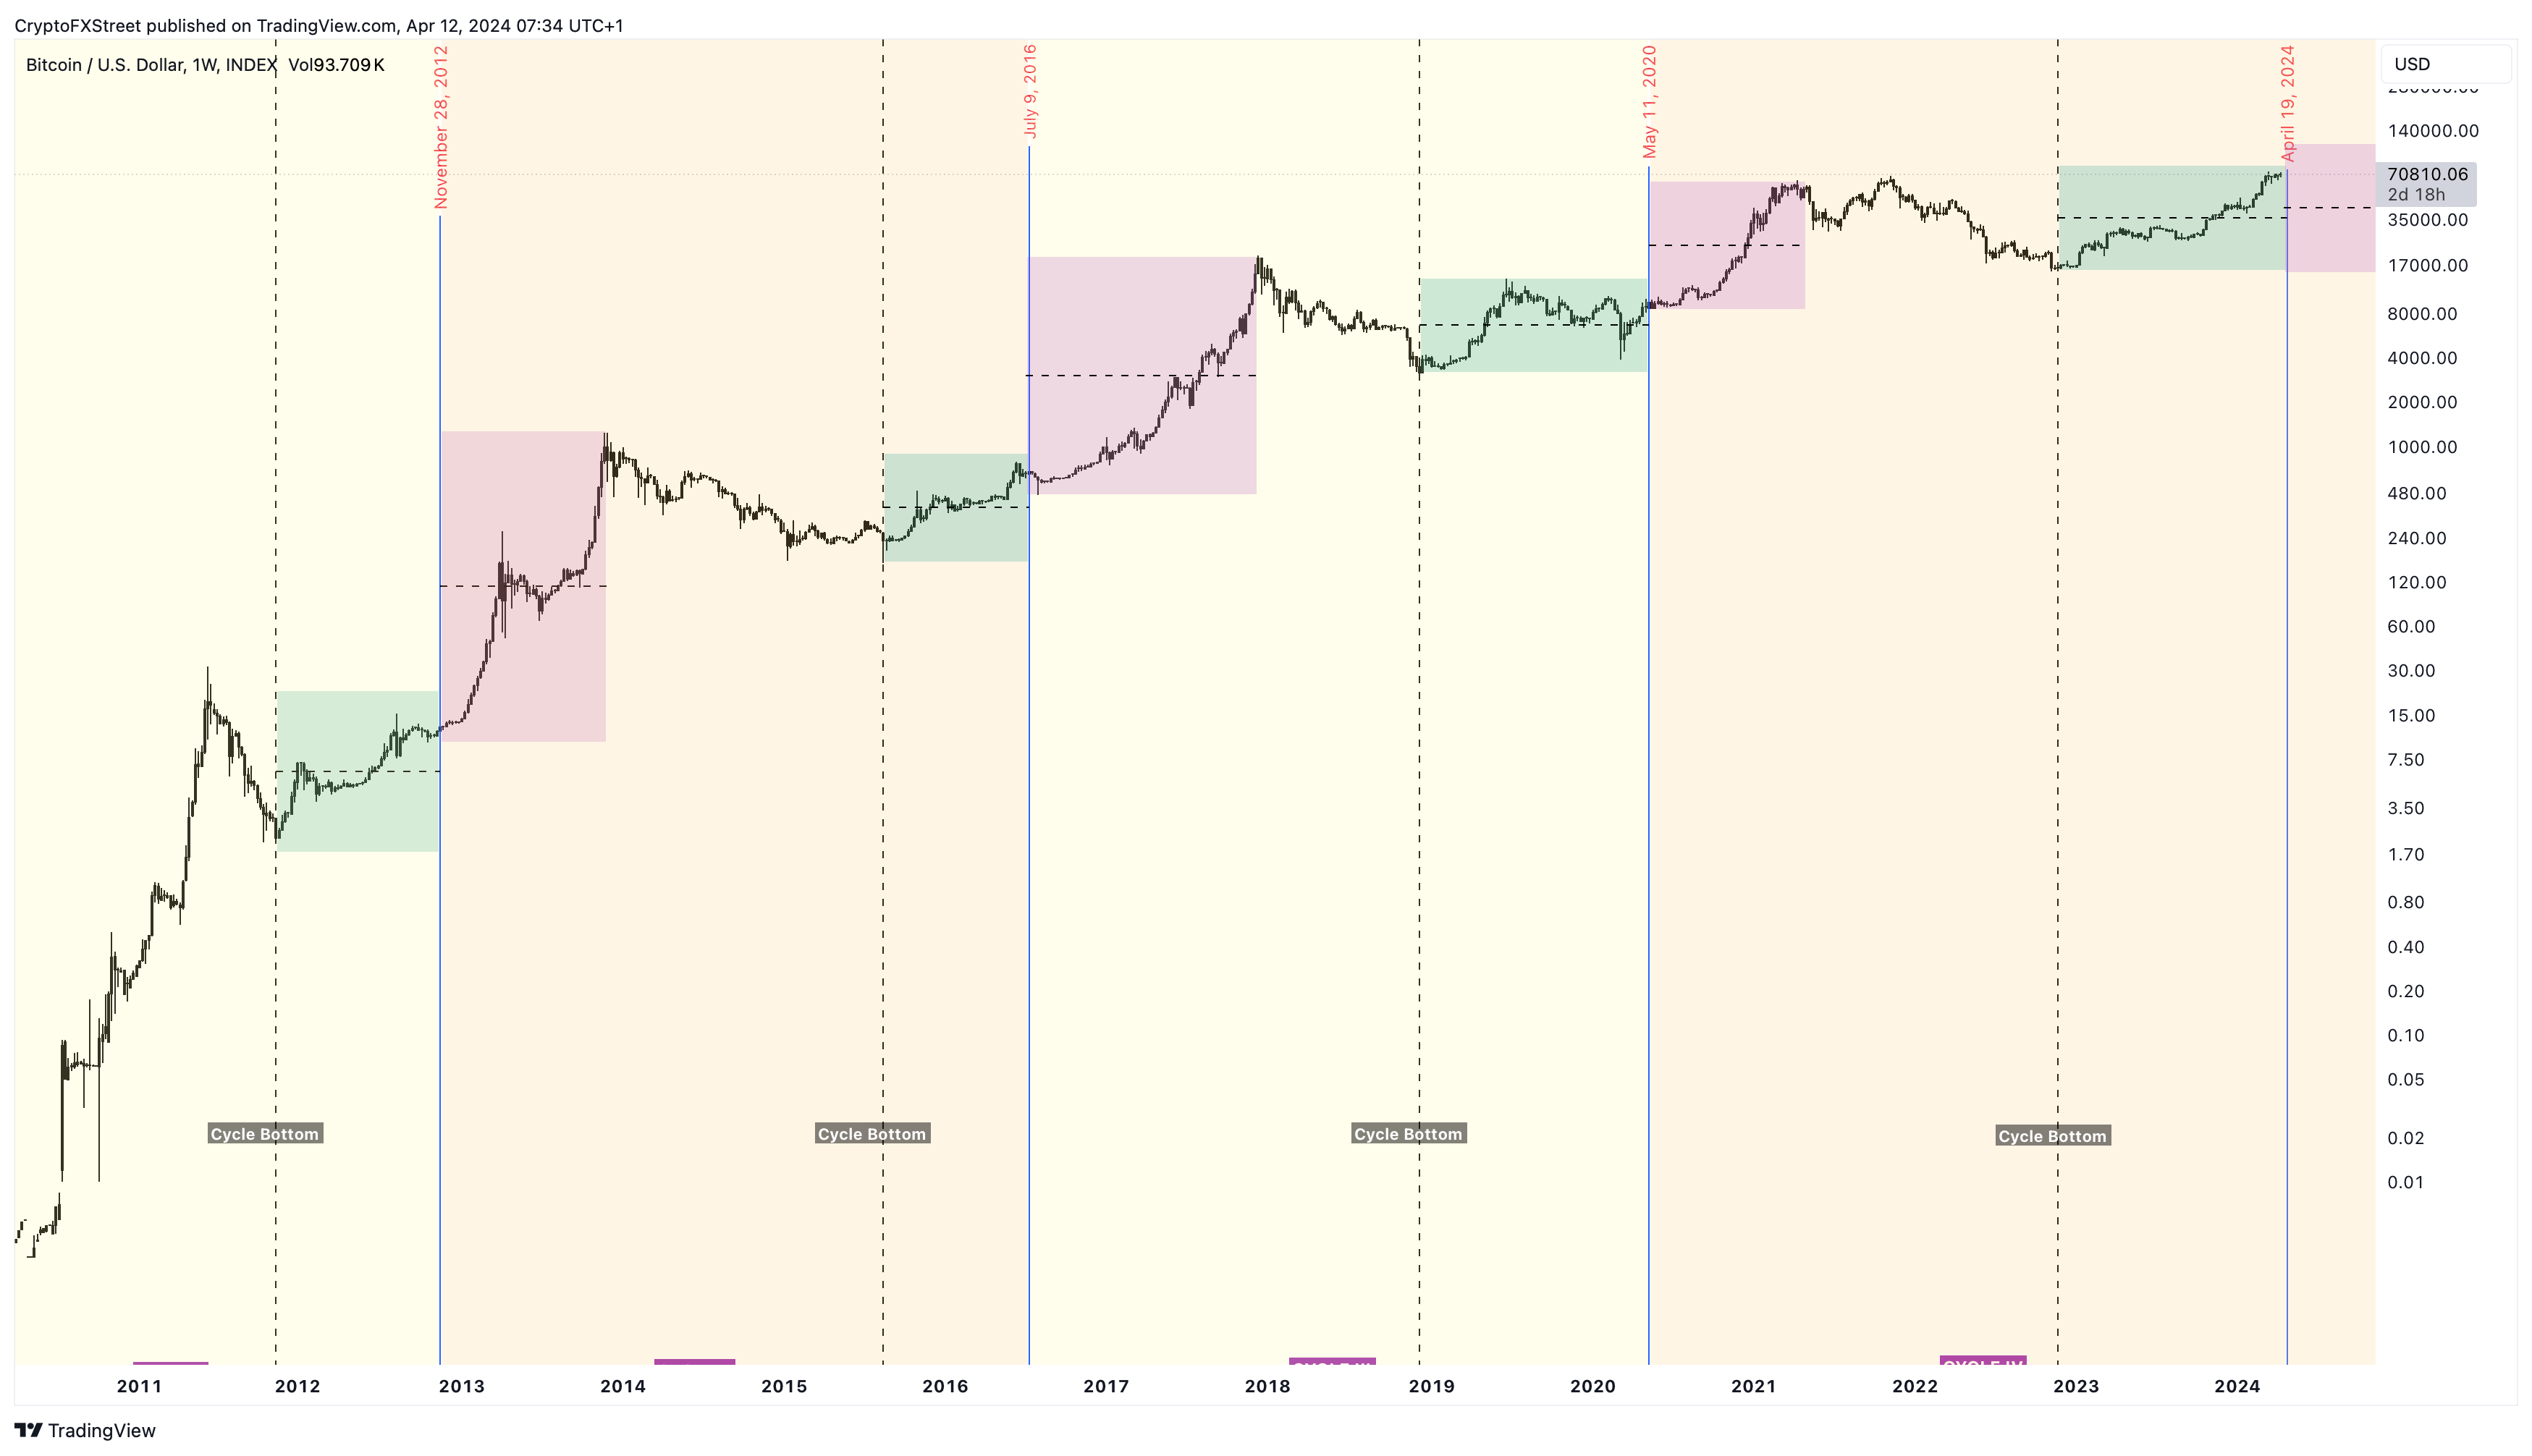
BTC Halving
Read more: BRC-20 tokens to watch out for Bitcoin halving
Macroeconomic events: The macroeconomic outlook also plays an important role in Bitcoin price discovery. With interest rates remaining higher for longer, capital is likely to rotate into relatively safer assets. For crypto, the relatively stable assets include stablecoins, Bitcoin and Ethereum, in some cases. The rise in Bitcoin dominance is significant proof of the aforementioned capital rotation.
Read more: Is Bitcoin sucking liquidity from altcoins, or will alt season begin again?
On-chain metrics: Despite reclaiming the 2021 highs, Bitcoin’s relative realized profit hit 1.8%, which is lower compared to 2021’s 3%, according to Glassnote data. This indicator suggests that the profit-taking intensity is far lower now than three years ago.
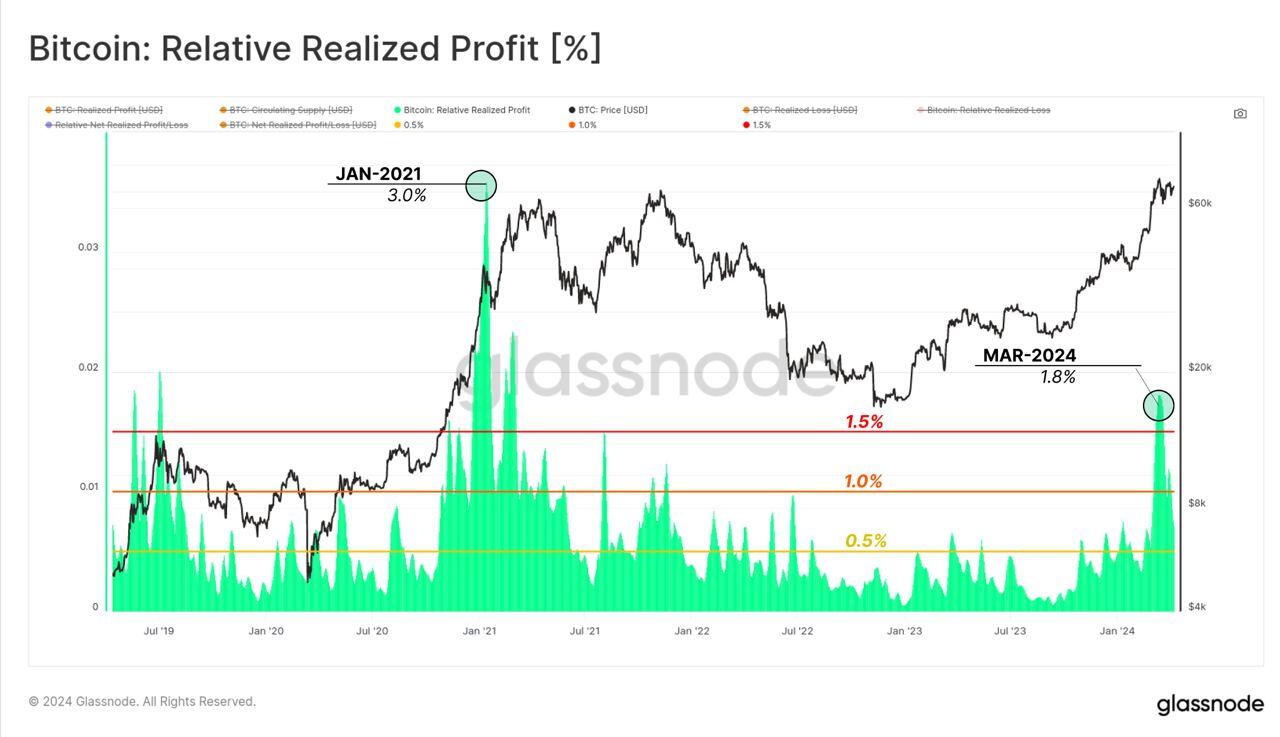
Bitcoin Relative Realized Profit Percentage
The Short-term Holder (STH) Market Value to Realized Value (MVRV) Momentum Indicator is used to gauge the unrealized profit or loss of recent market entrants. The index does this by comparing the STH cost basis to the current spot price. Traders can use this metric to gauge the pressure new participants face, highlighting potential moments for capitulation or profit-taking.
Currently, the STH-MVRV indicator is on a slow rise after declining during the March sell-off, suggesting that the STH could be building up positions ahead of the halving event.
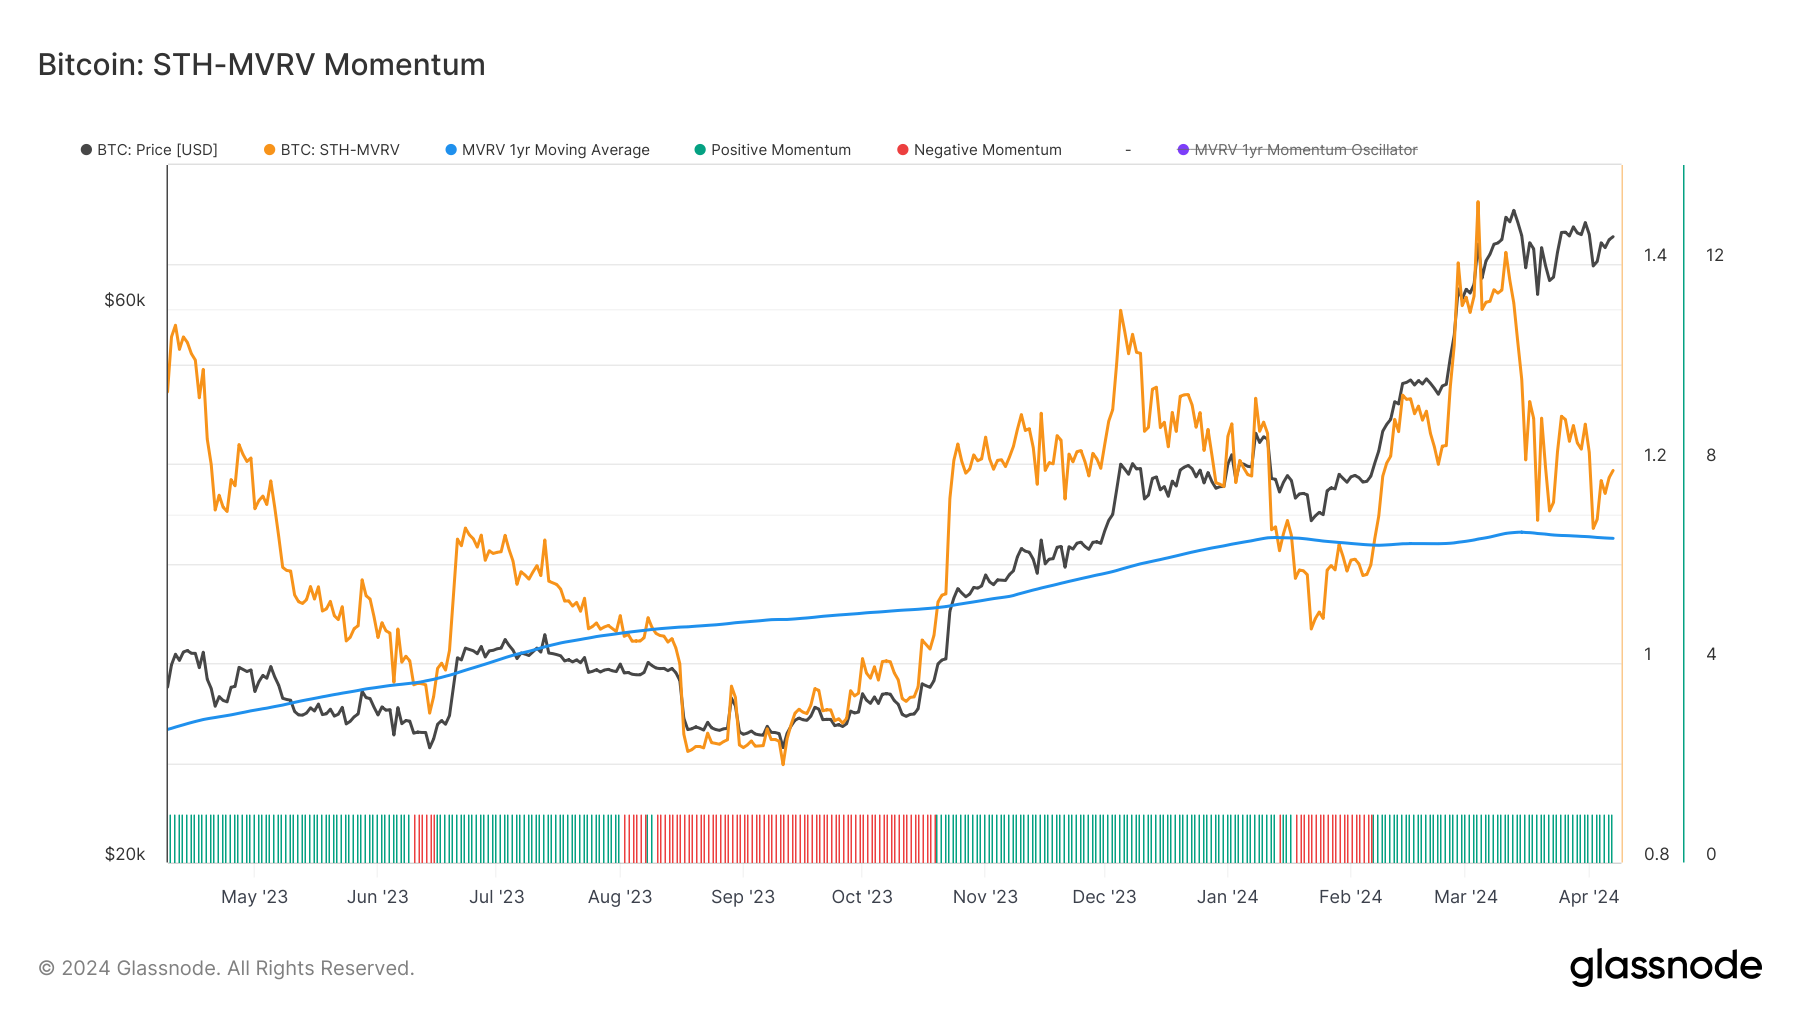
Bitcoin STH-MVRV
All in all, the long-term outlook for Bitcoin price remains intact, at least for now. But depending on external factors, a short-term correction will be the best-case scenario, propelling Bitcoin's price to new all-time highs. On-chain metrics and the macroeconomic outlook also suggest a favorable outcome for Bitcoin bulls, but the short-term consolidation is what traders, in particular, need to be cautious about.
A breakdown of the $45,156 level could trigger a panic sell-off in the crypto ecosystem. This development could invalidate the bullish thesis by producing a lower low.
Recommended Articles


