Ripple CEO says stablecoin could grow liquidity on XRPLedger, XRP breaks past $0.60 resistance

Source Fxstreet
  • XRP price surges past $0.60 resistance on Thursday, altcoin climbs nearly 5% from Monday’s low of $0.58. 
  • Ripple CEO Brad Garlinghouse discusses stablecoin plans and liquidity on XRPLedger at Paris Blockchain Week. 
  • Garlinghouse says there will be ETFs other than Bitcoin; it may take time in the US. 

Ripple (XRP) CEO spoke about USD-backed stablecoin, XRPLedger and Exchange Traded Funds (ETFs) in the US, at Paris Blockchain Week. XRP price is up nearly 5% this week. The altcoin extended gains on Thursday, flipping $0.60 resistance to support. 

Daily digest market movers: Ripple CEO shares stablecoin plans, XRPLedger insights at Paris Blockchain Week

  • Ripple CEO Brad Garlinghouse spoke at a gathering of professionals in blockchain and Web3 at the Paris Blockchain Week, on April 9. 
  • The Ripple executive shared details on expected stablecoin market capitalization growth and how the firm’s USD-backed stablecoin has a role to play alongside competitors like USD Tether (USDT) and Circle’s USD Coin (USDC).
  • Garlinghouse says that a stablecoin will boost the liquidity of the XRPLedger. 
  • The payment remittance firm has an extensive network of banking partnerships, and over 100 members are part of RippleNet, addressing commercial use cases with the help of the XRPLedger, per a case study by Amazon Web Services. 
  • Ripple CEO states that the stablecoin market capitalization could grow to two and a half or three trillion within the next four to five years. 

Technical analysis: XRP flips $0.60 resistance to support, extends gains

Ripple flipped the psychologically important $0.60 level from resistance to support on Thursday. XRP price climbed nearly 5% this week, from Monday’s low of $0.58 to $0.61, at the time of writing. The altcoin is currently in an ascending channel and two key resistances on XRP’s path to April 9 high of $0.6431 are April 8 high of $0.6265 and April 1 high of $0.6336. 

The green bars on the Awesome Oscillator (AO) support the thesis on XRP price gains. 

XRP

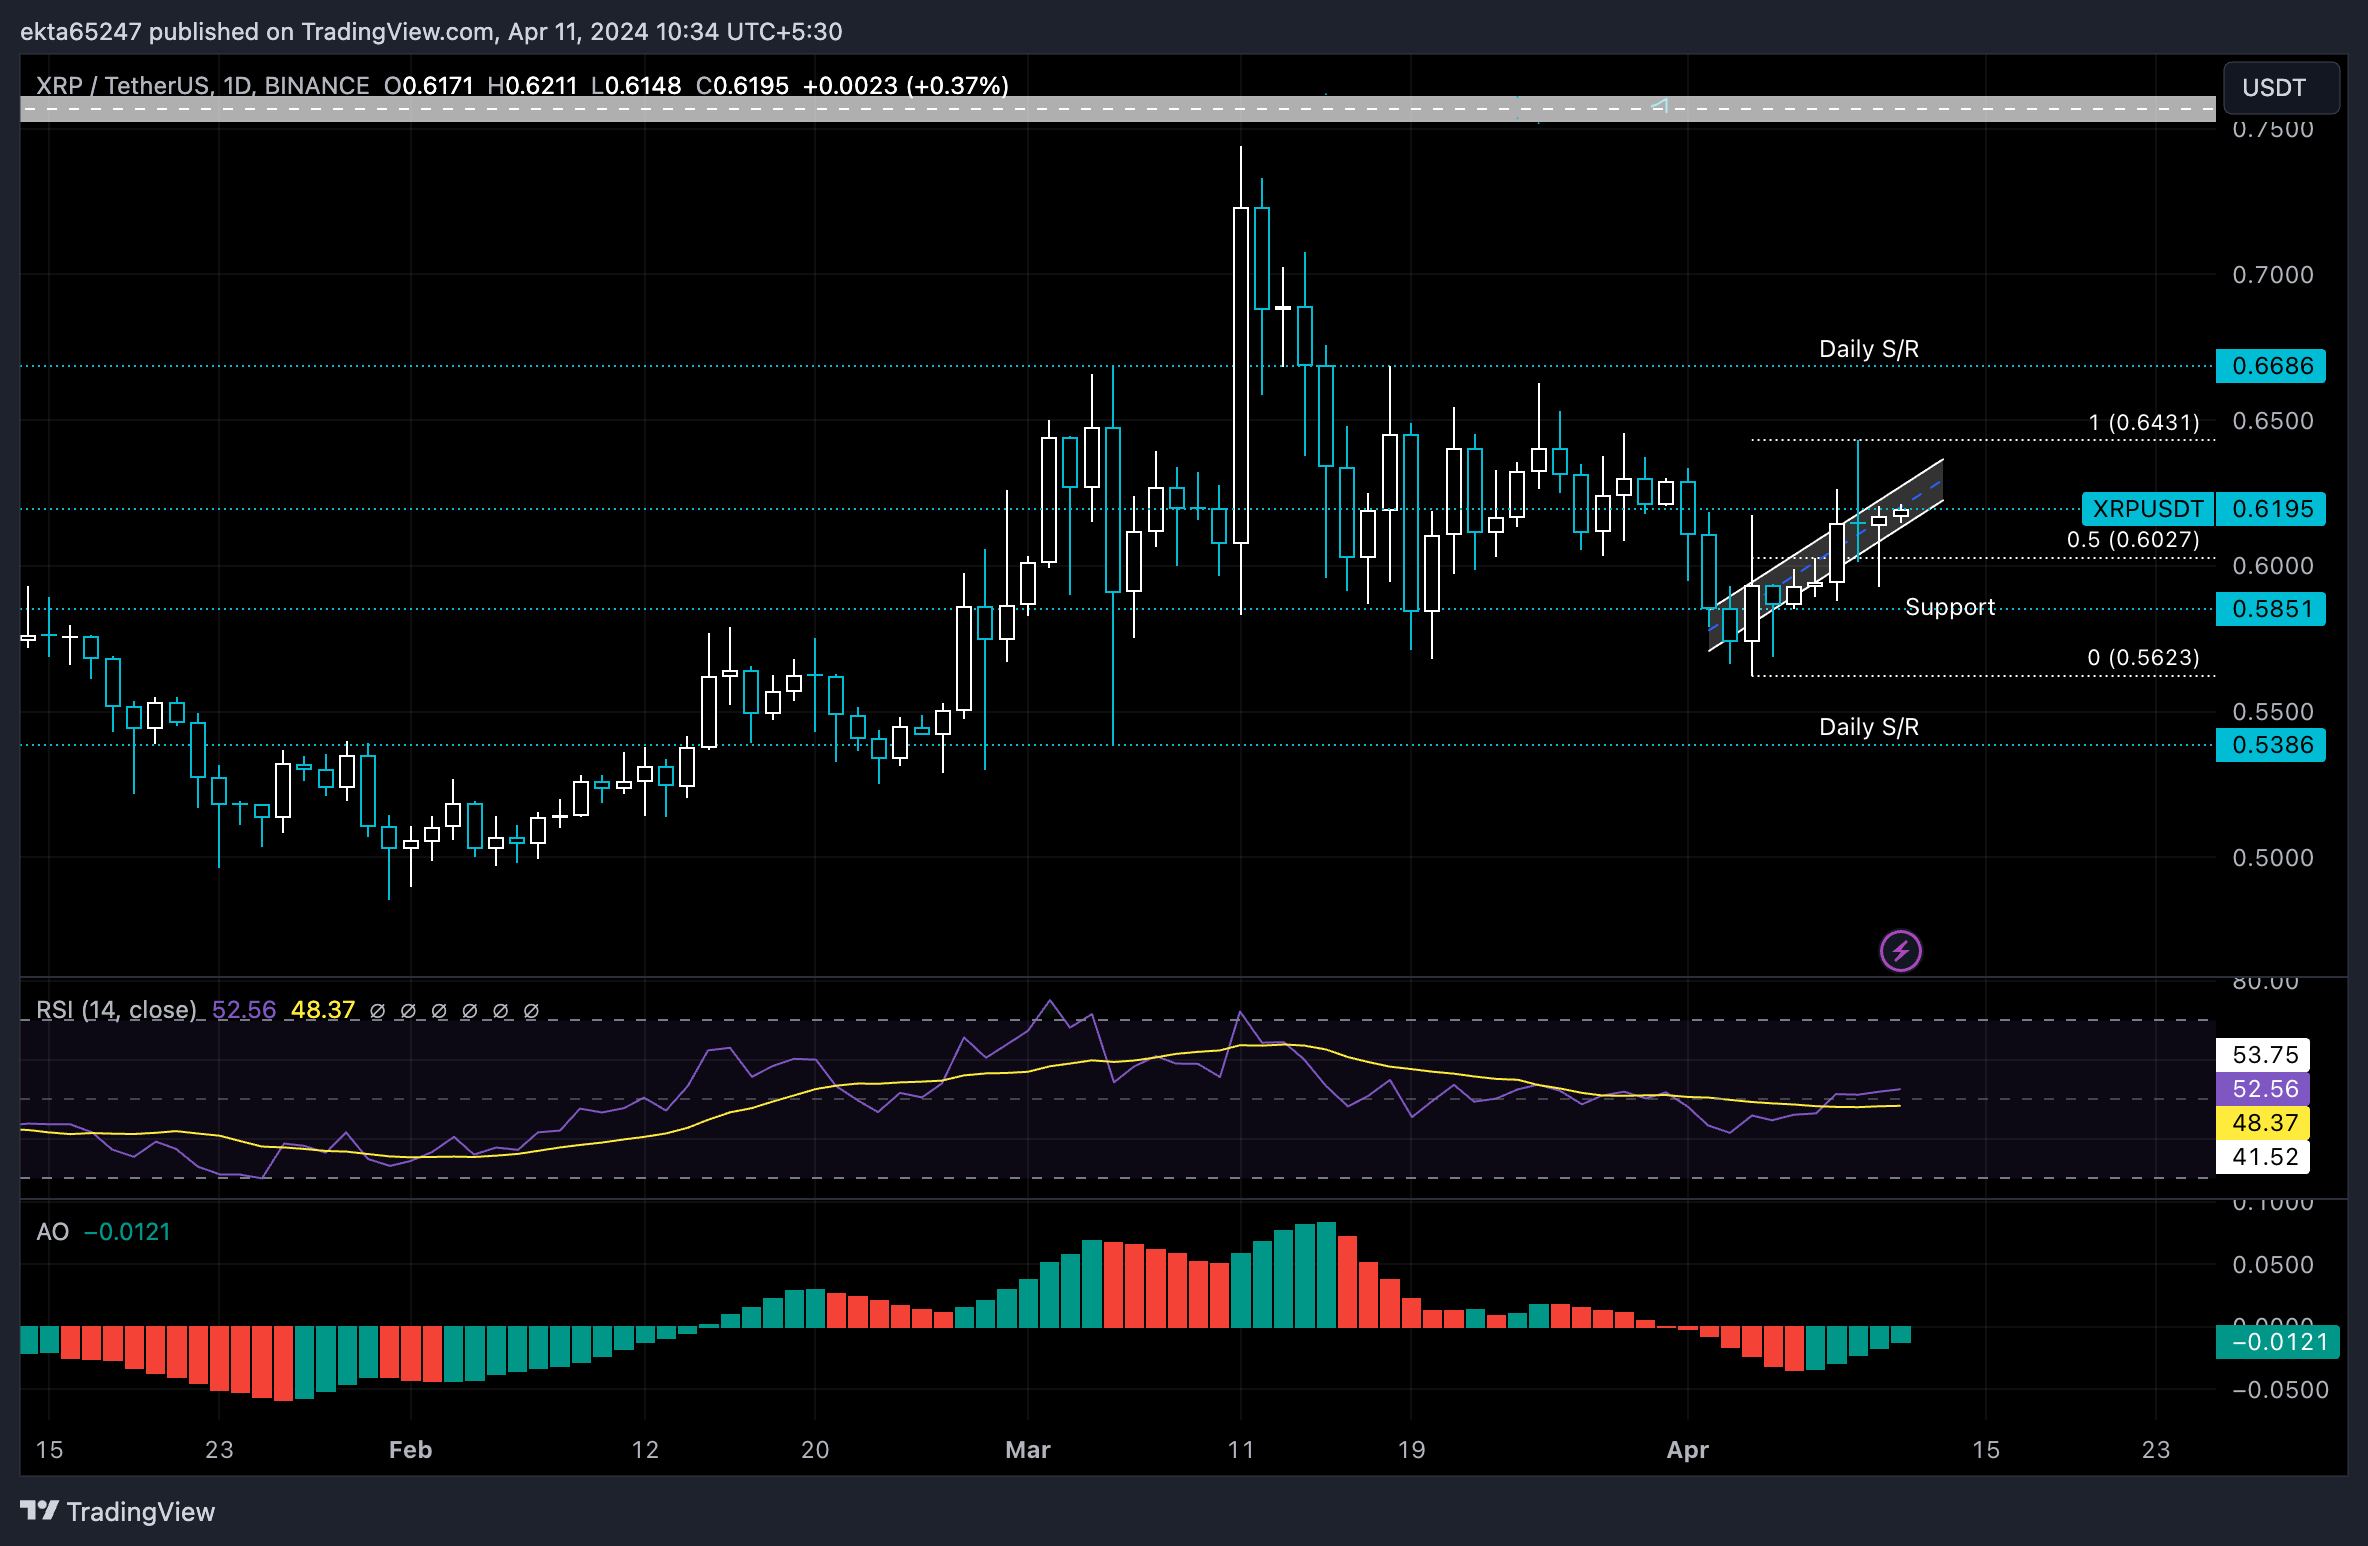
XRP/USDT 1-day chart 

A daily candlestick close below the lower boundary of the ascending channel at $0.6123 could invalidate the bullish thesis. XRP price could find support at $0.6027, the 50% Fibonacci retracement level of the climb to the April 8 local top of $0.6265. The next level is $0.5851; this has been observed as support throughout March and April 2024. 

Ripple FAQs

Ripple is a payments company that specializes in cross-border remittance. The company does this by leveraging blockchain technology. RippleNet is a network used for payments transfer created by Ripple Labs Inc. and is open to financial institutions worldwide. The company also leverages the XRP token.

XRP is the native token of the decentralized blockchain XRPLedger. The token is used by Ripple Labs to facilitate transactions on the XRPLedger, helping financial institutions transfer value in a borderless manner. XRP therefore facilitates trustless and instant payments on the XRPLedger chain, helping financial firms save on the cost of transacting worldwide.

XRPLedger is based on a distributed ledger technology and the blockchain using XRP to power transactions. The ledger is different from other blockchains as it has a built-in inflammatory protocol that helps fight spam and distributed denial-of-service (DDOS) attacks. The XRPL is maintained by a peer-to-peer network known as the global XRP Ledger community.

XRP uses the interledger standard. This is a blockchain protocol that aids payments across different networks. For instance, XRP’s blockchain can connect the ledgers of two or more banks. This effectively removes intermediaries and the need for centralization in the system. XRP acts as the native token of the XRPLedger blockchain engineered by Jed McCaleb, Arthur Britto and David Schwartz.


Disclaimer: For information purposes only. Past performance is not indicative of future results.
placeholder
Ethereum Price Slips Lower — $3,000 Looms as the Key BattlegroundEthereum is attempting to recover from a $3,026 low but remains below $3,200 and the 100-hour SMA, with a bearish trend line near $3,175 capping rebounds as bulls need a clean break above $3,200 to target $3,250–$3,400, while a drop below $3,050 risks a retest of $3,000 and $2,940.
Author  Mitrade
Dec 15, Mon
Ethereum is attempting to recover from a $3,026 low but remains below $3,200 and the 100-hour SMA, with a bearish trend line near $3,175 capping rebounds as bulls need a clean break above $3,200 to target $3,250–$3,400, while a drop below $3,050 risks a retest of $3,000 and $2,940.
placeholder
Bitcoin Slides 5% as Sellers Lean In — Can BTC Reclaim $88,000?Bitcoin has dropped back below $88,000 after rolling over from $90,500, with price still trading under the 100-hour Simple Moving Average. The sell-off found a floor at $85,151, and BTC is now consolidating near that base, but rebounds are facing pressure from a bearish trend line around $89,000. Bulls need to retake $88,000–$89,000 to ease downside risk; failure to do so keeps $85,500–$85,000 and then $83,500 in play, with $80,000 as the deeper “line in the sand.” Bitcoin (BTC) is back in damage-control mode after a sharp pullback wiped out recent gains. The price failed to reclaim the $90,000–$90,500 band, rolled over, and slid through $88,500 before briefly dipping under $87,000. Buyers did show up around $85,000, but the rebound so far looks more like stabilization than a clear trend reversal. Bitcoin dips hard, finds a bid near $85,000(h3) BTC’s latest move lower began when it couldn’t build follow-through above $90,000 and $90,500. Once that upside stalled, sellers took control and pushed price down through $88,500. The slide accelerated enough to spike below $87,000, but the market didn’t free-fall. Bulls defended the $85,000 zone, printing a low at $85,151. Since then, Bitcoin has been consolidating below the 23.6% Fibonacci retracement of the drop from the $93,560 swing high to the $85,151 low — a clue that the bounce is still shallow and that sellers haven’t fully backed off yet. Structurally, BTC is still on the back foot: It’s trading below $88,000, and It remains below the 100-hour Simple Moving Average, keeping short-term trend pressure pointed downward. Resistance is layered, and $89,000 is the problem area(h3) If bulls try to turn this into a recovery, they’ll have to climb through multiple ceilings in quick succession. First, BTC faces resistance around $87,150, followed by a more meaningful barrier near $87,500. From there, the market’s attention snaps back to $88,000 — the level BTC just lost and now needs to reclaim. A close back above $88,000 would improve the tone, but it doesn’t solve the bigger issue: there’s a bearish trend line on the hourly BTC/USD chart (Kraken feed) with resistance near $89,000, which also lines up with the next technical hurdle. If BTC can push through $89,000 and hold, the rebound could extend toward $90,000, with follow-through targets at $91,000 and $91,500. But until price clears that $88,000–$89,000 zone, rallies are at risk of being sold rather than chased. If BTC fails to reclaim resistance, the downside path is clear(h3) The near-term bear case is simple: if Bitcoin can’t climb back above the $87,000 area and keep traction, sellers may attempt another leg lower. Support levels line up like this: Immediate support: $85,500 First major support: $85,000 Next support: $83,500 Then $82,500 in the near term Below that, the major “don’t break this” level is still $80,000. If BTC slips under $80,000, the risk of acceleration to the downside increases significantly — not because it’s magic, but because it’s the kind of psychological and structural level that tends to trigger forced de-risking. Indicators: momentum still leans bearish(h3) The intraday indicators aren’t offering much comfort yet: Hourly MACD is losing pace in the bearish zone. Hourly RSI remains below 50, suggesting sellers still have the upper hand on short timeframes. So while the $85,000 defense held for now, the market hasn’t flipped bullish — it’s just stopped bleeding.
Author  Mitrade
Dec 16, Tue
Bitcoin has dropped back below $88,000 after rolling over from $90,500, with price still trading under the 100-hour Simple Moving Average. The sell-off found a floor at $85,151, and BTC is now consolidating near that base, but rebounds are facing pressure from a bearish trend line around $89,000. Bulls need to retake $88,000–$89,000 to ease downside risk; failure to do so keeps $85,500–$85,000 and then $83,500 in play, with $80,000 as the deeper “line in the sand.” Bitcoin (BTC) is back in damage-control mode after a sharp pullback wiped out recent gains. The price failed to reclaim the $90,000–$90,500 band, rolled over, and slid through $88,500 before briefly dipping under $87,000. Buyers did show up around $85,000, but the rebound so far looks more like stabilization than a clear trend reversal. Bitcoin dips hard, finds a bid near $85,000(h3) BTC’s latest move lower began when it couldn’t build follow-through above $90,000 and $90,500. Once that upside stalled, sellers took control and pushed price down through $88,500. The slide accelerated enough to spike below $87,000, but the market didn’t free-fall. Bulls defended the $85,000 zone, printing a low at $85,151. Since then, Bitcoin has been consolidating below the 23.6% Fibonacci retracement of the drop from the $93,560 swing high to the $85,151 low — a clue that the bounce is still shallow and that sellers haven’t fully backed off yet. Structurally, BTC is still on the back foot: It’s trading below $88,000, and It remains below the 100-hour Simple Moving Average, keeping short-term trend pressure pointed downward. Resistance is layered, and $89,000 is the problem area(h3) If bulls try to turn this into a recovery, they’ll have to climb through multiple ceilings in quick succession. First, BTC faces resistance around $87,150, followed by a more meaningful barrier near $87,500. From there, the market’s attention snaps back to $88,000 — the level BTC just lost and now needs to reclaim. A close back above $88,000 would improve the tone, but it doesn’t solve the bigger issue: there’s a bearish trend line on the hourly BTC/USD chart (Kraken feed) with resistance near $89,000, which also lines up with the next technical hurdle. If BTC can push through $89,000 and hold, the rebound could extend toward $90,000, with follow-through targets at $91,000 and $91,500. But until price clears that $88,000–$89,000 zone, rallies are at risk of being sold rather than chased. If BTC fails to reclaim resistance, the downside path is clear(h3) The near-term bear case is simple: if Bitcoin can’t climb back above the $87,000 area and keep traction, sellers may attempt another leg lower. Support levels line up like this: Immediate support: $85,500 First major support: $85,000 Next support: $83,500 Then $82,500 in the near term Below that, the major “don’t break this” level is still $80,000. If BTC slips under $80,000, the risk of acceleration to the downside increases significantly — not because it’s magic, but because it’s the kind of psychological and structural level that tends to trigger forced de-risking. Indicators: momentum still leans bearish(h3) The intraday indicators aren’t offering much comfort yet: Hourly MACD is losing pace in the bearish zone. Hourly RSI remains below 50, suggesting sellers still have the upper hand on short timeframes. So while the $85,000 defense held for now, the market hasn’t flipped bullish — it’s just stopped bleeding.
placeholder
December Santa Claus Rally: New highs in sight for US and European stocks?Historical data show a rising trend of US and European stocks in December. If the momentum is strong, fund managers may rush in with a buying frenzy.
Author  Mitrade
Yesterday 02: 50
Historical data show a rising trend of US and European stocks in December. If the momentum is strong, fund managers may rush in with a buying frenzy.
placeholder
XRP’s Price Action Flashes a Warning Even as ETF Flows Stay PositiveXRP’s structure remains weak despite 18 straight positive closes in spot XRP ETFs, with analysts warning that $1.98 and other nearby resistance zones could cap rebounds unless the YO region is reclaimed, while deeper downside scenarios keep $1.53 on watch as a potential (not guaranteed) accumulation area.
Author  Mitrade
Yesterday 06: 37
XRP’s structure remains weak despite 18 straight positive closes in spot XRP ETFs, with analysts warning that $1.98 and other nearby resistance zones could cap rebounds unless the YO region is reclaimed, while deeper downside scenarios keep $1.53 on watch as a potential (not guaranteed) accumulation area.
placeholder
Gold declines on profit-taking, USD strength ahead of US CPI releaseGold price (XAU/USD) edges lower below $4,350 during the Asian trading hours on Thursday. The precious metal retreats from seven-week highs amid some profit-taking and a rebound in the US Dollar (USD).
Author  FXStreet
3 hours ago
Gold price (XAU/USD) edges lower below $4,350 during the Asian trading hours on Thursday. The precious metal retreats from seven-week highs amid some profit-taking and a rebound in the US Dollar (USD).
goTop
quote