

Dogecoin Price Forecast: DOGE curving out path to $0.28, but low retail demand remains a concern
- Dogecoin reclaims $0.25 support as altcoins across the crypto market show signs of recovery.
- Retail demand for DOGE shrinks as Open Interest falls below the $5 billion mark.
- Positive funding rates reflect traders' strong confidence in DOGE's capacity to sustain its recovery.
Dogecoin (DOGE) rises alongside Bitcoin (BTC) and other altcoin majors, trading above $0.25 on Friday, supported by improving risk-on sentiment in the broader cryptocurrency market.
The meme coin had extended its down leg, testing $0.24 support earlier in the week, reflecting bearish sentiment, volatility and profit-taking activity as the 'Uptober' narrative took a breather.
Dogecoin gains momentum despite low retail demand
Retail interest in the leading meme coin by market capitalization, DOGE, has declined for three consecutive days, according to the futures Open Interest (OI), which averages $4.4 billion compared to $5.03 billion on Monday.
Given that OI is the notional value of outstanding futures contracts, a correction implies that traders are losing confidence and lack conviction in XRP's ability to sustain recovery toward the next key target at $0.28.
A steady decline in the OI could make it extremely difficult for bulls to sustain the uptrend as traders close their long positions or stay on the sidelines.
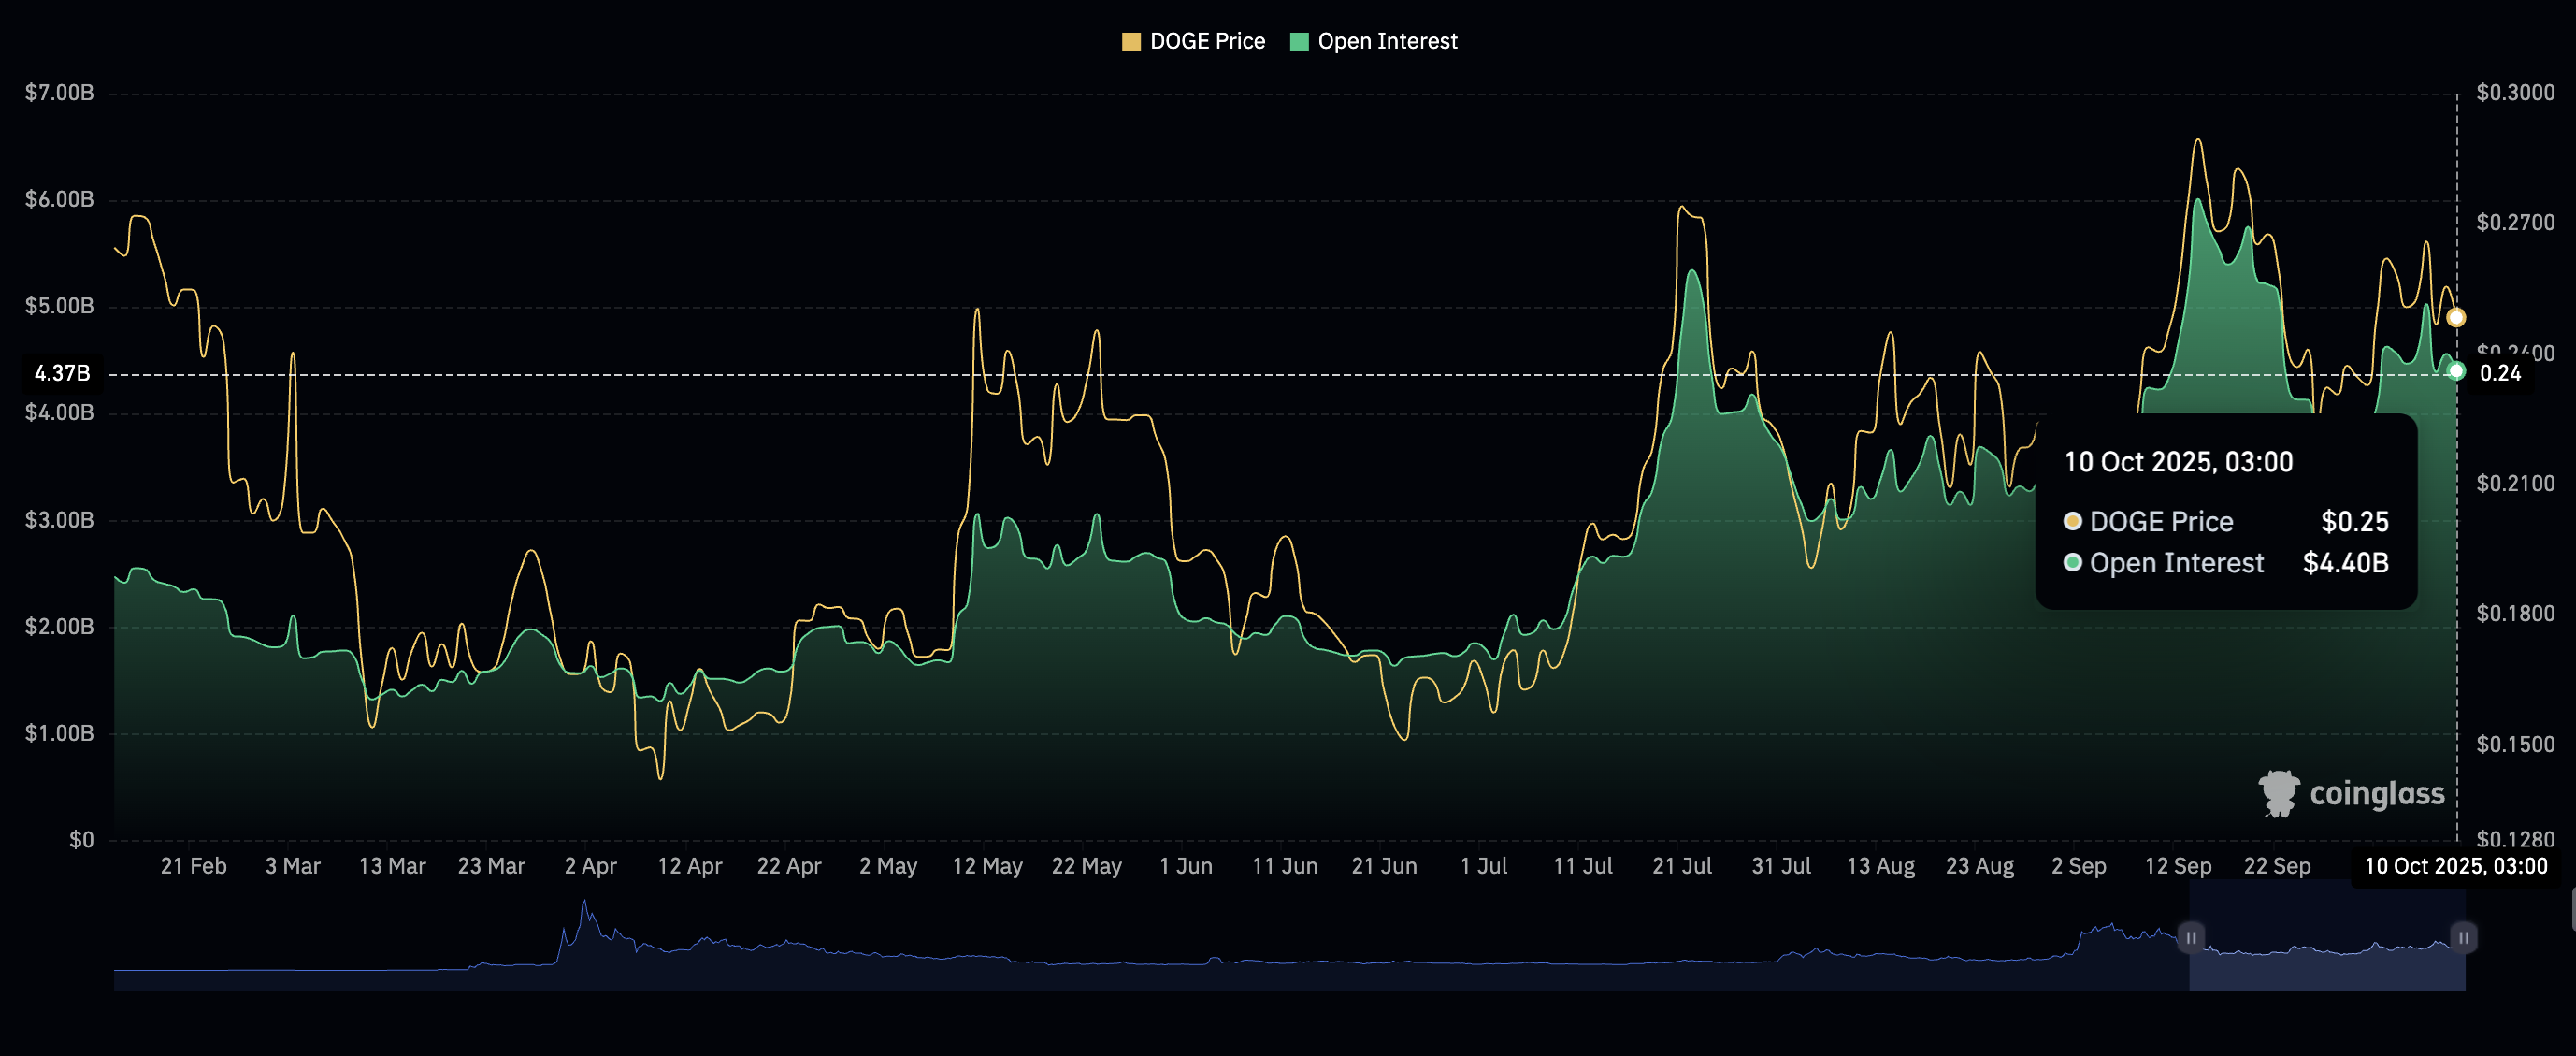
Dogecoin Open Interest | Source: CoinGlass
Still, Dogecoin showcases positive OI-weighted funding rates, suggesting that traders are bullishly optimistic. According to CoinGlass data, the OI-weighted funding rate stands at 0.0103%, up from 0.0057% on Thursday. Steady funding rates suggest that traders are increasingly piling into short positions, increasing the odds of a bullish breakout.
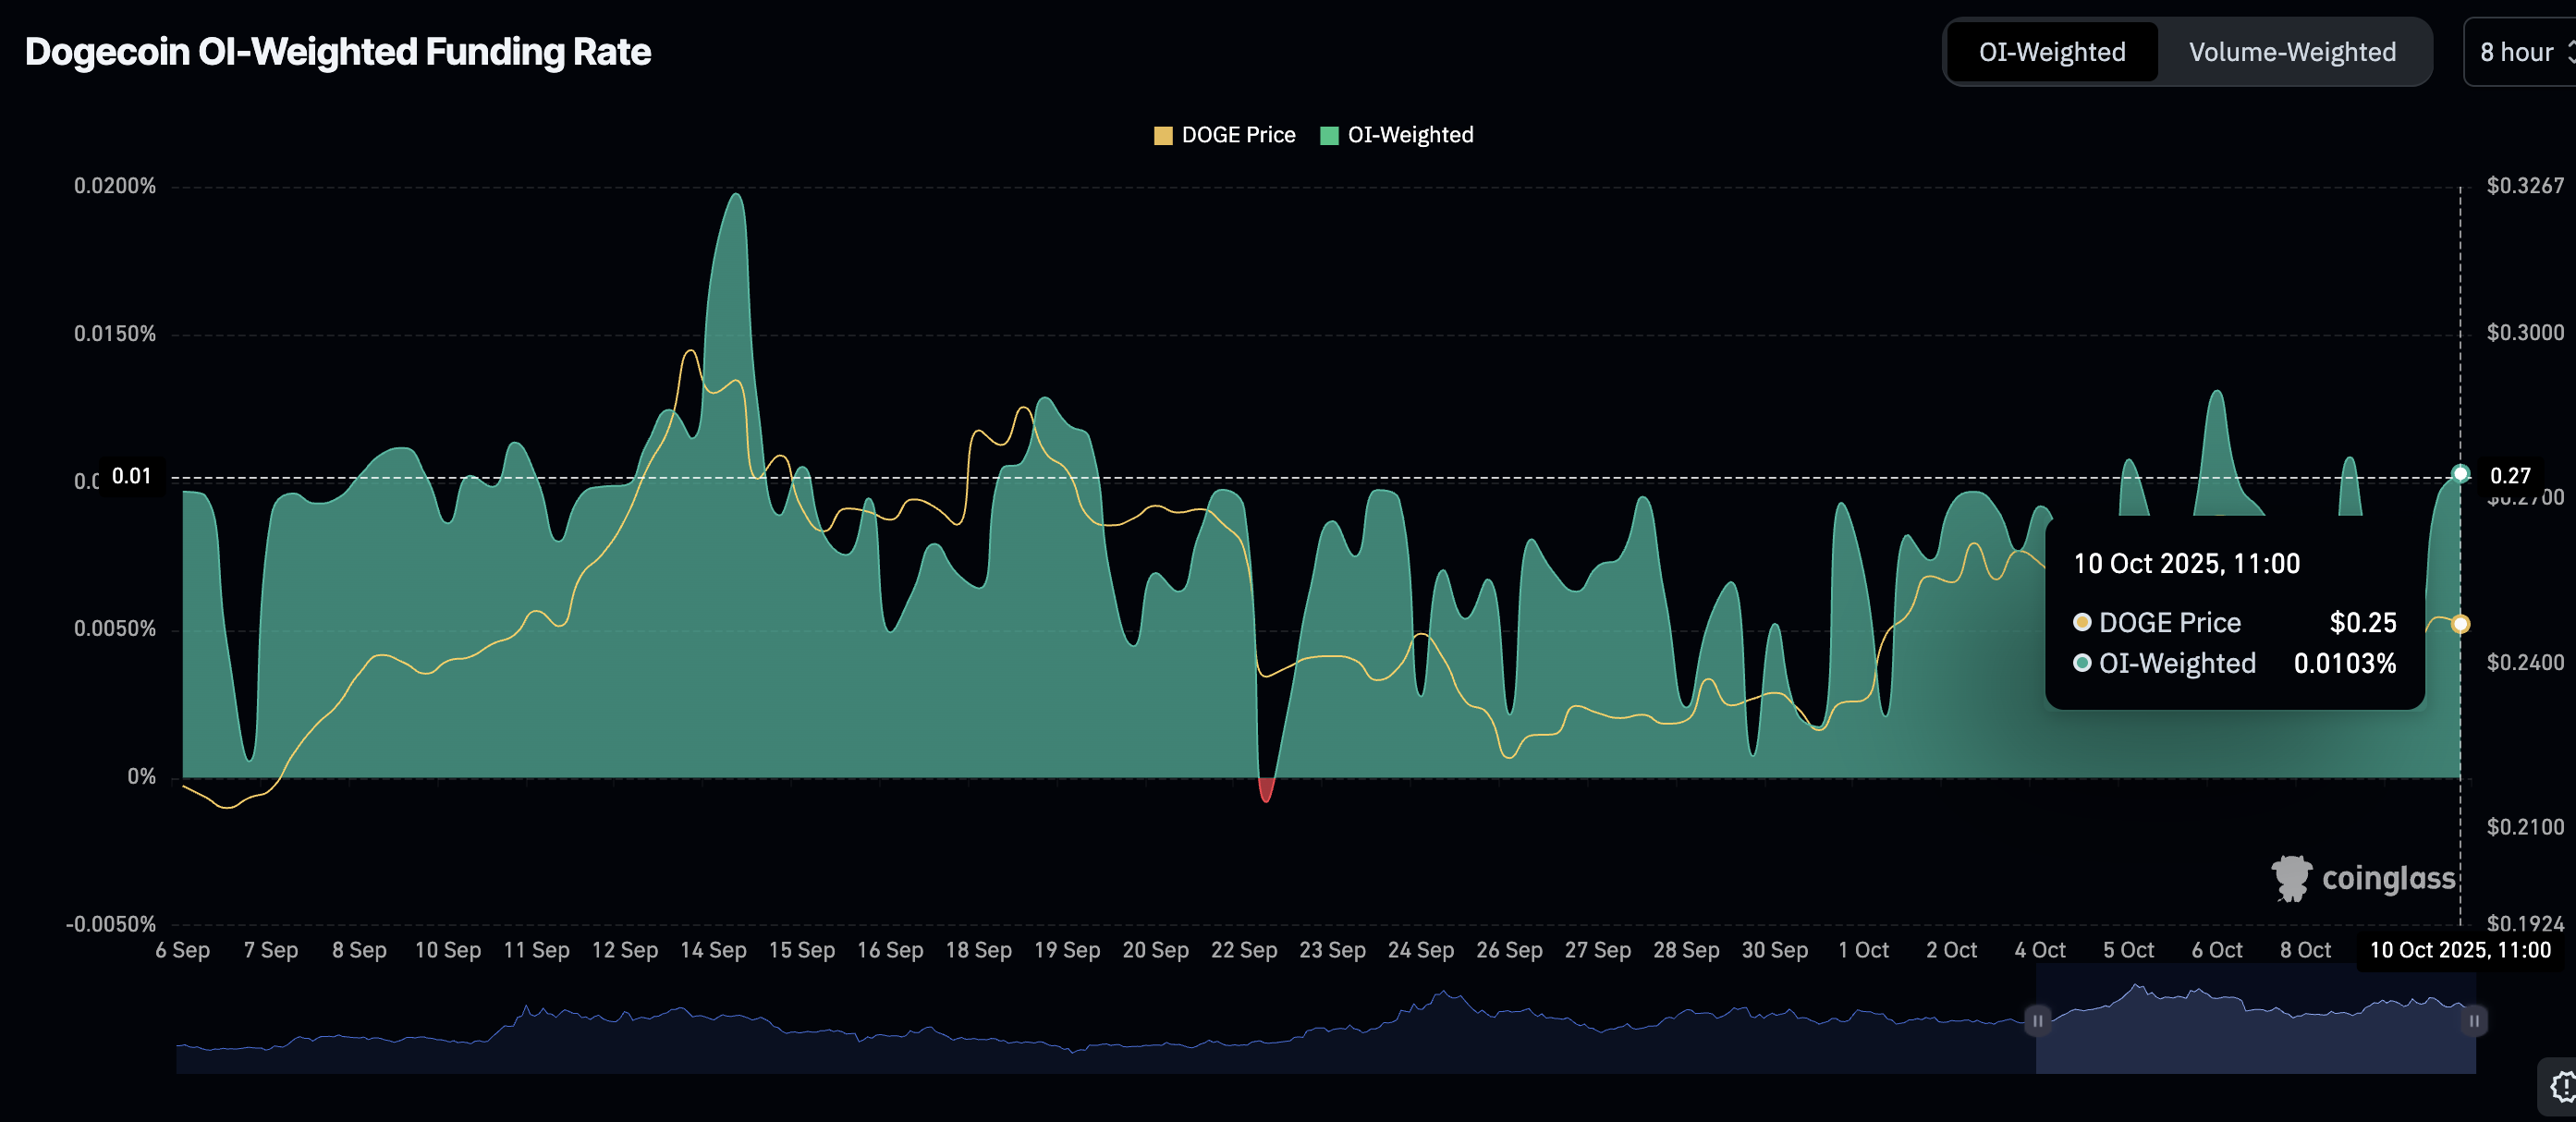
Dogecoin OI-Weighted Funding Rate | Source: CoinGlass
Technical outlook: Can Dogecoin sustain short-term recovery?
Dogecoin rises to hold the $0.25 support level at the time of writing on Friday, reflecting a subtle bullish wave sweeping across the crypto market. The 50-day Exponential Moving Average (EMA) support at $0.24 on the daily chart provides additional support.
If the Relative Strength Index (RSI) in the same daily time frame stays stable above the midline and climbs toward overbought levels, bullish momentum would support the expected recovery to $0.28.
Traders should also look out for a potential buy signal, which will manifest when the blue Moving Average Convergence Divergence (MACD) line crosses above the red signal line. This signal encourages traders to increase risk exposure.
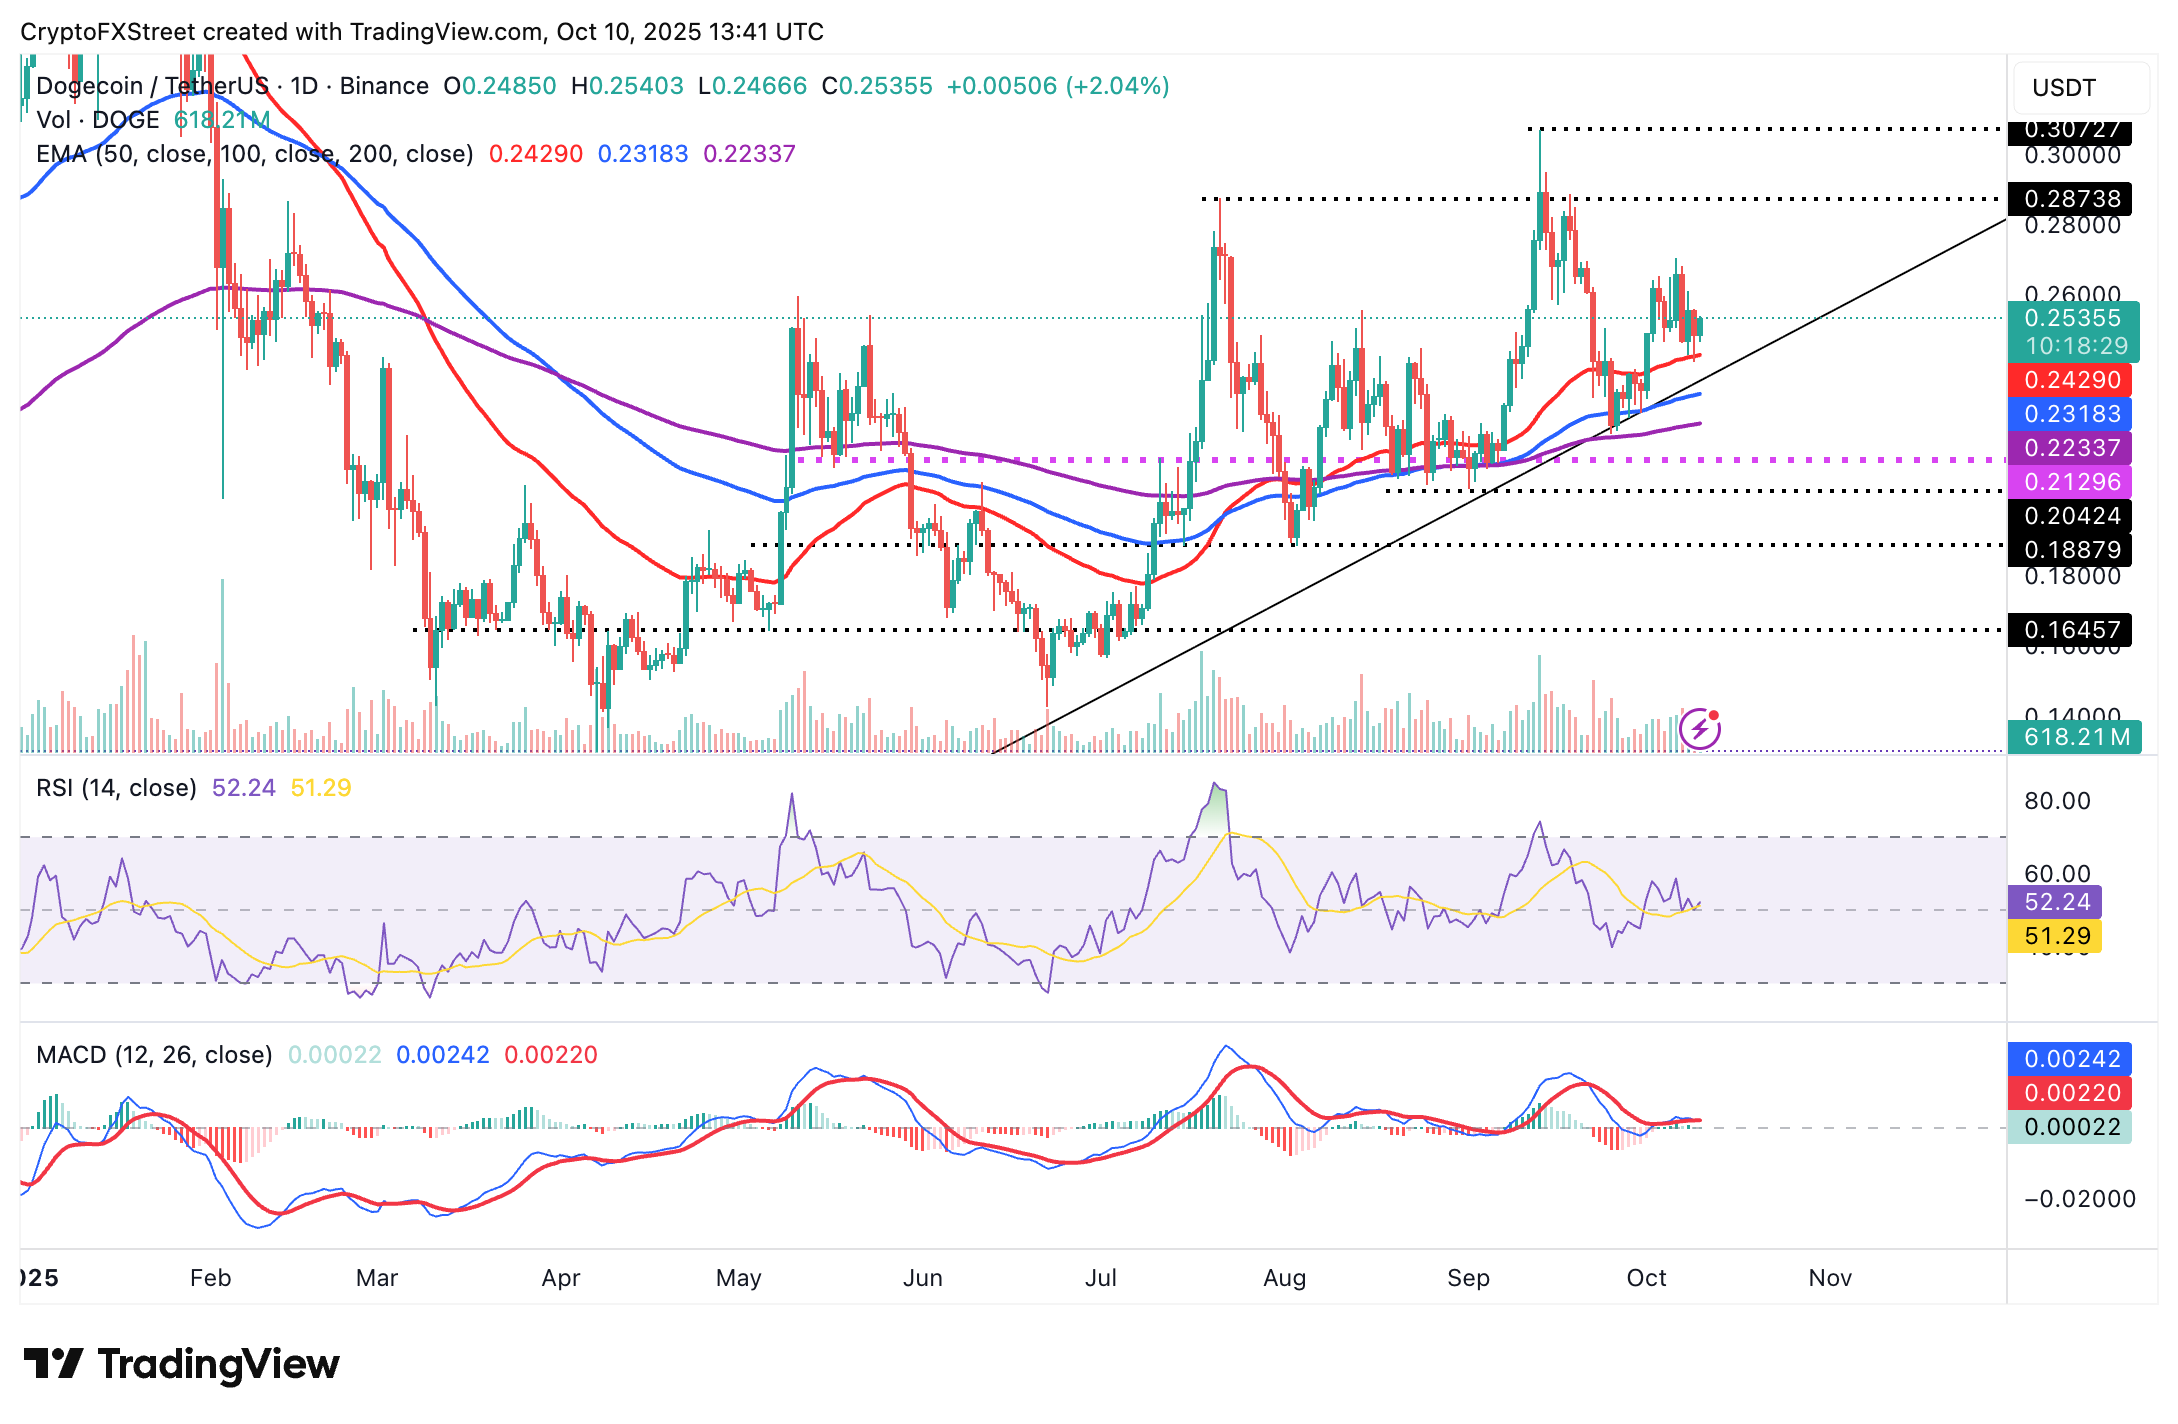
DOGE/USDT daily chart
Conversely, if the RSI drops below the midline and Dogecoin loses support at $0.25 and the 50-day EMA ($0.24), the downtrend could accelerate, breaking below the critical ascending trendline. Other key areas of interest for traders are the 100-day EMA at $0.23 and the 200-day EMA at $0.22, both of which will serve as support.
Open Interest, funding rate FAQs
Higher Open Interest is associated with higher liquidity and new capital inflow to the market. This is considered the equivalent of increase in efficiency and the ongoing trend continues. When Open Interest decreases, it is considered a sign of liquidation in the market, investors are leaving and the overall demand for an asset is on a decline, fueling a bearish sentiment among investors.
Funding fees bridge the difference between spot prices and prices of futures contracts of an asset by increasing liquidation risks faced by traders. A consistently high and positive funding rate implies there is a bullish sentiment among market participants and there is an expectation of a price hike. A consistently negative funding rate for an asset implies a bearish sentiment, indicating that traders expect the cryptocurrency’s price to fall and a bearish trend reversal is likely to occur.
Recommended Articles


