

Ethereum Price Forecast: ETH tackles $4,500 resistance following rising whale demand

Source Fxstreet

Ethereum price today: $4,480

  • Ethereum whales have bought over 840,000 ETH in the past two weeks.
  • The balance on accumulation addresses grew by a record 5.6 million ETH in September, despite the price decline in the month.
  • ETH has broken above the 50-day SMA and is now testing the $4,500 resistance.

Ethereum (ETH) continued its uptrend on Thursday, testing the $4,500 resistance following sustained buying activity across whale and accumulation addresses.

Ethereum whales scoop 840,000 ETH, accumulation addresses set new record

Ethereum whales have increased their buying pressure over the past two weeks, following ETH's dip, and have continued even with the recent recovery.

Since September 18, investors with a balance of 10K-100K ETH have grown their collective holdings by 840K ETH, according to CryptoQuant data. Continued buying pressure from whales during price dips often indicates confidence in a price recovery, which has played out in the past week.

A similar action is evident across accumulation addresses — wallets with no selling activity — which added a record 5.6 million ETH to their balance in September. Accumulation addresses have now set a new monthly buying record for a third consecutive month.

ETH Balance on Accumulation Addresses. Source: CryptoQuant

Institutional demand has also returned for the top altcoin, with US spot ETH exchange-traded funds (ETFs) recording three consecutive days of net inflows, totaling $755.2 million on Wednesday, per SoSoValue data.

While underlying demand continues to expand, the recent price recovery has pushed a few whales to partially book profits, according to data compiled by smart money tracker Lookonchain.

On the derivatives side, open interest (OI) has remained largely subdued, despite the price recovery seen over the past week. However, signs of a returning risk-on sentiment emerged on Thursday, following a 280K ETH jump in the metric, per Coinglass data. The lag in OI growth suggests that ETH's recent price recovery is largely driven by spot buying pressure rather than leverage.
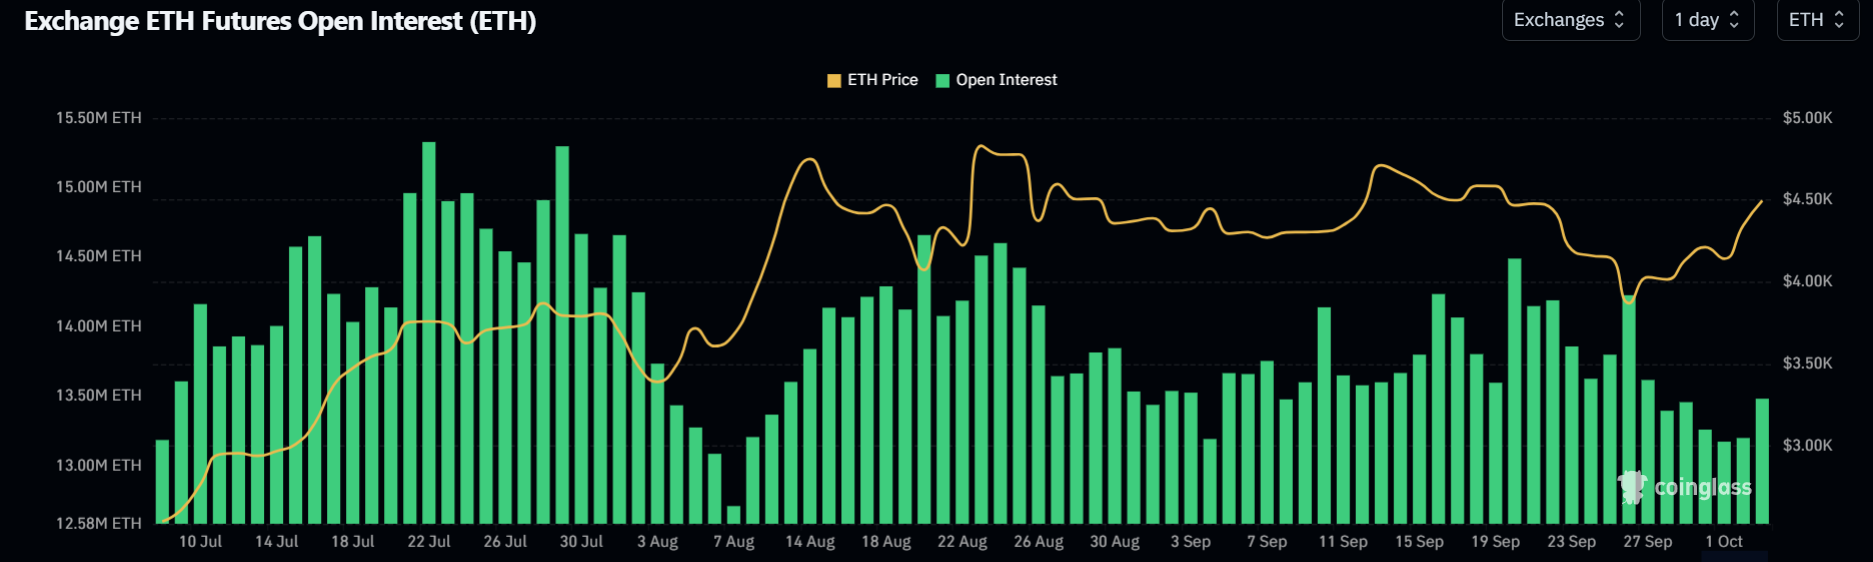
ETH Open Interest. Source: Coinglass

Ethereum Price Forecast: ETH tests $4,500 resistance after clearing 50-day SMA

Ethereum experienced $129.9 million in futures liquidations over the past 24 hours, with short liquidations accounting for $106.2 million.

The top altcoin has crossed above the 50-day Simple Moving Average (SMA) and is now testing the $4,500 resistance, which has proven to be a key level over the past two months. Just above $4,500 lies a descending trendline hurdle that ETH must overcome before a potential move to $4,835.
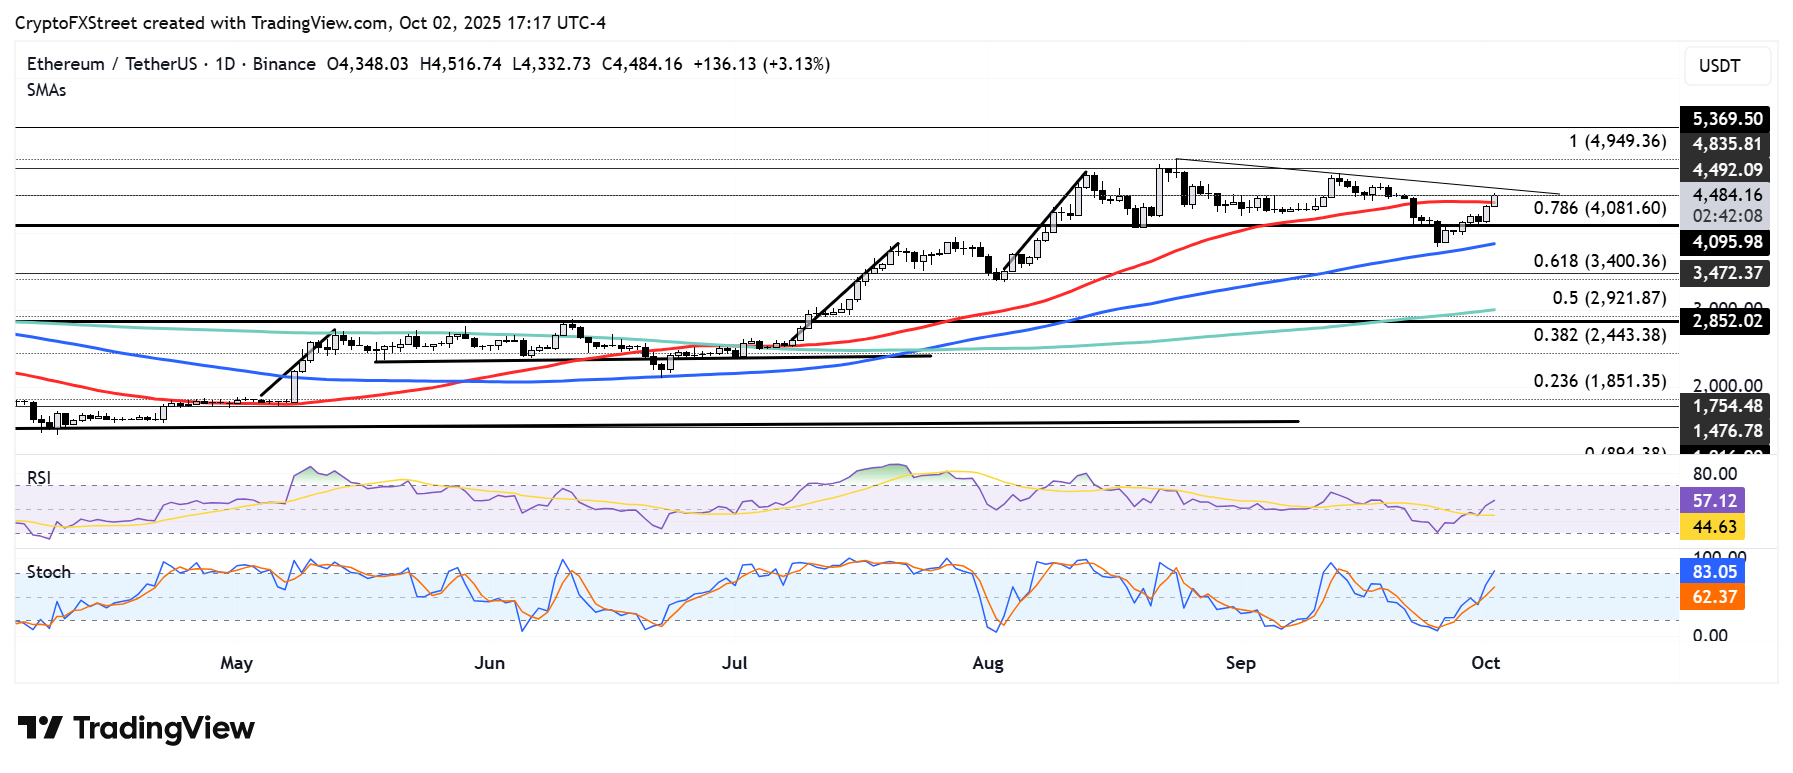
ETH/USDT daily chart

The $4,100 support and 100-day SMA are key levels to watch if ETH sees a rejection at $4,500.

The Relative Strength Index (RSI) is above its neutral level while the Stochastic Oscillator (Stoch) is slightly in the overbought region, indicating dominant bullish momentum.

Disclaimer: For information purposes only. Past performance is not indicative of future results.
placeholder
Anthropic files for a $2 trillion IPO — the $80.7 billion loss is the decoy, the $450 billion compute bill is the riskAnthropic publicly filed its S-1 on October 26, revealing $16.29 billion of first-half revenue (+1,304% year over year) and a $80.7 billion net loss — of which $72.4 billion is a non-cash convertible-note charge. The real number is the $450 billion of signed, mostly non-cancelable compute commitments. Here is what the filing says, why NVDA, ARM and MU are the tradeable read-through, and the conditions that decide whether the AI trade passes its first public valuation test.
Author  Irene Q.
Oct 27, Tue
Anthropic publicly filed its S-1 on October 26, revealing $16.29 billion of first-half revenue (+1,304% year over year) and a $80.7 billion net loss — of which $72.4 billion is a non-cash convertible-note charge. The real number is the $450 billion of signed, mostly non-cancelable compute commitments. Here is what the filing says, why NVDA, ARM and MU are the tradeable read-through, and the conditions that decide whether the AI trade passes its first public valuation test.
placeholder
Brent's $115 front month sits $4.6 above January — the $14 spread to WTI is the supply-risk premiumDecember Brent trades at $115.29 while January is $110.71, a $4.58 backwardation. The December Brent-WTI spread is $14.2, versus a $3-5 normal. That gap, not the headline, is where the Middle East supply risk is priced. Here is what the curve says, why the December contract's expiry on October 30 will mechanically cut the headline by $4.6, and the 108.81 neckline that decides the next move.
Author  Irene Q.
Oct 28, Wed
December Brent trades at $115.29 while January is $110.71, a $4.58 backwardation. The December Brent-WTI spread is $14.2, versus a $3-5 normal. That gap, not the headline, is where the Middle East supply risk is priced. Here is what the curve says, why the December contract's expiry on October 30 will mechanically cut the headline by $4.6, and the 108.81 neckline that decides the next move.
placeholder
Gold Price Analysis Today | Forex Gold Analysis | XAU/USD Analysis - October 29, 2026Get the latest gold price analysis, forex gold insights, and XAU/USD analysis for October 29, 2026. Read on for the details.
Author  Mitrade
Oct 29, Thu
Get the latest gold price analysis, forex gold insights, and XAU/USD analysis for October 29, 2026. Read on for the details.
placeholder
Gold Price Analysis Today | Forex Gold Analysis | XAU/USD Analysis - October 30, 2026Get the latest gold price analysis, forex gold insights, and XAU/USD analysis for October 30, 2026. Read on for the details.
Author  Mitrade
Oct 30, Fri
Get the latest gold price analysis, forex gold insights, and XAU/USD analysis for October 30, 2026. Read on for the details.
placeholder
US GDP grew 3.4% and core PCE held at 3.1% — December is now a hike trade, not a cut tradeUS Q3 GDP rose 3.4%, above the 3.1% estimate, while September headline PCE hit 3.6% and core held at 3.1%. December hike odds are near 90%; inventories, AI capex and energy explain why.
Author  Irene Q.
Oct 30, Fri
US Q3 GDP rose 3.4%, above the 3.1% estimate, while September headline PCE hit 3.6% and core held at 3.1%. December hike odds are near 90%; inventories, AI capex and energy explain why.
Related Instrument
goTop
quote