

Cardano price sets up buying opportunity for ADA to rally 35%

Source Fxstreet
  • Cardano price action continues to consolidate in the $0.600 to $0.650 range. 
  • ADA faces a major supply zone hurdle, extending from $0.631 to $0.678.
  • A flip of this barrier could send ADA to retest the $0.800 and $0.823 levels.

Cardano (ADA) price action is currently being held up by an inclining trendline. While a breakdown would give sidelined buyers an opportunity to accumulate, a breakout above a key hurdle could propel ADA higher. 

Also read: Spot Bitcoin ETF update: The politics behind approvals according to investment bank TD Cowen

Cardano price is at a crossroad

Cardano price slipped into consolidation after setting up a local top at $0.647. Since then, ADA has attempted to continue the ascent by setting up a higher high at $0.680, but the bullish momentum failed to support this move. As a result, ADA has produced a sideways movement that currently trades at $0.608. 

Regardless, ADA has produced a set of higher lows, indicating that the buyers are persistent in buying the dips. 

In the short-term, Cardano price could breach the uptrend line connecting the higher lows produced since December 8. This move could briefly pierce the weekly support level at $0.567 and attempt a sweep of the equal lows around $0.541. 

This 11% retracement in Cardano price is key for sidelined buyers to accumulate ADA at a discount. Additionally, this move would cause the short-sellers to close their positions. These two events create a massive spike in buying pressure, triggering a recovery rally that leads to the reclaim of the 12-hour support level at $0.622. 

In a highly bullish case, if Cardano price can overcome the $0.600 to $0.650 supply zone, it could continue its ascent and attempt to reflect the 55% rally witnessed between December 7 and 13. As a result, ADA could inflate by 35% from the $0.567 weekly support level to tag the $0.800 and $0.823 hurdles.

Read more: Cardano on-chain metrics signal ADA holders should tread with caution
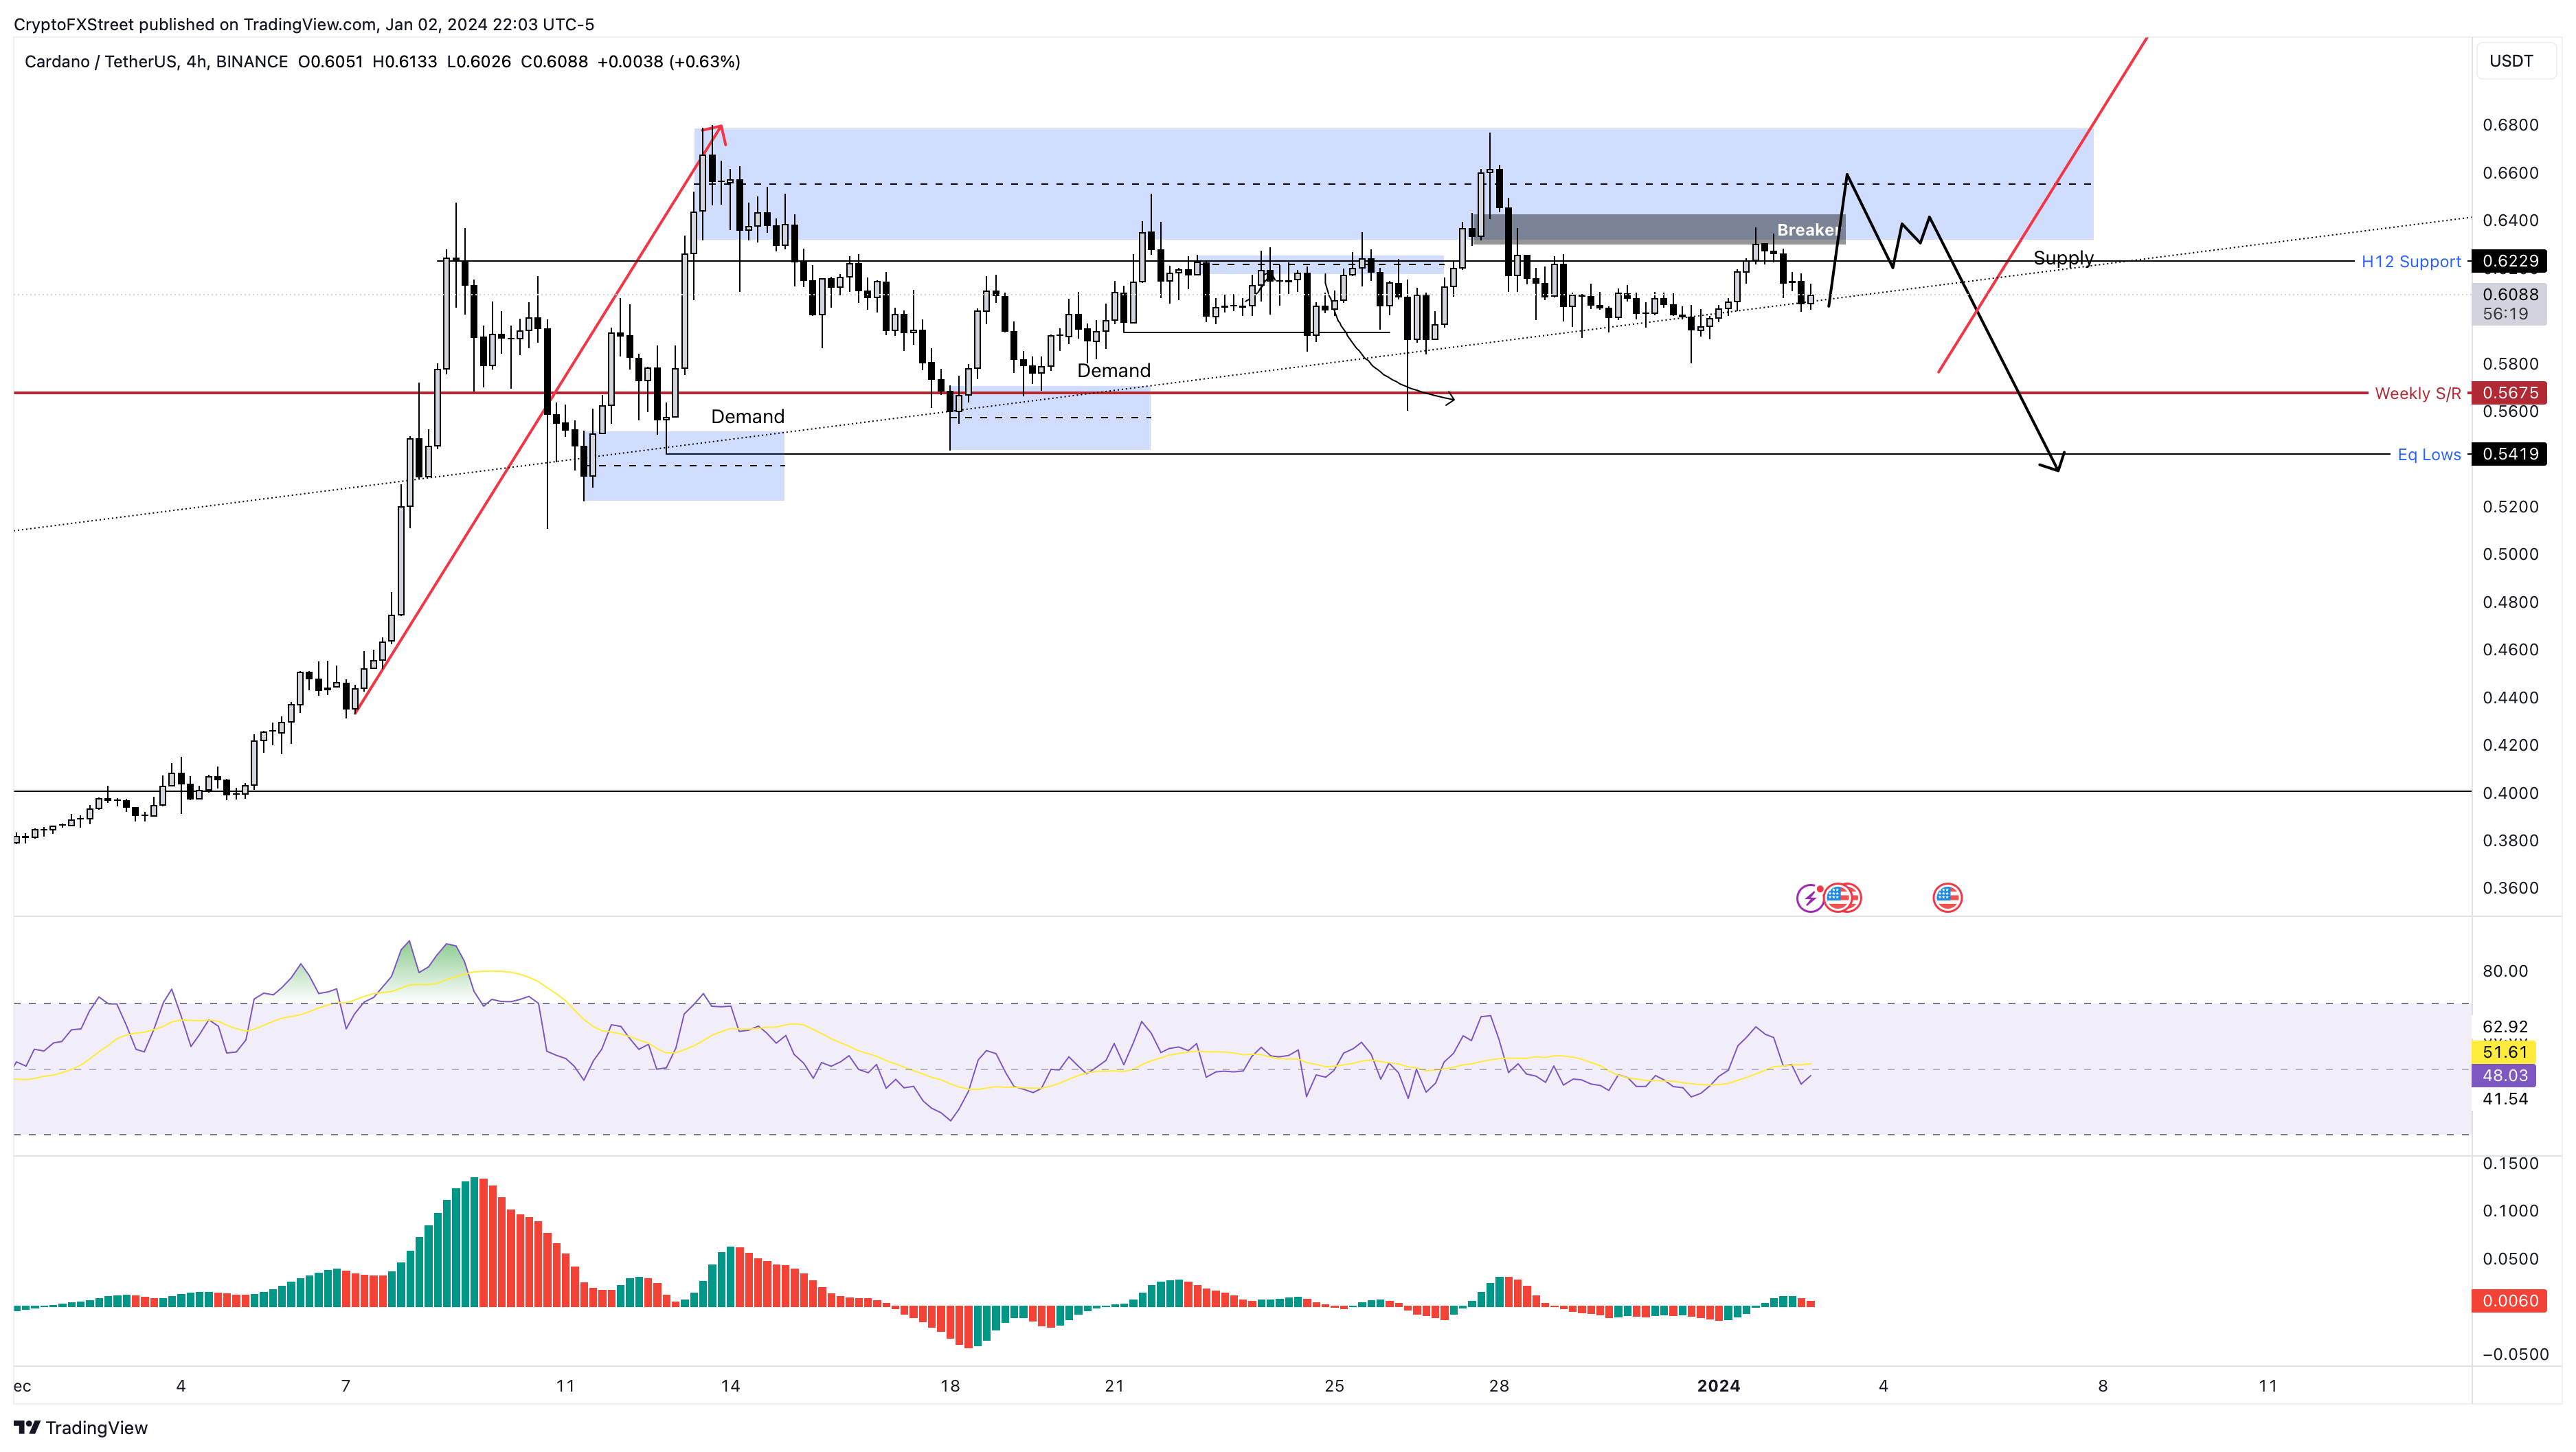
ADA/USDT 4-hour chart

ADA/USDT 4-hour chart

On the other hand, if Cardano price flips the support level of $0.567 level into a resistance barrier on the weekly time frame, it could denote weakness. Additionally, this move would produce a lower low and invalidate the bullish thesis. 

In such a case, Cardano price could crash 25% to tag the $0.400 support level. 

Disclaimer: For information purposes only. Past performance is not indicative of future results.
placeholder
WTI (USOIL) Is down 2.03% on Sep 25: Here Is WhyWTI (USOIL) is down 2.03% at Sep 24 22:20(UTC+0), now at $92.517, with a 7-day down of 3.63%.What is driving WTI (USOIL)’s stock price down today?The drop in WTI crude oil prices was primarily driven by
Author  TradingKey
Sep 25, Fri
WTI (USOIL) is down 2.03% at Sep 24 22:20(UTC+0), now at $92.517, with a 7-day down of 3.63%.What is driving WTI (USOIL)’s stock price down today?The drop in WTI crude oil prices was primarily driven by
placeholder
Silver Price Forecast: XAG/USD remains steady near $64.00 as oil prices easeSilver price (XAG/USD) inches higher after two days of losses, trading around $63.90 per troy ounce during Asian hours on Friday. Non-yielding Silver is finding underlying support as inflation concerns ease following a pullback in crude oil prices.
Author  FXStreet
Sep 25, Fri
Silver price (XAG/USD) inches higher after two days of losses, trading around $63.90 per troy ounce during Asian hours on Friday. Non-yielding Silver is finding underlying support as inflation concerns ease following a pullback in crude oil prices.
placeholder
Gold Price Forecast: Gold Drops Below $4,300, Will It Continue to Fall? As of the European session on September 24, gold prices (XAUUSD) extended their correction, dipping below $4,300 intraday to hit a low of $4,262.45. After previously rebounding close to $
Author  TradingKey
Sep 24, Thu
As of the European session on September 24, gold prices (XAUUSD) extended their correction, dipping below $4,300 intraday to hit a low of $4,262.45. After previously rebounding close to $
placeholder
Yen touches 158.37 as Tokyo reopens, then slips back — ¥15.4 trillion of intervention and the 200-day line stand between here and 160USD/JPY reached 158.37 overnight, its highest since early September, then eased to 157.88 as Japanese markets reopened after a three-day holiday. The Ministry of Finance has spent ¥15.4 trillion defending the yen since late July and the BOJ ran a rate check on September 18. The 200-day average sits at 158.43.
Author  Irene Q.
Sep 24, Thu
USD/JPY reached 158.37 overnight, its highest since early September, then eased to 157.88 as Japanese markets reopened after a three-day holiday. The Ministry of Finance has spent ¥15.4 trillion defending the yen since late July and the BOJ ran a rate check on September 18. The 200-day average sits at 158.43.
placeholder
US input costs rose at the fastest pace in four years — the September flash PMI beat is an inflation story, not a growth storyUS September flash PMIs came in far above expectations, with the composite at 58.4, a five-year high. But the detail that moved markets was input cost inflation at its fastest since October 2022, driven by fuel, transport and supply shortages. Brent is back above $100 and the 10-year Treasury yield has hit its highest since 2007.
Author  Suzie
Sep 24, Thu
US September flash PMIs came in far above expectations, with the composite at 58.4, a five-year high. But the detail that moved markets was input cost inflation at its fastest since October 2022, driven by fuel, transport and supply shortages. Brent is back above $100 and the 10-year Treasury yield has hit its highest since 2007.
Related Instrument
goTop
quote