


Cardano Price Forecast: ADA declines as dormant wallet activity stirs selling pressure
- Cardano price breaks below its ascending trendline, signaling the start of a correction.
- On-chain data indicate that dormant wallets are becoming active, a trend that could intensify selling pressure.
- The technical outlook suggests further downside, with ADA targeting the $0.76 support level.
Cardano (ADA) price extends its losses, trading below $0.82 at the time of writing on Tuesday after breaking below the ascending trendline, suggesting a deeper correction may be ahead. The rising activity among the dormant wallets further supports the bearish sentiment. Meanwhile, the technical analysis suggests further downside, with bears targeting the $0.76 mark.
Dormant wallets are on the move
Santiment's Age Consumed index shown below hints at bearish signs. The spikes in this index suggest dormant tokens (tokens stored in wallets for a long time) are in motion, and it can be used to spot short-term local tops or bottoms.
As in the case of Cardano, history shows that a decline followed the spikes in ADA’s price as holders moved their tokens from wallets to exchanges, thereby increasing selling pressure. The most recent uptick on Monday suggested that ADA was ready for a downtrend.
 [07-1758596946833-1758596946836.32.59, 23 Sep, 2025].png)
Cardano Age consumed chart. Source: Santiment
Apart from rising dormant activity, CryptoQuant data highlights selling pressure on Cardano. The Taker CVD (Cumulative Volume Delta) for Cardano turned negative in mid-August, and the value has been steadily decreasing since then. This indicator measures the cumulative difference between market buy and sell volumes over a three-month period. When the 90-day CVD is positive and increasing, it suggests the Taker Buy Dominant Phase, while a negative and decreasing value indicates the Taker Sell Dominant Phase.
 (1)-1758596968053-1758596968055.png)
ADA Spot Taker CVD chart. Source: CryptoQuant
Cardano Price Forecast: Bears aiming for $0.76 mark
Cardano price broke below the ascending trendline (drawn by connecting multiple lows since early July) on Monday and declined 6.1% closing below the daily support at $0.84. At the time of writing on Tuesday, it continues its correction, trading at $0.81.
If ADA continues its downward trend, it could extend the pullback to retest its 50% price retracement level at $0.76 (drawn from the June low of $0.51 to the August high of $1.02).
The Relative Strength Index (RSI) on the daily chart reads 40, below its neutral level of 50, indicating bearish momentum. Additionally, the Moving Average Convergence Divergence (MACD) also showed a bearish crossover on Monday, signaling a sell and indicating bearish momentum and a downward trend ahead.
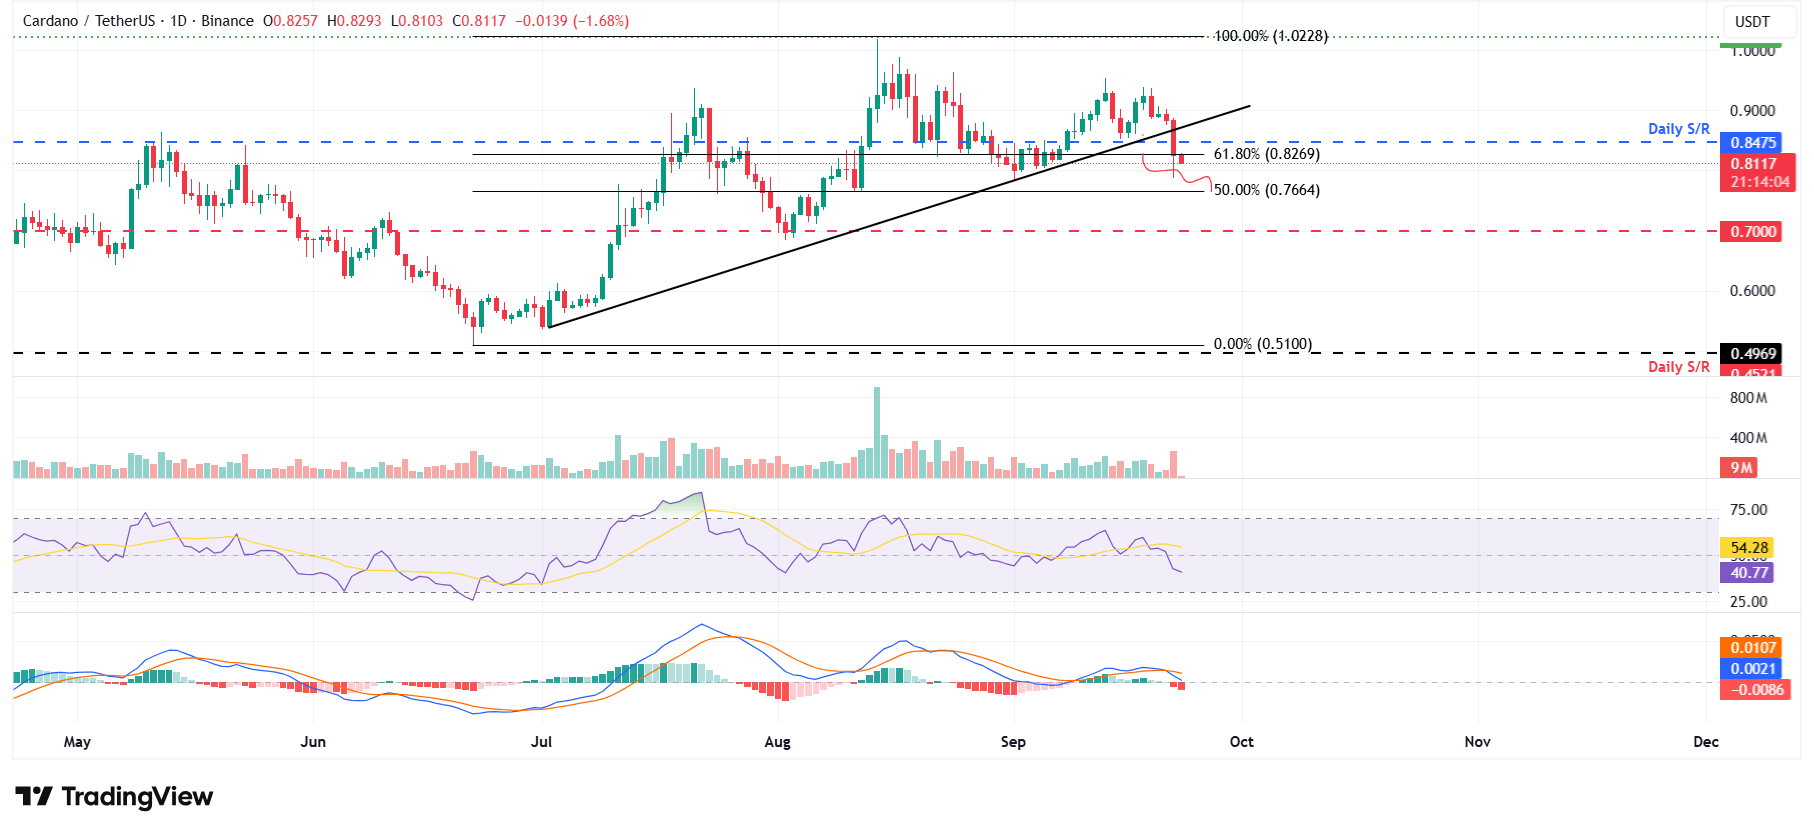
ADA/USDT daily chart
However, if ADA recovers, it could extend the recovery toward the daily resistance level at $0.84.
Recommended Articles


