

BNB’s Breakout Beats Profit-Taking Risks as Price Eyes Four Digits

Source Beincrypto

BNB is now within striking distance of four digits, trading near $958 after a 14% gain over the past month. Unlike other major coins weighed down by profit-taking, BNB has shown resilience. Long-term holders are adding to their stacks, exchange balances are falling, and the BNB price has broken out of a bullish pattern.

Together, these signals show conviction, even as profit-taking risks remain high.

Profit-Taking Risk Is High, but Exchange Supply Is Falling

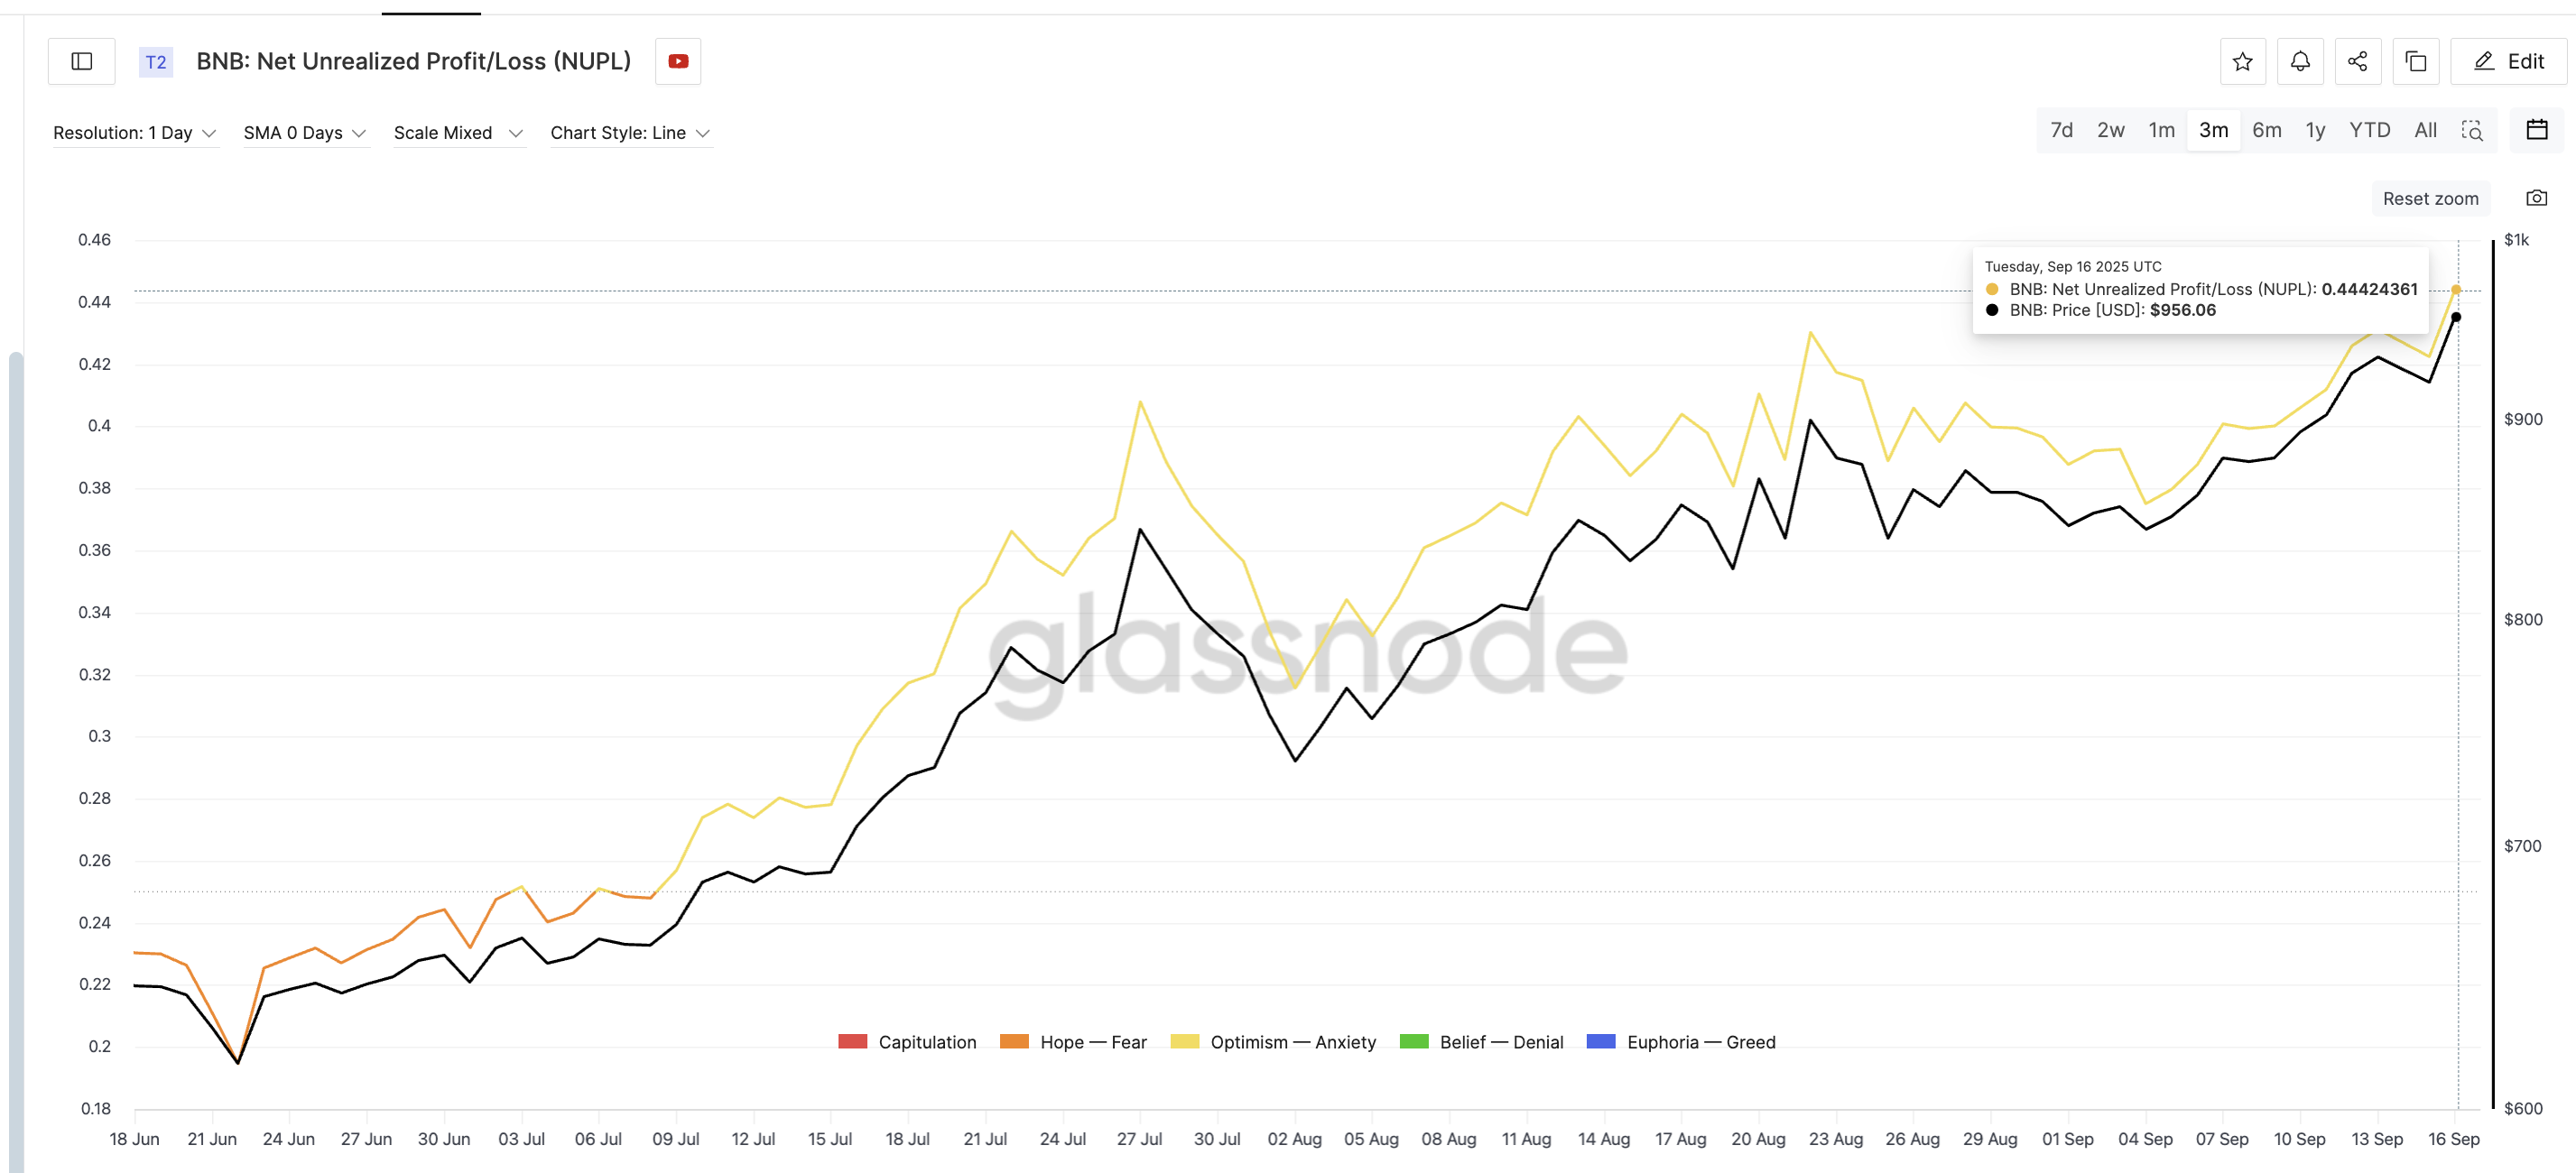
One way to measure selling risk is Net Unrealized Profit/Loss (NUPL), which tracks the percentage of the supply that is in profit. A higher score indicates that investors are sitting on larger gains and may be tempted to sell.

For BNB, NUPL now reads 0.44, its highest level in three months. With BNB up 75% over the past year and nearly 50% in the past three months, profit-taking pressure is a real concern.
BNB NUPL At A 3-Month HighBNB NUPL At A 3-Month High: Glassnode

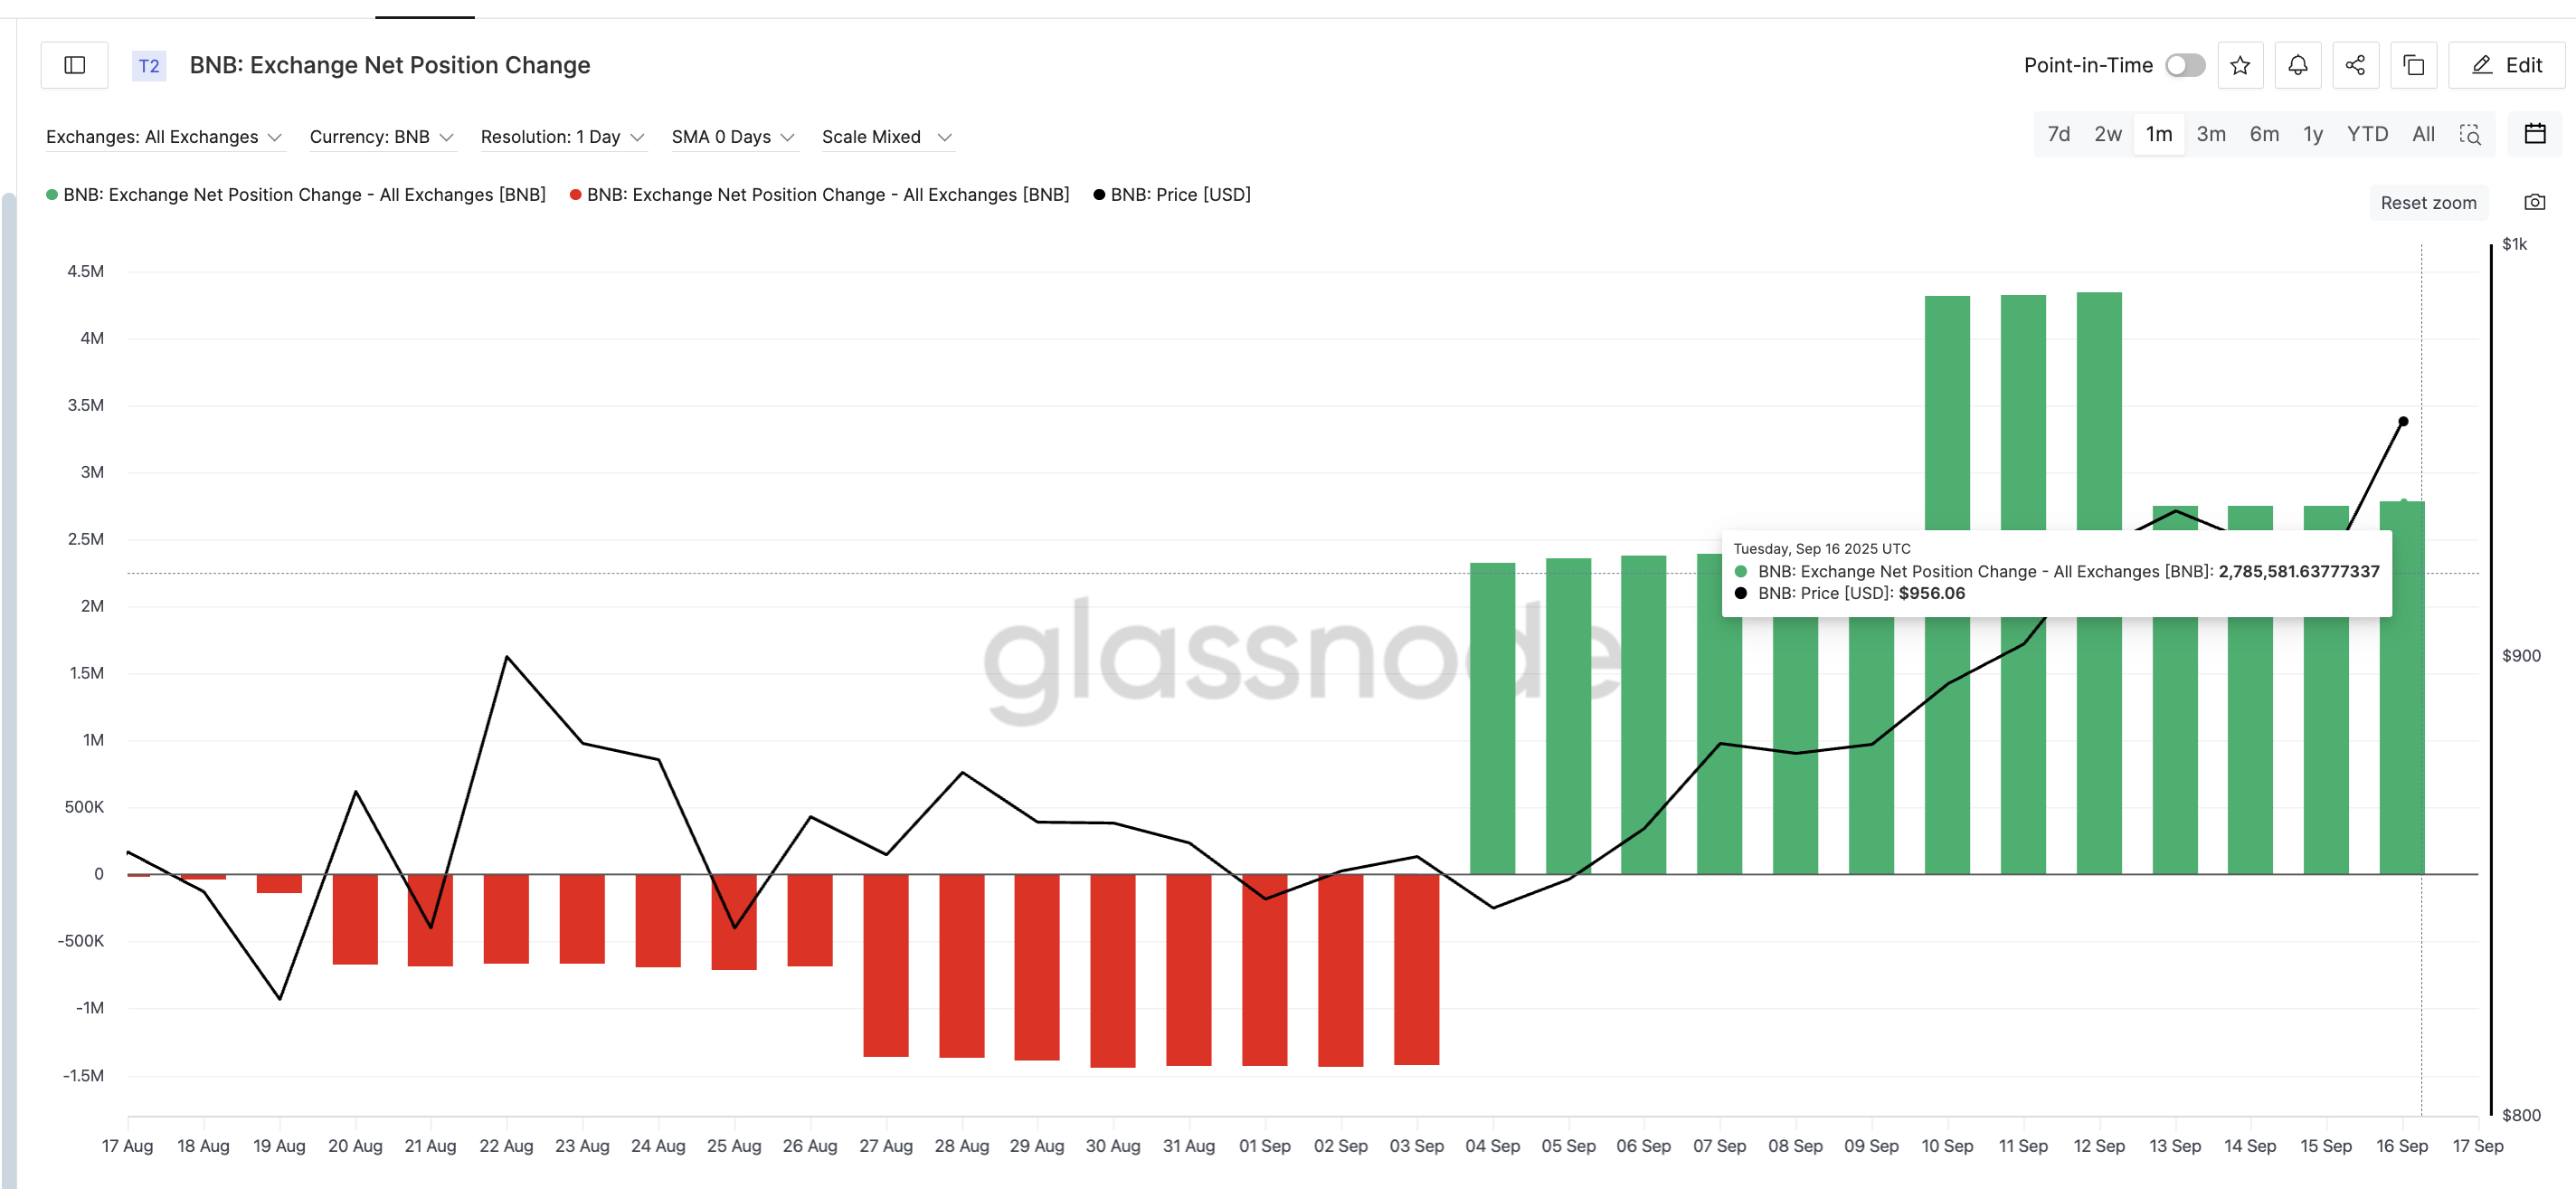
Yet supply on exchanges tells a different story. Exchange net position change — which shows how much BNB sits on trading platforms — has fallen by almost 50% in just four days, from 4.35 million BNB on September 12 to 2.79 million on September 16.

Want more token insights like this? Sign up for Editor Harsh Notariya’s Daily Crypto Newsletter here.
BNB Buyers Are Slowly Coming Back:BNB Buyers Are Slowly Coming Back: Glassnode

Typically, rising profits are accompanied by increased deposits on exchanges. Here, balances are shrinking, showing conviction even in profit-heavy conditions.

It is worth noting that exchange flows are still positive (lingering sell pressure), but the downward curve while the price peaks does invoke confidence in the BNB price structure. More so when, in the next section, we discover which groups are accumulating.

Profitable Cohorts Are Accumulating, Not Selling

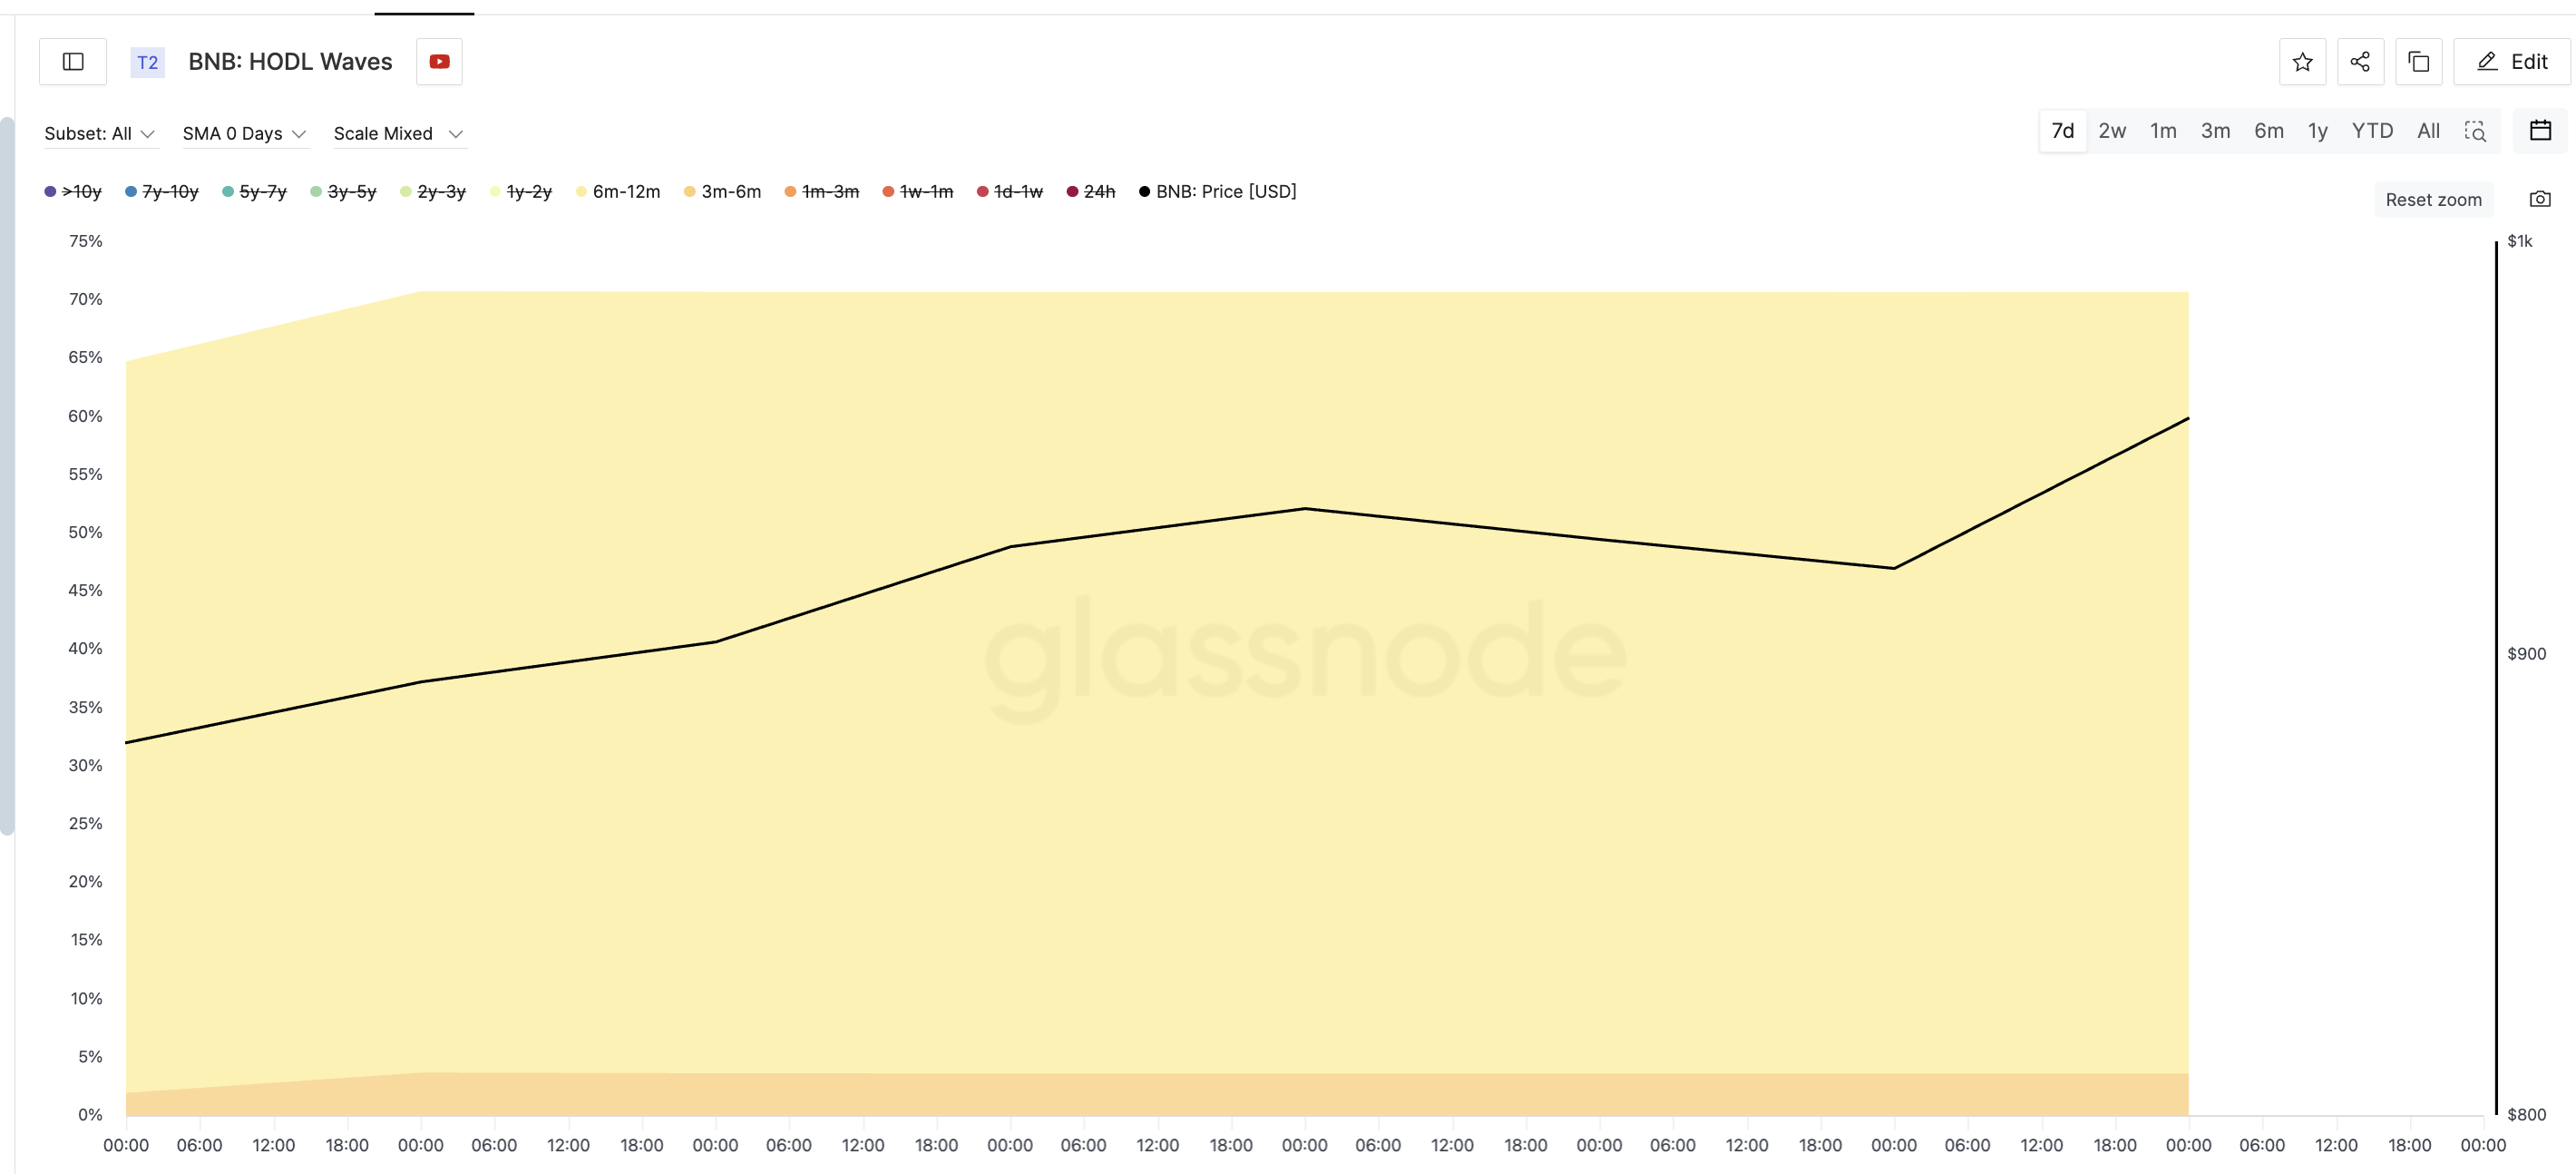
HODL waves track how long coins have been held, helping us see which groups are moving supply. The standout cohorts are 6–12 month holders and 3–6 month holders. Both groups are typically most likely to sell since they are sitting on strong recent gains. Instead, they are accumulating.
BNB HODLers In ActionBNB HODLers In Action: Glassnode

From September 9 to September 16, the 6–12-month group grew from 62.8% of supply to 67.1%. The 3–6 month group nearly doubled from 1.9% to 3.6%. These cohorts alone account for the bulk of new holding growth.

This means traders who bought when BNB was much cheaper are not cashing out. Instead, they are tightening supply as the BNB price rises.

BNB Price Chart Points to Higher, 4-Digit Targets

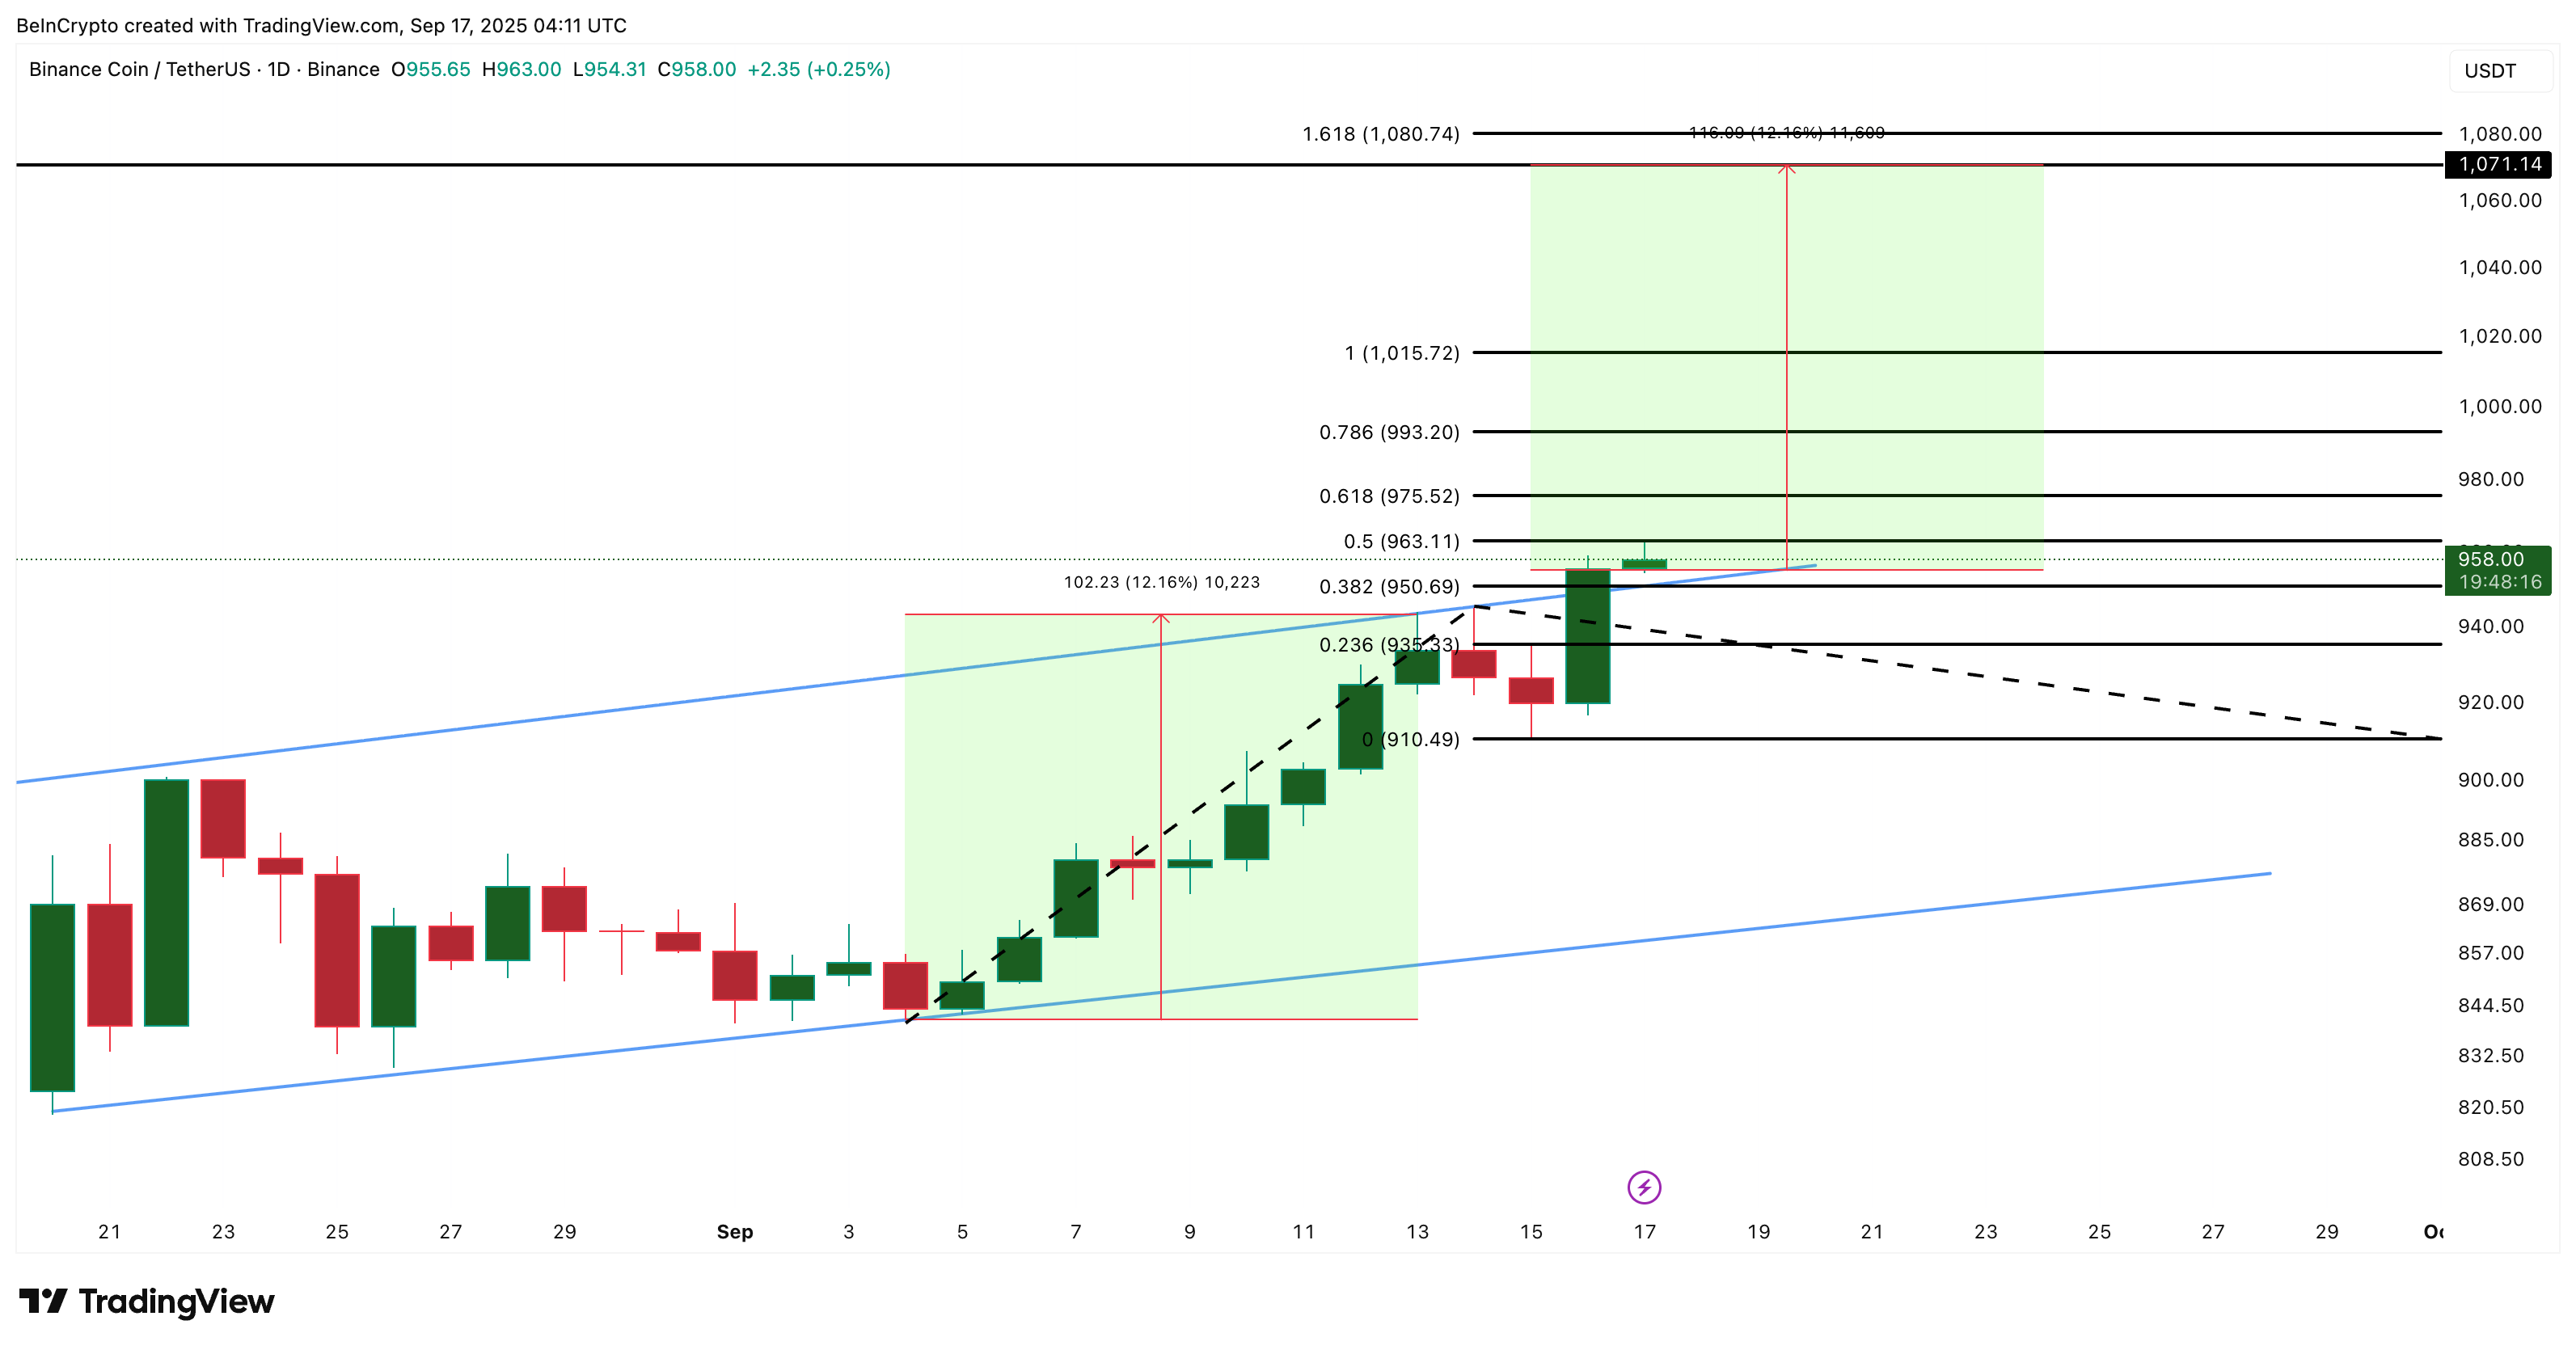
On the daily chart, the BNB price has broken out of an ascending channel, a bullish continuation pattern. Yesterday’s close above the upper trendline confirmed the breakout. Fibonacci extensions highlight resistance at $975 and $1,015, while the next upside target sits around $1,071–$1,080. That zone is the immediate four-digit goal.
BNB Price AnalysisBNB Price Analysis: TradingView

The lower end of the target at $1,071 comes from measuring the widest part of the ascending channel — from its lowest swing inside the channel to its highest point — and projecting that distance upward from the breakout. Key support levels, in case the BNB price corrects, sit at $950 and $935.

Still, there’s a clear invalidation. If BNB closes below $910, the breakout structure weakens and deeper pullbacks open. Until then, both on-chain conviction and chart structure support more upside.

Disclaimer: For information purposes only. Past performance is not indicative of future results.
placeholder
US August CPI lands tonight: after a 5.4% PPI shock, will the Fed hike on September 16?US August PPI came in at 5.4% year-on-year, above the 5.3% consensus, with core PPI at 4.6%. Traders have pushed the odds of a 25bp Fed hike on September 15-16 to around 70%. Tonight's CPI is the last major inflation print before the decision — here is the full calendar, the consensus numbers, and what a hot versus cool reading would mean for the dollar, yields, gold and stocks.
Author  Irene Q.
Sep 11, Fri
US August PPI came in at 5.4% year-on-year, above the 5.3% consensus, with core PPI at 4.6%. Traders have pushed the odds of a 25bp Fed hike on September 15-16 to around 70%. Tonight's CPI is the last major inflation print before the decision — here is the full calendar, the consensus numbers, and what a hot versus cool reading would mean for the dollar, yields, gold and stocks.
placeholder
Brent tests $108 as a key export pipeline stays shut — can the rally clear $110?Brent crude rose 2.55% to $106.97 and WTI 2.32% to $102.30 as a major regional export pipeline remained offline with no restart timeline. Front-month backwardation has widened to $5.53 from $3.84 a week ago, European gas is at its highest since December 2022, and one analyst sees $119.48 if talks stall.
Author  Irene Q.
Sep 14, Mon
Brent crude rose 2.55% to $106.97 and WTI 2.32% to $102.30 as a major regional export pipeline remained offline with no restart timeline. Front-month backwardation has widened to $5.53 from $3.84 a week ago, European gas is at its highest since December 2022, and one analyst sees $119.48 if talks stall.
placeholder
Fed hike odds near 90% into Wednesday's decision — how to trade the dollar, gold and the S&P 500A 0.3% monthly core CPI print has lifted the market-implied probability of a 25bp Fed hike on 16 September to roughly 86.5% ~ 90%, which would be the first increase since July 2023. Here is the decision timeline, the pricing versus the forecasts, both scenarios, and the key levels for the dollar, gold and the S&P 500.
Author  Suzie
Sep 14, Mon
A 0.3% monthly core CPI print has lifted the market-implied probability of a 25bp Fed hike on 16 September to roughly 86.5% ~ 90%, which would be the first increase since July 2023. Here is the decision timeline, the pricing versus the forecasts, both scenarios, and the key levels for the dollar, gold and the S&P 500.
placeholder
Gold falls below $4,300 as higher US yields bolster Fed rate hike betsGold price (XAU/USD) tumbles to near $4,295 during the early Asian session on Tuesday. The precious metal faces some selling pressure as rising bond yields and surging energy prices strengthen expectations that the US Federal Reserve (Fed) will raise interest rates this week. 
Author  FXStreet
Yesterday 01: 23
Gold price (XAU/USD) tumbles to near $4,295 during the early Asian session on Tuesday. The precious metal faces some selling pressure as rising bond yields and surging energy prices strengthen expectations that the US Federal Reserve (Fed) will raise interest rates this week. 
placeholder
【Daily Brief】10-year Treasury yield briefly tops 5%, S&P 500 slips to 7,602 and the dollar firms at 99.3 as the Fed's decision eve beginsThe 10-year Treasury yield touched 5.014% on Monday — its first print above 5% since October 2023 — while the S&P 500 closed 0.48% lower at 7,619.98 and the dollar index firmed to 99.3. Here is the full market wrap ahead of Wednesday's FOMC decision, the dot plot and the August retail sales report, plus today's CLARITY Act Senate vote.
Author  Irene Q.
Yesterday 08: 16
The 10-year Treasury yield touched 5.014% on Monday — its first print above 5% since October 2023 — while the S&P 500 closed 0.48% lower at 7,619.98 and the dollar index firmed to 99.3. Here is the full market wrap ahead of Wednesday's FOMC decision, the dot plot and the August retail sales report, plus today's CLARITY Act Senate vote.
goTop
quote