

Litecoin’s $200 dream might need to take a backseat
- Litecoin price tackles the declining trend line for the third time in nearly two years.
- A breakdown of the $100 psychological level could lead to a correction to $90 or lower levels.
- A breakout above the declining trend line could trigger a move of $119 or higher.
Litecoin (LTC) price has been stuck under a declining trend line, producing lower highs. This development is likely to lead to correction, considering the Bitcoin (BTC) market outlook, which is already bearish.
Also read: Bitcoin Weekly Forecast: BTC looks set for correction amid increasing sell signals
Litecoin price at crossroads
Litecoin price crashed 69% between November 2021 and February 2022, after which the selling pressure slowed down. Since then, LTC has produced three distinctive lower highs, which can be connected via a declining trend line that serves as a resistance level. The current retest has cleared the weekly hurdle at $100 but has not yet breached the trend line.
If the Bitcoin price outlook shifts from sideways to correction, the third retest of the declining trend line for Litecoin price will result in a similar move to the last two. For now, investors can expect a breakdown of the $100 psychological level, followed by a correction to the $90 support level, roughly 13% lower.
A bounce here would be a great buying opportunity, especially if BTC’s outlook changes. In such a case, Litecoin price recovery rally could propel LTC to $119. In a highly bullish case, the altcoin could eye a retest of the $150 key level or the $200 psychological level. Either way, the retest of $200 could take a while.
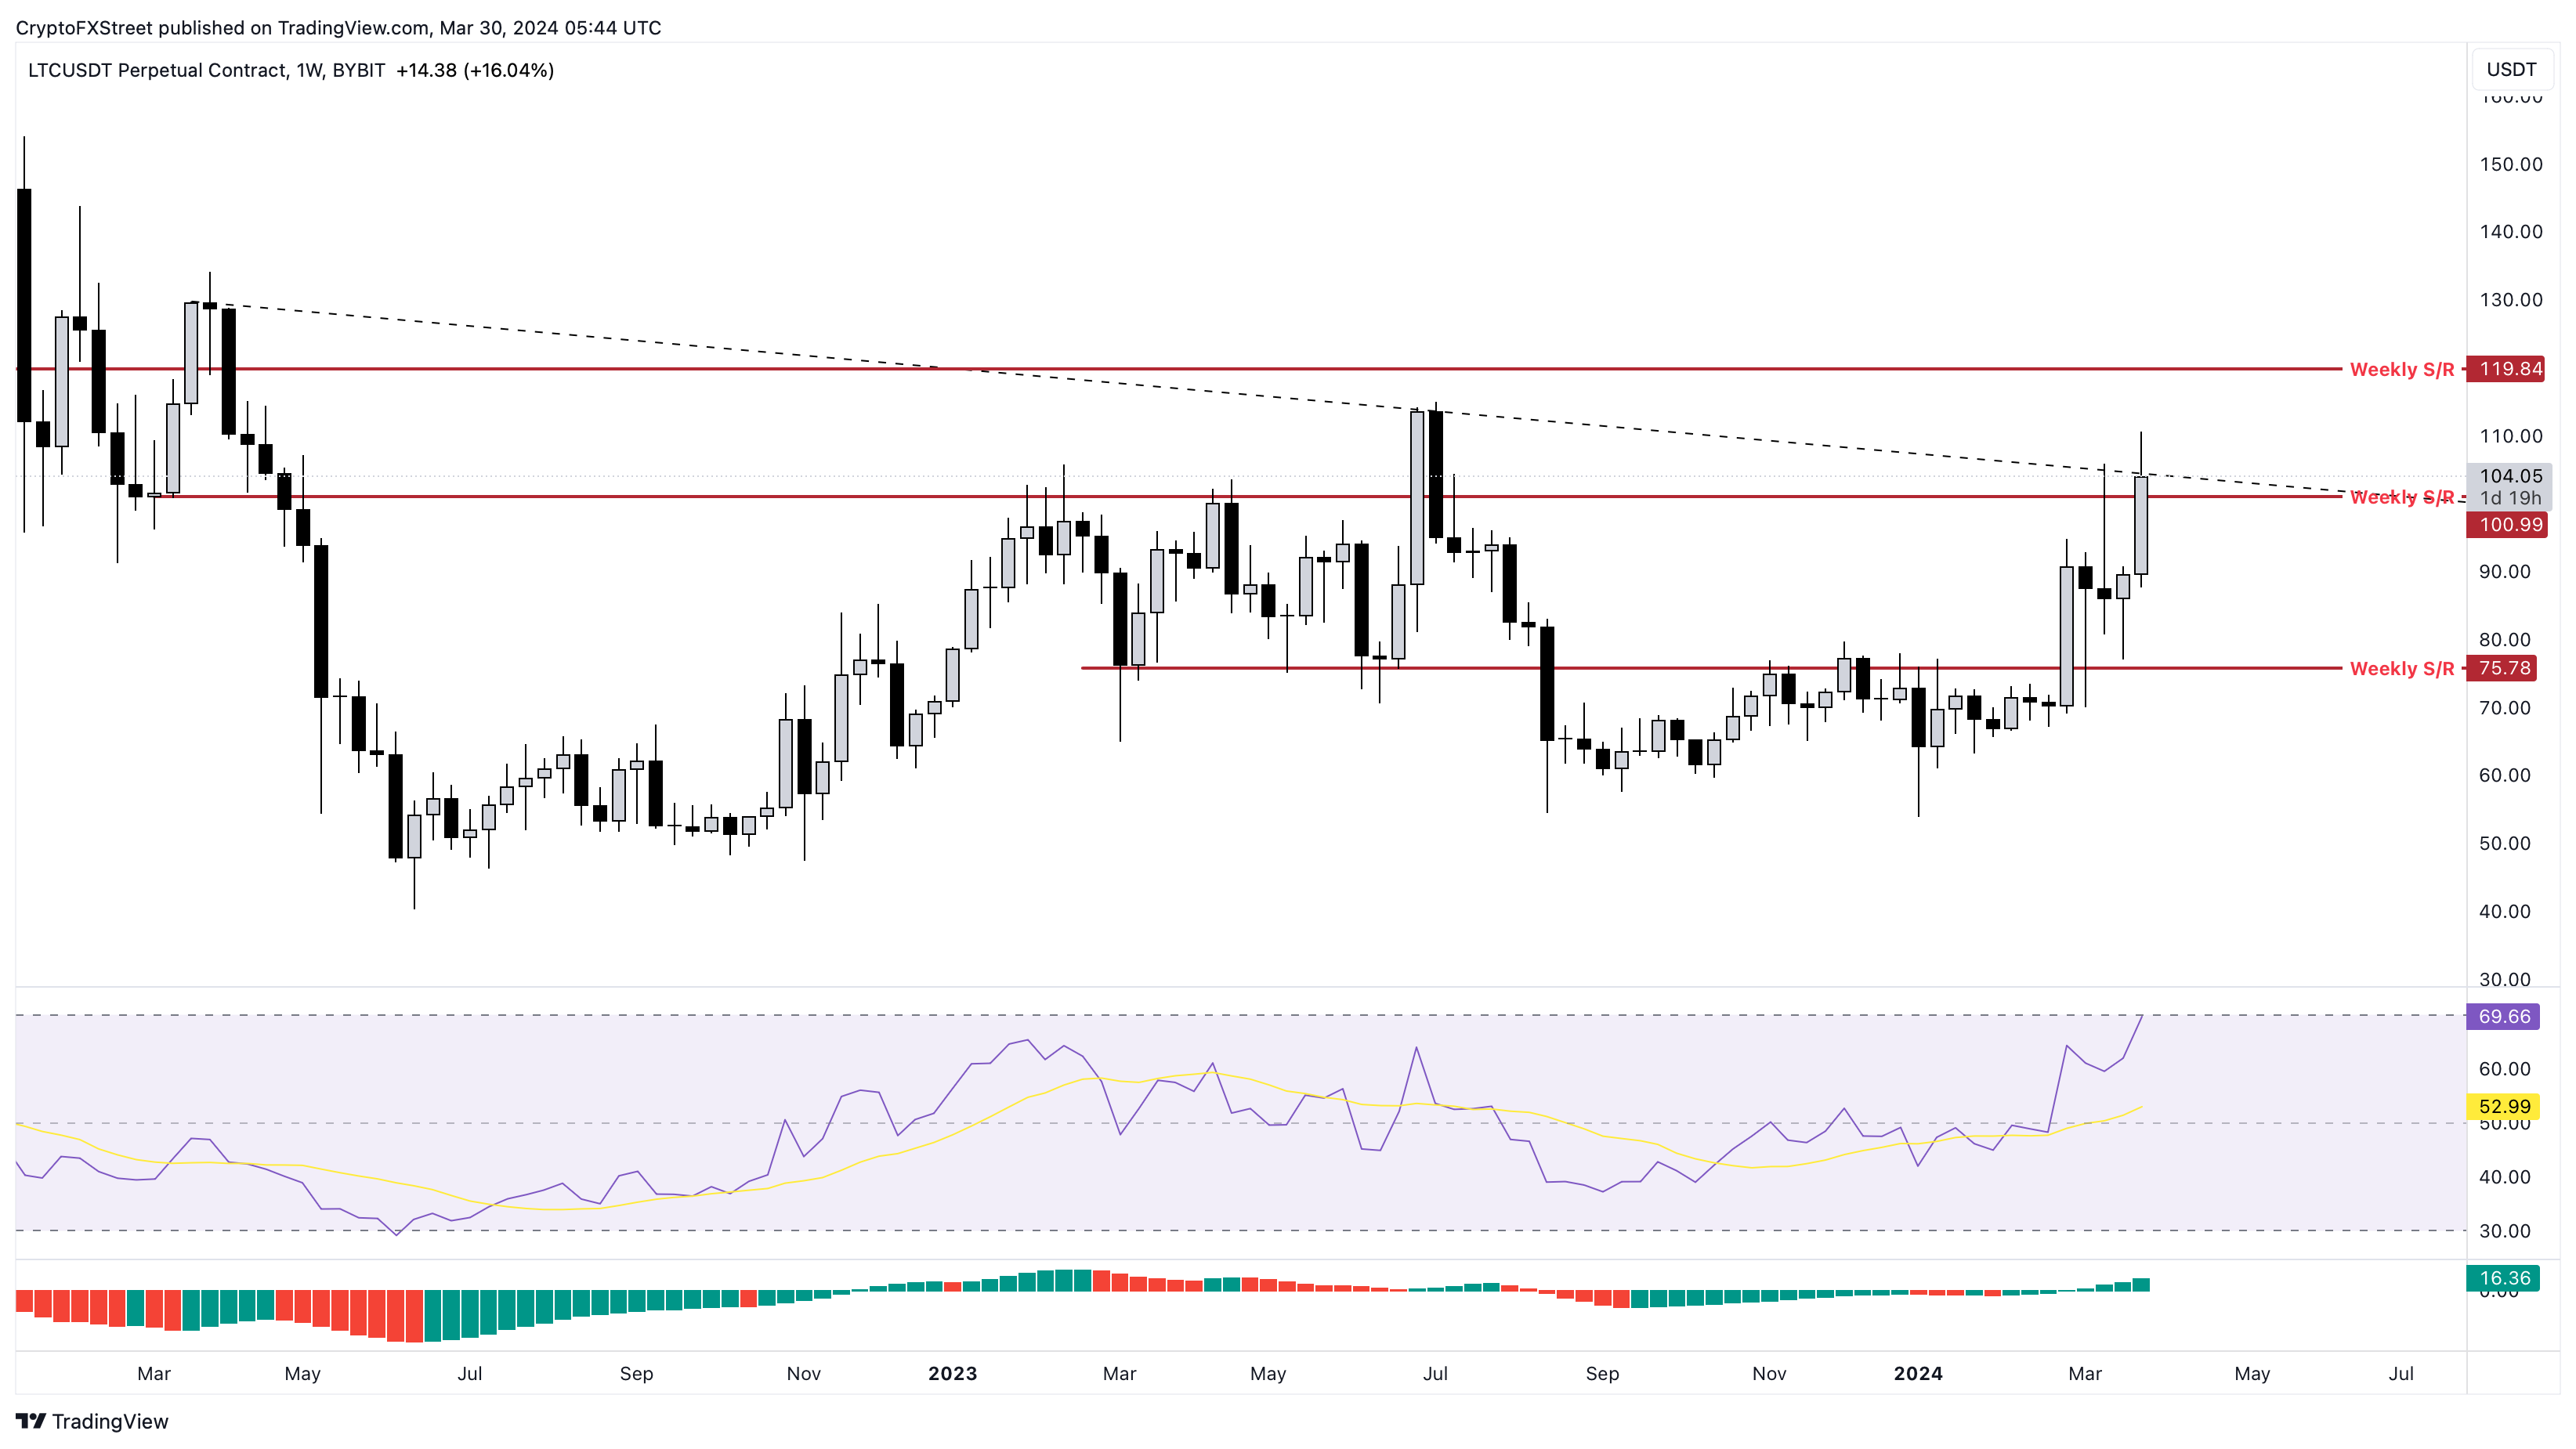
LTC/USDT 1-week chart
While the short-term bearish outlook for Litecoin price looks promising for long-term holders, investors need to pay close attention to Bitcoin price.
If BTC undergoes a steeper correction, it could cause Litecoin price to breach the $90 support level and nose dive 16% to the next key support level at $75.
Recommended Articles


