

Bitcoin Price In A Trend Shift? Here’s Why $118K Might Be Vital For A Bullish Return

Source Newsbtc

The price of Bitcoin has struggled to make any real headway since reaching the former all-time high around $123,800 in mid-July. While the premier cryptocurrency set a new record-high price at around $124,120, it never really looked certain to go on a fresh bullish run.

Over the past week, the market leader succumbed to severe bearish pressure, falling briefly beneath the $112,000 level on Thursday, August 21. However, the Bitcoin price—and the rest of the market—reacted positively to the speech of the US Federal Reserve (Fed) Chairman Jerome Powell on Friday, August 22.

A prominent on-chain analyst on the X platform has identified a price level that could be crucial to Bitcoin resuming its bullish trend.

What Does A Return Above $118,000 Mean For BTC?

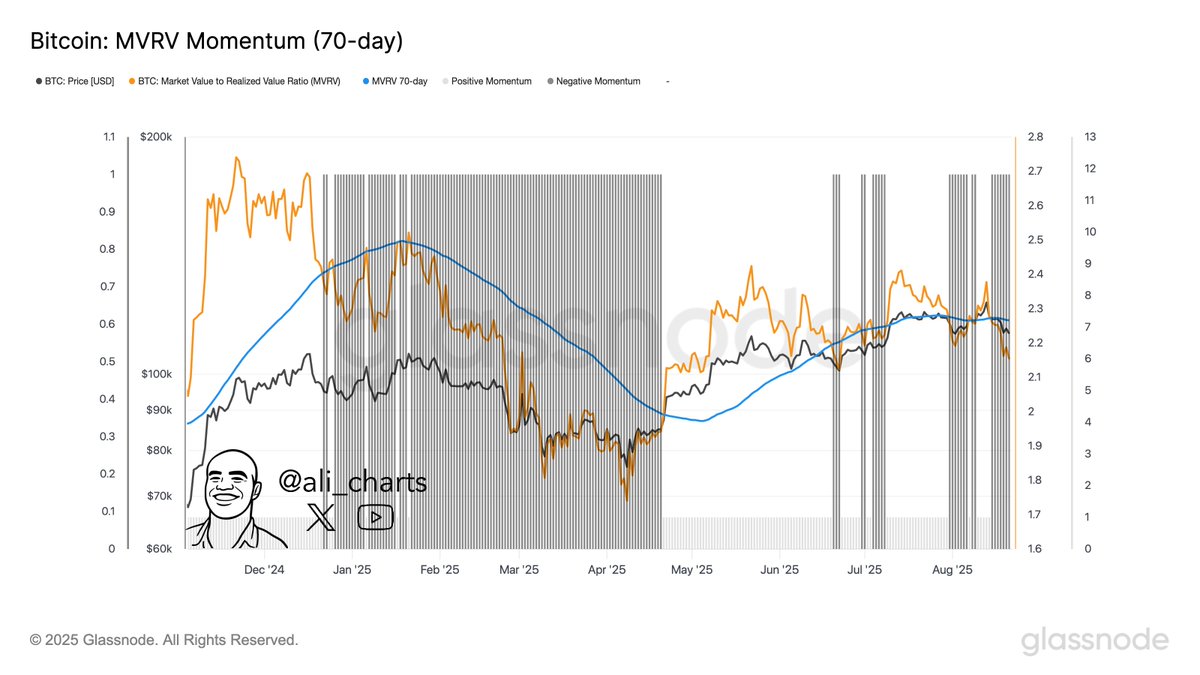
In an August 23 post on social media platform X, crypto analyst Ali Martinez pinpointed $118,000 as the most important level for Bitcoin’s next course of action. According to the online pundit, the price of BTC needs to quickly reclaim this price level in order to return to its bullish tracks.

This relevant indicator here is the Glassnode MVRV (Market Value to Realized Value) Momentum indicator, which helps in identifying macro market trends. This metric consists of the MVRV ratio and the 70-day simple moving average (SMA). 

When the MVRV ratio breaks above this 70-day SMA, it indicates a transition into the bull market. Meanwhile, a break below the simple moving average signals a shift to the bearish phase.

Typically, strong breaks above the MVRV 70-day moving average imply that large volumes of Bitcoin were purchased below the current price, showing that the holders are now in profit (light area in the highlighted chart). On the other hand, a strong breach below the moving average suggests that large volumes of BTC were acquired above the current price, with the holders in the red (shaded area in the chart below).
Bitcoin price

As observed in the chart above and highlighted by Martinez, the Bitcoin price is witnessing a trend shift at the moment. The crypto analyst then suggested that the 70-day SMA is currently around the $118,000 region, with the MVRV ratio needing to break above the moving average for Bitcoin to return to bullish momentum.

Bitcoin Price At A Glance

As of this writing, the price of BTC stands at around $116,217, reflecting an over 2% increase in the past 24 hours. However, the flagship cryptocurrency is still down by more than 1% on the weekly timeframe.

Bitcoin price
Disclaimer: For information purposes only. Past performance is not indicative of future results.
placeholder
Gold rebounds above $4,350 as US Dollar, Treasury yields slipGold price (XAU/USD) rebounds from a nearly one-month low to around $4,385 during the early Asian session on Thursday. The precious metal edges higher as the ‌US Dollar (USD) and Treasury yields retreat from recent highs.
Author  FXStreet
Sep 03, Thu
Gold price (XAU/USD) rebounds from a nearly one-month low to around $4,385 during the early Asian session on Thursday. The precious metal edges higher as the ‌US Dollar (USD) and Treasury yields retreat from recent highs.
placeholder
Gold rebounds above $4,450 as Waller tempers Fed rate hike bets ahead US jobs dataGold price (XAU/USD) gains momentum to around $4,470 during the early Asian session on Friday. The precious metal extended its recovery as Federal Reserve (Fed) rate hike bets ease. All eyes will be on the US August Nonfarm Payrolls (NFP) report, which is due later on Friday. 
Author  FXStreet
Sep 04, Fri
Gold price (XAU/USD) gains momentum to around $4,470 during the early Asian session on Friday. The precious metal extended its recovery as Federal Reserve (Fed) rate hike bets ease. All eyes will be on the US August Nonfarm Payrolls (NFP) report, which is due later on Friday. 
placeholder
Hot August jobs report reignites Fed-hike bets; S&P 500 slips below 7,700 — what to watch before the September FOMCAugust nonfarm payrolls surged to 162,000, three times the consensus, pushing CME FedWatch odds of a September 25-bp hike to 58.4% and dragging the S&P 500 below 7,700. CPI, PPI and the Sept 15-16 FOMC decision now set the tone for US stocks.
Author  Irene Q.
Sep 07, Mon
August nonfarm payrolls surged to 162,000, three times the consensus, pushing CME FedWatch odds of a September 25-bp hike to 58.4% and dragging the S&P 500 below 7,700. CPI, PPI and the Sept 15-16 FOMC decision now set the tone for US stocks.
placeholder
Japanese Yen rallies to February 18 high as upbeat wage data and GDP lift BoJ hike betsThe USD/JPY pair declines for the second straight day – also marking the fourth day of a fall in the previous five – and sinks to its lowest level since February 18, around mid-153.00s during the Asian session on Tuesday.
Author  FXStreet
23 hours ago
The USD/JPY pair declines for the second straight day – also marking the fourth day of a fall in the previous five – and sinks to its lowest level since February 18, around mid-153.00s during the Asian session on Tuesday.
placeholder
AUD/USD climbs for a fourth day to 0.7218 as Fed-hike bets fail to lift the dollar; RBA speakers and US CPI now in focusThe Australian dollar has risen for four straight sessions toward 0.72 even after August nonfarm payrolls far exceeded expectations and pushed September Fed-hike odds to 58.4%. A thin, holiday-thinned dollar is the short-term driver; Westpac confidence and RBA speakers today, US PPI/CPI this week and the Sept 15-16 FOMC will decide whether the rally holds.
Author  Irene Q.
17 hours ago
The Australian dollar has risen for four straight sessions toward 0.72 even after August nonfarm payrolls far exceeded expectations and pushed September Fed-hike odds to 58.4%. A thin, holiday-thinned dollar is the short-term driver; Westpac confidence and RBA speakers today, US PPI/CPI this week and the Sept 15-16 FOMC will decide whether the rally holds.
goTop
quote