

XRP Price Trapped Below Resistance – Bulls Running Out of Steam?

Source Newsbtc

XRP price is struggling to continue higher above the $3.020 zone. The price is consolidating and might decline below the $2.920 support.

  • XRP price is correcting gains from the $3.10 zone.
  • The price is now trading near $2.980 and the 100-hourly Simple Moving Average.
  • There is a bearish trend line forming with resistance at $3.020 on the hourly chart of the XRP/USD pair (data source from Kraken).
  • The pair could start another increase if it stays above the $2.880 zone.

XRP Price Faces Resistance

XRP price failed to continue higher above the $3.10 resistance zone, like Bitcoin and Ethereum. The price formed a short-term top and started a fresh decline below the $3.020 level.

The price dipped below the $3.00 level. There was a move below $2.950 and the price tested the 50% Fib retracement level of the upward move from the $2.730 swing low to the $3.106 high. However, the bulls were active near the $2.920 zone.

The price is now trading near $2.980 and the 100-hourly Simple Moving Average. On the upside, the price might face resistance near the $3.00 level. There is also a bearish trend line forming with resistance at $3.020 on the hourly chart of the XRP/USD pair.
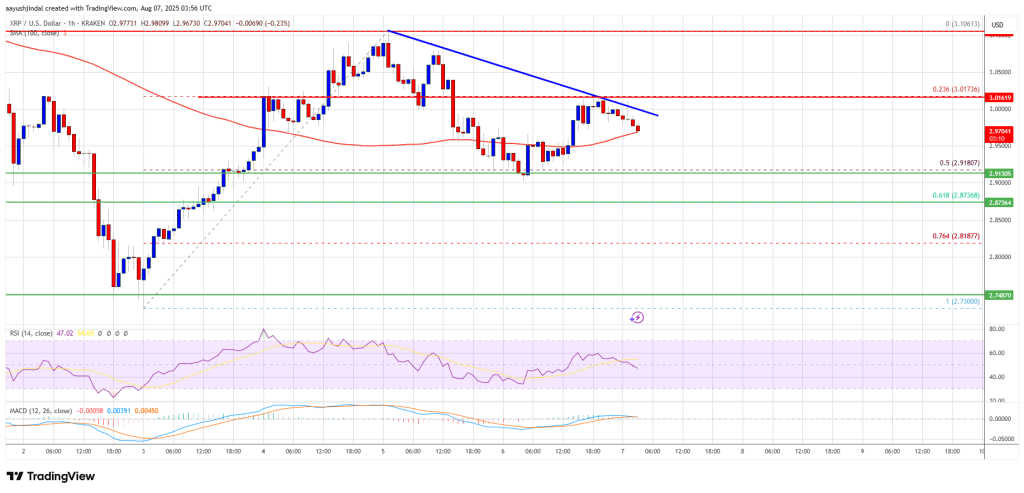
XRP Price

The first major resistance is near the $3.10 level. A clear move above the $3.10 resistance might send the price toward the $3.120 resistance. Any more gains might send the price toward the $3.180 resistance or even $3.20 in the near term. The next major hurdle for the bulls might be near the $3.250 zone.

Another Decline?

If XRP fails to clear the $3.020 resistance zone, it could start another decline. Initial support on the downside is near the $2.920 level. The next major support is near the $2.880 level or the 61.8% Fib retracement level of the upward move from the $2.730 swing low to the $3.106 high.

If there is a downside break and a close below the $2.880 level, the price might continue to decline toward the $2.810 support. The next major support sits near the $2.750 zone where the bulls might take a stand.

Technical Indicators

Hourly MACD – The MACD for XRP/USD is now losing pace in the bearish zone.

Hourly RSI (Relative Strength Index) – The RSI for XRP/USD is now below the 50 level.

Major Support Levels – $2.920 and $2.880.

Major Resistance Levels – $3.020 and $3.10.

Disclaimer: For information purposes only. Past performance is not indicative of future results.
placeholder
WTI drops to near $97.50 as US waives Russia oil sanctionsWest Texas Intermediate (WTI) oil price declines after seven days of gains, trading around 97.40 per barrel during Asian hours on Monday.
Author  FXStreet
Yesterday 01: 21
West Texas Intermediate (WTI) oil price declines after seven days of gains, trading around 97.40 per barrel during Asian hours on Monday.
placeholder
Gold Price Analysis Today | Forex Gold Analysis | XAU/USD Analysis - October 19, 2026Get the latest gold price analysis, forex gold insights, and XAU/USD analysis for October 19, 2026. Read on for the details.
Author  Mitrade
Yesterday 02: 11
Get the latest gold price analysis, forex gold insights, and XAU/USD analysis for October 19, 2026. Read on for the details.
placeholder
Gold retests $4,200 as dollar and yields retreat — can bullion clear its hardest level?Spot gold traded near $4,175 on Monday (+0.23%), with an intraday high of $4,187.71 after last week's $4,073 ~ $4,217 range; COMEX futures briefly topped $4,200. The dollar slipped to 101.76 and 10-year yields eased from their highs, but October Fed hike odds near 52% and BofA's sub-$4,000 call still cap the upside. Here are the drivers, the levels and what would flip the script.
Author  Irene Q.
Yesterday 06: 25
Spot gold traded near $4,175 on Monday (+0.23%), with an intraday high of $4,187.71 after last week's $4,073 ~ $4,217 range; COMEX futures briefly topped $4,200. The dollar slipped to 101.76 and 10-year yields eased from their highs, but October Fed hike odds near 52% and BofA's sub-$4,000 call still cap the upside. Here are the drivers, the levels and what would flip the script.
placeholder
Brent slips from $110 as Russian supply prospects return — is the five-month rally over?Brent crude traded near $108.06 on Monday (-1.71%), pulling back from last week's $110 high after Washington moved to ease restrictions on Russian oil flows. WTI hovered around $101 before dipping below $99. The retreat is real, but so is the supply-risk premium: Hormuz shipping disruptions, attacks on Saudi energy infrastructure and strikes on Russian refineries remain live. Here are the three numbers, the transmission chain and the levels that matter.
Author  Irene Q.
Yesterday 06: 30
Brent crude traded near $108.06 on Monday (-1.71%), pulling back from last week's $110 high after Washington moved to ease restrictions on Russian oil flows. WTI hovered around $101 before dipping below $99. The retreat is real, but so is the supply-risk premium: Hormuz shipping disruptions, attacks on Saudi energy infrastructure and strikes on Russian refineries remain live. Here are the three numbers, the transmission chain and the levels that matter.
placeholder
Gold Price Analysis Today | Forex Gold Analysis | XAU/USD Analysis - October 20, 2026Get the latest gold price analysis, forex gold insights, and XAU/USD analysis for October 20, 2026. Read on for the details.
Author  Mitrade
3 hours ago
Get the latest gold price analysis, forex gold insights, and XAU/USD analysis for October 20, 2026. Read on for the details.
goTop
quote